tidy3d.ApodizationSpec#
- class ApodizationSpec[source]#
Bases:
Tidy3dBaseModelStores specifications for the apodizaton of frequency-domain monitors.
- Parameters:
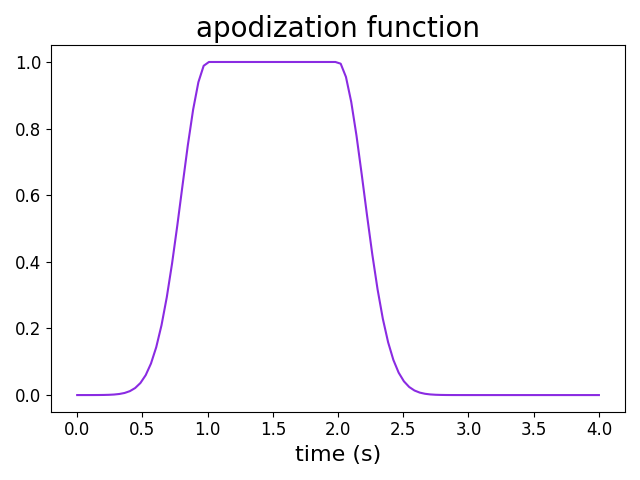
start (Optional[NonNegativeFloat] = None) – [units = sec]. Defines the time at which the start apodization ends.
end (Optional[NonNegativeFloat] = None) – [units = sec]. Defines the time at which the end apodization begins.
width (Optional[PositiveFloat] = None) – [units = sec]. Characteristic decay length of the apodization function, i.e., the width of the ramping up of the scaling function from 0 to 1.
Example
>>> apod_spec = ApodizationSpec(start=1, end=2, width=0.2)
Attributes
Methods
Ensure end is greater than or equal to start.
plot(times[, ax])Plot the apodization function.
Check that width is provided if either start or end apodization is requested.
- start#
- end#
- width#
- width_provided()[source]#
Check that width is provided if either start or end apodization is requested.
- plot(times, ax=None)[source]#
Plot the apodization function.
- Parameters:
times (np.ndarray) – Array of times (seconds) to plot source at. To see source time amplitude for a specific
Simulation, passsimulation.tmesh.ax (matplotlib.axes._subplots.Axes = None) – Matplotlib axes to plot on, if not specified, one is created.
- Returns:
The supplied or created matplotlib axes.
- Return type:
matplotlib.axes._subplots.Axes