

Two-Segment Silicon Microring Modulator
Learning objectives
Section titled “Learning objectives”By the end of this tutorial, you will know how to:
- Build an analytical waveguide model for passive and active (phase-shifting) segments, parameterized by effective index, group index, loss, and .
- Replace a full-wave S-matrix with a compact model: characterize a directional coupler with a coarse full-wave simulation, then substitute it with an analytical DirectionalCouplerModel that preserves power coupling for efficient, fine-grained frequency sweeps.
- Run time-domain electro-optic simulations by driving the modulator with PRBS electrical waveforms and observing the recovered optical and electrical signals.
- Generate an eye diagram from the detector output to evaluate signal integrity at the target symbol rate.
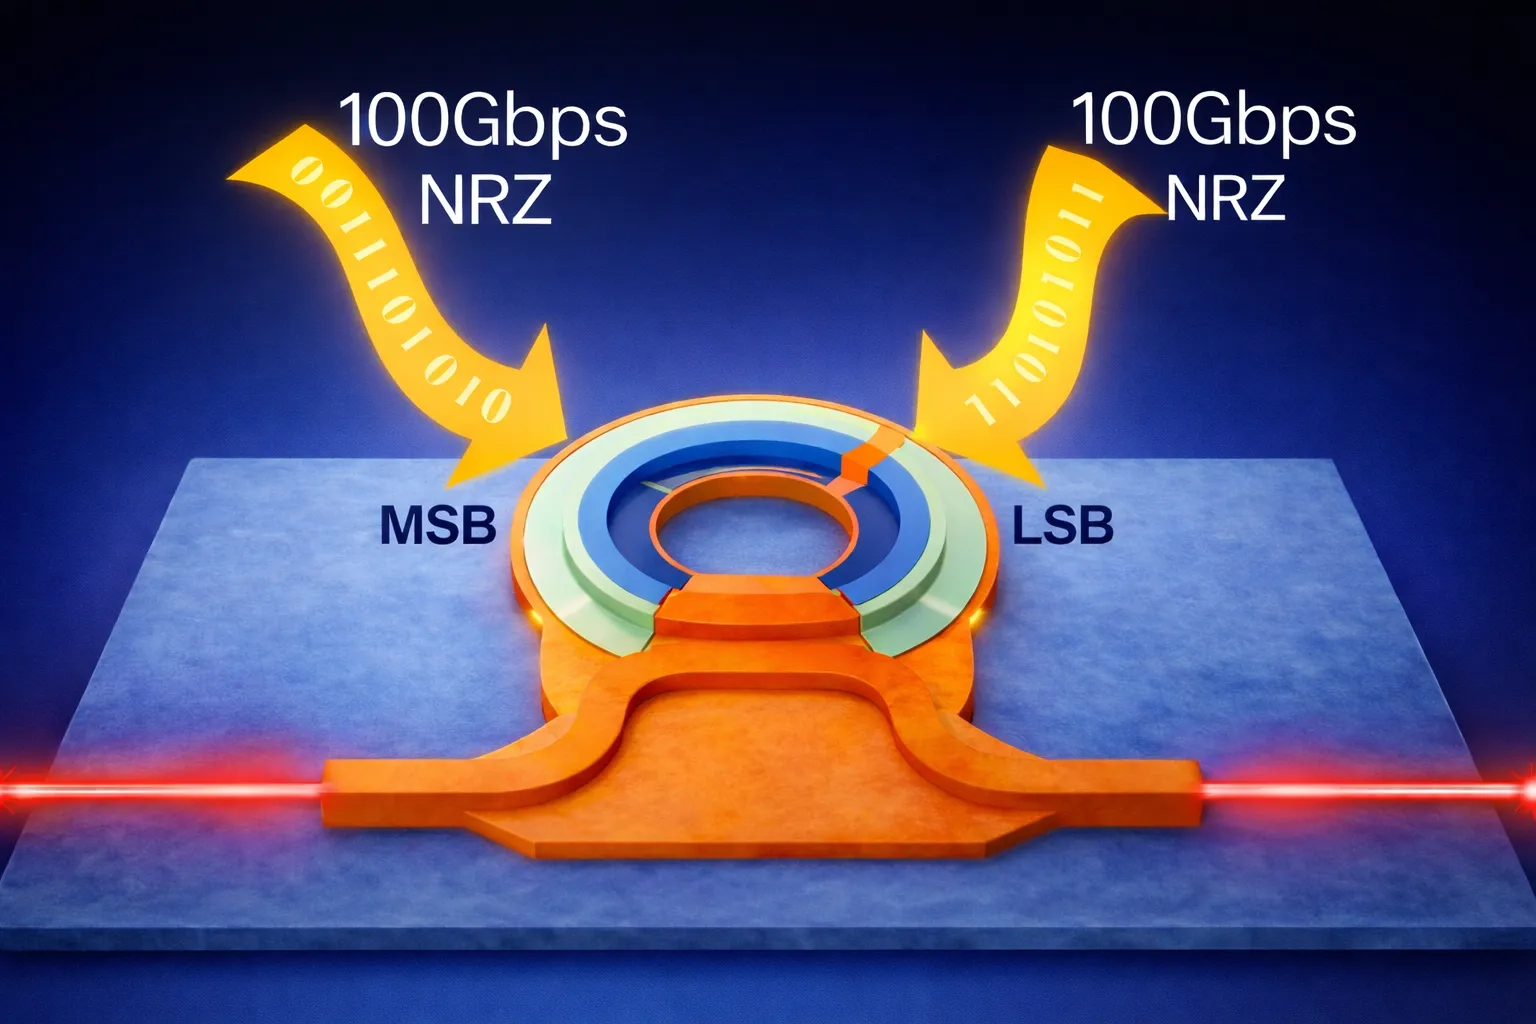
In this notebook, we develop a compact, physics-informed simulation replica of the two-segment silicon microring modulator reported in [1]. Rather than relying on full-wave electromagnetic simulations throughout, we combine analytical device models, circuit-level abstractions, and time-domain signal modeling to reproduce the key behaviors observed experimentally, while maintaining computational efficiency and transparency.
The workflow begins by defining the waveguide geometry and extracting the effective and group indices using a mode solver. A directional coupler is first characterized using a coarse full-wave S-matrix calculation, after which it is replaced by an analytical coupler model that preserves power coupling while discarding phase details. Because, certain physical effects—such as charge-dependent propagation loss and electro-optic modulation behavior—cannot be conveniently incorporated at this stage.
We then construct a two-segment microring modulator composed of an MSB and an LSB depletion-mode phase shifter, along with a passive waveguide section that completes the ring. Each active segment is modeled using an analytic waveguide with explicit control over , propagation loss, voltage-dependent loss, and RC-limited bandwidth via a first-order time constant. This structure naturally supports independent electrical driving of the MSB and LSB segments, mirroring the optical-DAC concept introduced in the reference work.
After validating the static behavior through frequency-domain S-matrix analysis—capturing resonance positions, extinction, and voltage-dependent wavelength shifts—we move to time-domain simulation. A CW laser is detuned from resonance to operate at the point of maximum slope, electrical PRBS-driven trapezoid waveforms are applied to the modulator ports, and a bandwidth-limited photodiode model converts the optical output into an electrical signal.
Finally, we evaluate large-signal performance by plotting eye diagrams from the detector output, demonstrating how the compact model captures the essential dynamics of high-speed microring modulation. Overall, this notebook serves as a clear, extensible reference implementation for resonant modulator modeling, bridging device physics, circuit abstraction, and system-level signal integrity within a single, efficient simulation framework.
References
- Yuan, Yuan, et al. “A 5× 200 Gbps microring modulator silicon chip empowered by two-segment Z-shape junctions.” Nature Communications, 2024 15 (1), 918, doi: 10.1038/s41467-024-45301-3
import numpy as npimport photonforge as pfimport photonforge.abstract as pfafrom matplotlib import pyplot as plt
import tidy3d as td
td.config.logging.level = "ERROR"
Simulation Parameters
Section titled “Simulation Parameters”In this section, we define the nominal silicon photonic waveguide and microring geometry (all lengths in µm), along with the baseline electro-optic and RF parameters used throughout the notebook.
We parameterize the waveguide cross-section using the core width/height and slab height, then define a nominal microring radius and the coupling-section geometry (coupling length and bus-to-ring gap). Since the coupling region is treated as a straight interaction section, we adjust the effective bend radius so that the combined curved + straight segments match the intended nominal circumference.
We then split the ring’s phase-shifting region into two depletion-mode segments:
- an LSB segment (shorter),
- an MSB segment (longer),
and assign the remaining circumference to an additional passive waveguide segment. Finally, we specify optical loss and modulation figures of merit (e.g., in dB/cm and in V.cm) and the extracted RC-limited bandwidth targets for each segment.
# Geometry details (all units in um)w_core = 0.5h_core = 0.22h_slab = 0.09
# Microring and coupler geometrynominal_radius = 12coupling_length = 4radius = nominal_radius - coupling_length / np.pigap = 0.18
# Two-segment modulator lengths (LSB/MSB) and remaining passive lengthlsb_length = 20msb_length = 40extra_wg_length = 2 * np.pi * nominal_radius - lsb_length - msb_length
# Optical loss model and voltage-dependent loss term (in dB/cm and dB/cm/V)alpha_db_cm = 133dloss_dv_db_cm_v = -3
# Modulation efficiency (V*pi*L in V*cm)msb_vpiL_v_cm = 0.69lsb_vpiL_v_cm = 0.53
# RC-limited bandwidth targets for each segment (Hz)f_rc_msb = 64.0e9f_rc_lsb = 79.1e9
# The optical carrier wavelength (in um) and the corresponding carrier frequencylambda0 = 1.31freq0 = td.C_0 / lambda0
# Coarse frequency grid spanning a narrow O-band window around the carrier.# This grid is used to run the coarse full-wave sweep of the directional coupler.freqs_coarse = pf.C_0 / np.linspace(lambda0 - 0.05, lambda0 + 0.05, 11)
# Define a fine wavelength sweep to resolve the microring resonancelda_fine = np.linspace(1.306, 1.312, 1001)freqs_fine = pf.C_0 / lda_fine
Next, we construct a basic silicon photonics technology object using the previously defined core and slab thicknesses and register it as the default technology. We then define a virtual electrical port (virtual_port_spec) that will be used for both electrical excitation of the modulators and electrical signal readout from the detector and the source.
tech = pf.basic_technology(core_thickness=h_core, slab_thickness=h_slab, rib_width=0.5)pf.config.default_technology = techelec_vir = pf.virtual_port_spec(classification="electrical")opt_vir = pf.virtual_port_spec(classification="optical")Rib Waveguide Mode Analysis
Section titled “Rib Waveguide Mode Analysis”In this section, we solve for the fundamental optical mode of the rib waveguide (which will be used in the microring modulator) and extract its frequency-dependent effective index and group index .
We run the built-in mode solver on the coarse frequency grid freqs_coarse (a narrow band around the carrier wavelength), visualize the electric field profile of the fundamental mode for sanity checking, and wrap the resulting and samples in pf.Interpolator objects.
The AnalyticWaveguideModel and PhaseModTimeStepper used in the rest of the notebook both accept Interpolator inputs for and , so chromatic dispersion is incorporated directly into the compact model: any S-matrix sweep or time-domain run automatically evaluates the indices at the relevant frequency, with no need for a separate dispersion-correction step.
# Solve the rib-waveguide modes across the coarse frequency gridmode_solver = pf.port_modes("Rib", freqs_fine, group_index=True)
# Plot the electric field profile of the solved fundamental mode at the carrier frequencymode_solver.plot_field("E", f=freqs_fine[len(freqs_fine) // 2])
# Extract the frequency-dependent group and effective indices of the fundamental moden_group_vs_f = mode_solver.data.n_group.isel(mode_index=0).valuesn_eff_vs_f = mode_solver.data.n_eff.isel(mode_index=0).values
# Wrap the samples in pf.Interpolator objects so that the analytic waveguide# model and the phase-modulator time stepper natively see n_eff(f) and n_g(f).n_eff = pf.Interpolator(freqs_fine, n_eff_vs_f)n_group = pf.Interpolator(freqs_fine, n_group_vs_f)
Uploading task 'Mode-ModeSolver…'Starting task 'Mode-ModeSolver': https://tidy3d.simulation.cloud/workbench?taskId=mo-5044f2b6-84ae-4519-9aca-01e35692459cDownloading data from 'Mode-ModeSolver'…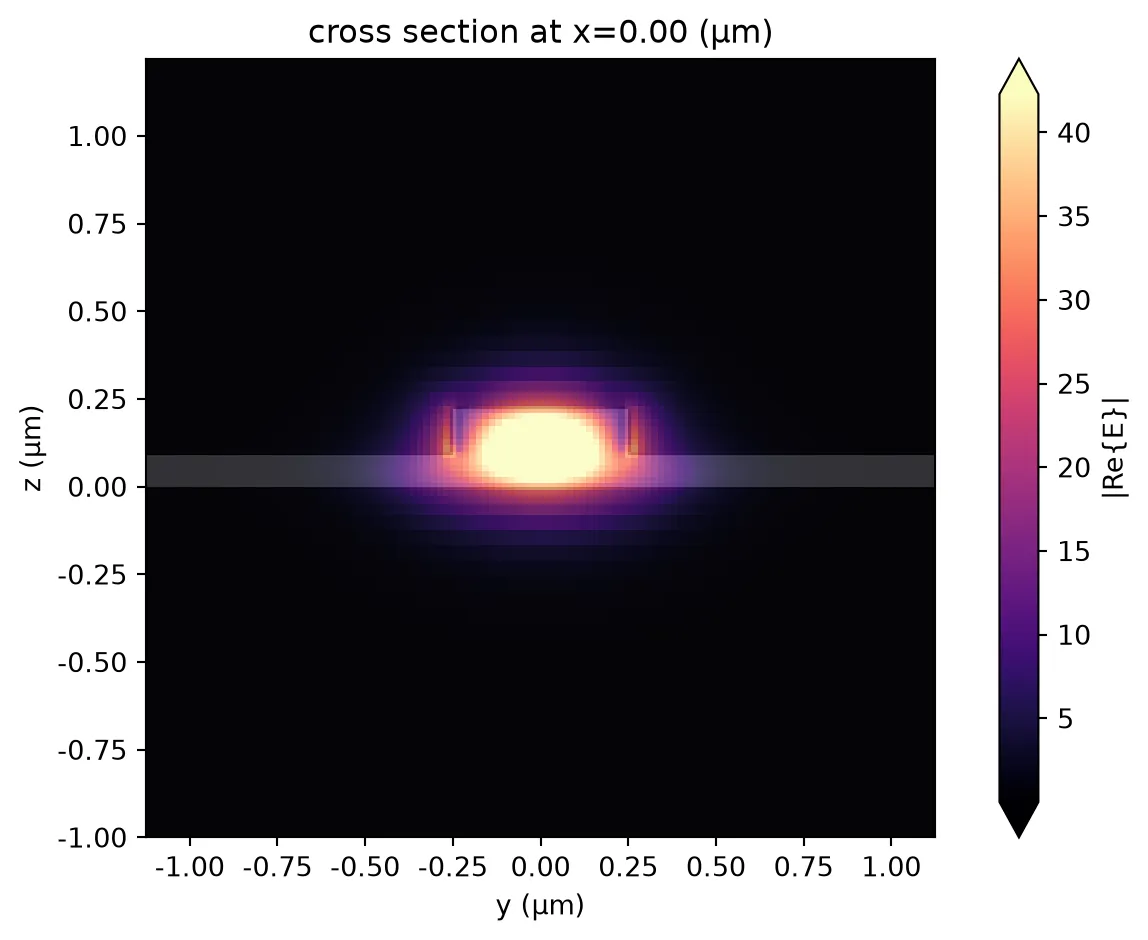
Directional Coupler for Ring–Bus Interaction
Section titled “Directional Coupler for Ring–Bus Interaction”In this section, we construct the directional coupler that mediates optical power exchange between the straight bus waveguide and the microring.
dc = pf.parametric.s_bend_ring_coupler( port_spec="Rib", coupling_distance=gap + w_core, coupling_length=coupling_length, radius=radius, s_bend_length=10, s_bend_offset=2, model=pf.Tidy3DModel(grid_spec=12))dc
After performing a full-wave S-matrix calculation of the directional coupler, we switch to an analytical DirectionalCouplerModel for subsequent simulations.
Why use a compact coupler model? Trade-offs and motivation
Section titled “Why use a compact coupler model? Trade-offs and motivation”What we gain:
- Speed: Full-wave S-matrix calculations are expensive. Replacing them with a compact model lets us evaluate the circuit on a fine frequency grid (e.g., many points over a narrow wavelength range), which is essential to resolve resonances, extinction, and tuning curves accurately. Doing the same sweep with full-wave Tidy3D would require a large number of simulations and become prohibitively slow.
- Controlled physics: In an analytical coupler we discard detailed phase and spatial information from the full-wave solution. That allows us to add propagation loss (e.g., doping-dependent loss) and electro-optic modulation (, voltage-dependent loss, RC bandwidth) in a transparent, explicit way later in the waveguide and modulator models. Those effects are difficult or inconvenient to incorporate directly into a single full-wave coupler run.
- Reuse: One coarse full-wave run gives us coupling () and through () coefficients; the same compact coupler is then reused everywhere in the netlist.
What we give up:
- Spatial and phase detail: The full-wave solution contains exact phase and field distributions. The analytical coupler preserves power coupling (magnitude) but not the full phase response; for resonant circuits we often care more about power coupling and round-trip phase, which we capture via the ring waveguide model.
- Wavelength dependence: We take and at a single (center) frequency. Over a narrow band around the carrier this is usually sufficient; for very wide bands you might need to re-extract or use a frequency-dependent compact model.
Here, we extract and from the center frequency of a coarse sweep and build a lossless analytical coupler that can be reused efficiently across the notebook.
# Compute the full-wave S-matrix of the directional coupler on the coarse grids_matrix = dc.s_matrix(freqs_coarse, model_kwargs={"inputs": ["P0"]})
# Plot the S-matrix magnitude responsesfig, ax = pf.plot_s_matrix(s_matrix)
# Extract coupling and through coefficients at the center frequencykappa = np.abs(s_matrix[("P0@0", "P3@0")][len(freqs_coarse) // 2])trans = np.abs(s_matrix[("P0@0", "P2@0")][len(freqs_coarse) // 2])
# Build an analytical directional coupler model using extracted coefficientsanalytical_dc = pf.DirectionalCouplerModel(t=trans, c=-1j * kappa).black_box_component(    opt_vir)
Uploading task 'P0@0…'Starting task 'P0@0': https://tidy3d.simulation.cloud/workbench?taskId=fdve-97067580-4389-4c3e-b4ac-3219e3082878Downloading data from 'P0@0'…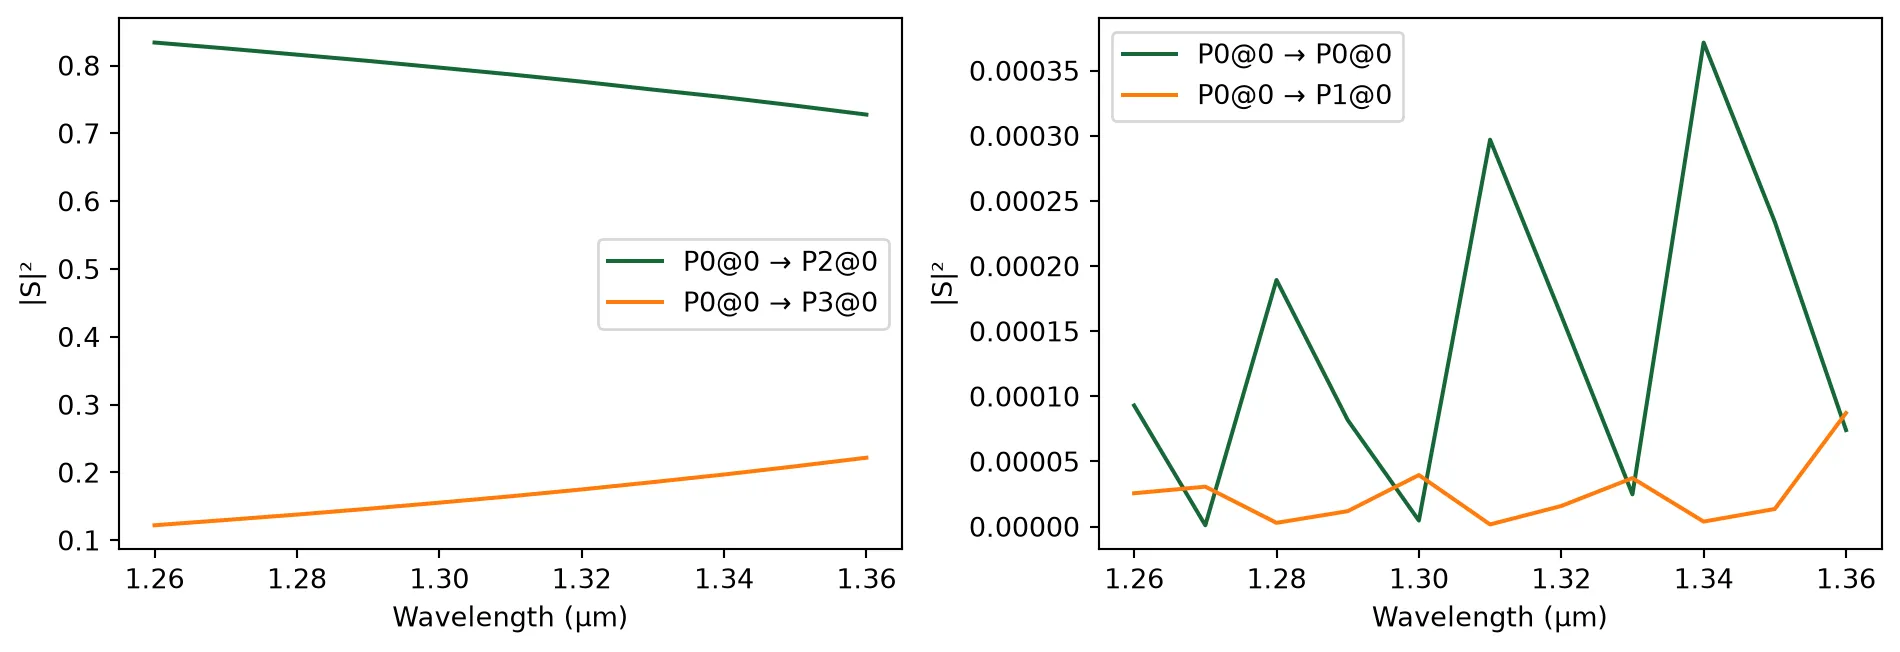
Microring Modulator Assembly
Section titled “Microring Modulator Assembly”Now, we define a parametric waveguide component that serves as the reusable building block for constructing the microring modulator.
We use the same function to represent both:
- passive ring sections (no electrical port, no time-domain modulation), and
- active modulator sections (with a virtual electrical port and an attached phase-modulation time stepper).
The component is built from the AnalyticWaveguideModel parameterized by , , and a reference frequency. For active sections, we include modulation physics through , propagation loss, voltage-dependent loss, and a first-order RC response with a cutoff frequency , via the PhaseModTimeStepper for time-domain simulations.
# Create a reusable parametric waveguide component for passive and active ring sections@pf.parametric_componentdef create_wg(    n_eff=n_eff,    length=2 * np.pi * radius,    n_group=n_group,    reference_frequency=freq0,    v_piL=1e10,    propagation_loss=alpha_db_cm * 1e-4,    dloss_dv=dloss_dv_db_cm_v * 1e-4,    f_rc=1e12,    is_modulator=True,    name="Analytic Waveguide",):    model = pf.AnalyticWaveguideModel(        n_eff=n_eff,        length=length,        n_group=n_group,        reference_frequency=reference_frequency,        v_piL=v_piL,        propagation_loss=propagation_loss,        dloss_dv=dloss_dv,    )    wg = model.black_box_component(port_spec=opt_vir, name=name)    if is_modulator:        wg.add_port(pf.Port(0j, 0, elec_vir))        model.time_stepper = pf.PhaseModTimeStepper(            n_eff=n_eff,            length=length,            n_group=n_group,            v_piL=v_piL,            propagation_loss=propagation_loss,            dloss_dv=dloss_dv,            f_3dB=f_rc,        )
    return wg
create_wg()
Next, we construct the full microring resonator modulator (MRM) by combining:
- the analytical directional coupler (bus-to-ring coupling),
- an MSB active phase-shifter segment,
- an LSB active phase-shifter segment, and
- an extra passive waveguide segment that completes the ring circumference.
We parameterize the active segments independently to allow different , lengths, , and RC-limited bandwidths (). The MSB and LSB sections each expose a virtual electrical port for driving the modulator segments, while the passive section has no electrical interface.
We then define a netlist describing the instances, their virtual optical interconnections around the ring, the external ports (two optical ports on the coupler and two electrical ports for MSB/LSB), and attach a circuit-level model to enable compact system simulation of the full resonant device.
# Build a two-segment microring modulator (MRM) using an analytical coupler and analytic waveguide sections@pf.parametric_componentdef create_mrm(    msb_n_eff=n_eff,    lsb_n_eff=n_eff,    extra_wg_n_eff=n_eff,    n_group=n_group,    msb_length=msb_length,    lsb_length=lsb_length,    extra_wg_length=extra_wg_length,    msb_vpiL=msb_vpiL_v_cm * 1e4,    lsb_vpiL=lsb_vpiL_v_cm * 1e4,    f_rc_msb=f_rc_msb,    f_rc_lsb=f_rc_lsb,    reference_frequency=freq0,):
    msb_wg = create_wg(        n_eff=msb_n_eff,        n_group=n_group,        length=msb_length,        reference_frequency=reference_frequency,        v_piL=msb_vpiL,        f_rc=f_rc_msb,        name="MSB",    )    lsb_wg = create_wg(        n_eff=lsb_n_eff,        n_group=n_group,        length=lsb_length,        reference_frequency=reference_frequency,        v_piL=lsb_vpiL,        f_rc=f_rc_lsb,        name="LSB",    )    extra_wg = create_wg(        n_eff=extra_wg_n_eff,        n_group=n_group,        length=extra_wg_length,        reference_frequency=reference_frequency,        is_modulator=False,    )    # Define the netlist for a microring resonator    netlist_mrm = {        "name": "Microring Modulator",  # name of the component        "instances": {            "dc": analytical_dc,            "msb": {"component": msb_wg, "origin": (0, 5), "rotation": 90},            "lsb": {"component": lsb_wg, "origin": (20, 45), "rotation": -90},            "extra": {"component": extra_wg, "origin": (20, 5), "rotation": 90},        },        "virtual connections": [            (("msb", "P0"), ("dc", "P1")),            (("msb", "P1"), ("lsb", "P0")),            (("lsb", "P1"), ("extra", "P1")),            (("extra", "P0"), ("dc", "P3")),        ],        # Define external ports        "ports": [("dc", "P0"), ("dc", "P2"), ("msb", "E0"), ("lsb", "E0")],        # Assign a CircuitModel to simulate the entire microring        "models": [(pf.CircuitModel(), "Circuit")],    }
    # Build the microring resonator from the netlist    mrm = pf.component_from_netlist(netlist_mrm)
    return mrm
create_mrm();fill:%23221f20;font-weight:bold;font-size:1.980000px;}.terminal{fill:none;stroke:%23805080;stroke-width:0.247500;}.dashed{stroke-dasharray:1.237500,0.742500;}.port{fill:none;stroke:%23805080;stroke-width:0.495000;}.virtual-connection{fill:none;stroke:%23907090;stroke-width:0.371250;}.layer_5_0{stroke:%23998573;fill:url(%23pat-layer_5_0);fill-opacity:0.492;}.label_5_0{fill:%23998573;}.layer_3_0{stroke:%238851ad;fill:url(%23pat-layer_3_0);fill-opacity:0.492;}.label_3_0{fill:%238851ad;}.layer_4_0{stroke:%23535e59;fill:url(%23pat-layer_4_0);fill-opacity:0.492;}.label_4_0{fill:%23535e59;}.layer_1_0{stroke:%23858d89;fill:url(%23pat-layer_1_0);fill-opacity:0.492;}.label_1_0{fill:%23858d89;}.layer_2_0{stroke:%235b98b9;fill:url(%23pat-layer_2_0);fill-opacity:0.492;}.label_2_0{fill:%235b98b9;}</style><defs><path id=%22port-symbol%22 class=%22port%22 d=%22M 0,-0.990000 L 1.485000,0 0,0.990000%22 /><path id=%22ref-port-symbol%22 class=%22port%22 style=%22stroke-opacity:0.33;%22 d=%22M 0,-0.742500 C 0.990000,-0.742500 0.990000,0.742500 0,0.742500%22 /><circle id=%22port-bend-symbol%22 style=%22stroke-width:0;stroke:none;fill:%23805080;fill-opacity:1;%22 cx=%220%22 cy=%220%22 r=%220.445500%22 /><circle id=%22connection-symbol%22 style=%22stroke-width:0;stroke:none;fill:%23907090;fill-opacity:1;%22 cx=%220%22 cy=%220%22 r=%220.519750%22 /><pattern id=%22pat-layer_5_0%22 patternUnits=%22userSpaceOnUse%22 width=%221.237500%22 height=%221.237500%22 patternTransform=%22translate(0.072794,1.107237)%22><line x1=%221.237500%22 y1=%220%22 x2=%220%22 y2=%221.237500%22 style=%22stroke:%23998573;stroke-width:0.123750%22 /><line x1=%221.856250%22 y1=%220.618750%22 x2=%220.618750%22 y2=%221.856250%22 style=%22stroke:%23998573;stroke-width:0.123750%22 /><line x1=%220.618750%22 y1=%22-0.618750%22 x2=%22-0.618750%22 y2=%220.618750%22 style=%22stroke:%23998573;stroke-width:0.123750%22 /></pattern><pattern id=%22pat-layer_3_0%22 patternUnits=%22userSpaceOnUse%22 width=%220.742500%22 height=%220.742500%22 patternTransform=%22translate(0.174706,0.547105)%22><circle cx=%220.371250%22 cy=%220.371250%22 r=%220.123750%22 style=%22stroke:none;fill:%238851ad;fill-opacity:1.0%22 /></pattern><pattern id=%22pat-layer_4_0%22 patternUnits=%22userSpaceOnUse%22 width=%221.237500%22 height=%221.237500%22 patternTransform=%22translate(0.800735,0.390789)%22><line x1=%220.618750%22 y1=%220%22 x2=%220.618750%22 y2=%221.237500%22 style=%22stroke:%23535e59;stroke-width:0.123750%22 /><line x1=%220%22 y1=%220.618750%22 x2=%221.237500%22 y2=%220.618750%22 style=%22stroke:%23535e59;stroke-width:0.123750%22 /></pattern><pattern id=%22pat-layer_1_0%22 patternUnits=%22userSpaceOnUse%22 width=%221.237500%22 height=%221.237500%22 patternTransform=%22translate(0.509559,0.716447)%22><circle cx=%220.618750%22 cy=%220.618750%22 r=%220.123750%22 style=%22stroke:none;fill:%23858d89;fill-opacity:1.0%22 /></pattern><pattern id=%22pat-layer_2_0%22 patternUnits=%22userSpaceOnUse%22 width=%221.237500%22 height=%221.237500%22 patternTransform=%22translate(1.019118,0.195395)%22><line x1=%220%22 y1=%220%22 x2=%221.237500%22 y2=%221.237500%22 style=%22stroke:%235b98b9;stroke-width:0.123750%22 /><line x1=%22-0.618750%22 y1=%220.618750%22 x2=%220.618750%22 y2=%221.856250%22 style=%22stroke:%235b98b9;stroke-width:0.123750%22 /><line x1=%220.618750%22 y1=%22-0.618750%22 x2=%221.856250%22 y2=%220.618750%22 style=%22stroke:%235b98b9;stroke-width:0.123750%22 /></pattern><g id=%22C1%22 data-name=%22BBDirectionalCoupler%22><path class=%22layer_0_32767%22 d=%22M 0.000000,9.600000 0.000000,7.715000 0.000000,7.465000 0.000000,4.935000 0.000000,4.685000 0.000000,0.000000 11.120000,0.000000 11.120000,4.685000 11.120000,4.935000 11.120000,7.465000 11.120000,7.715000 11.120000,9.600000 z M 11.000000,7.715000 9.520000,7.715000 9.520000,8.000000 6.820000,8.000000 6.180000,7.350000 4.980000,7.350000 4.320000,8.000000 1.620000,8.000000 1.620000,7.715000 0.120000,7.715000 0.120000,9.480000 11.000000,9.480000 z M 11.000000,4.935000 9.520000,4.935000 9.520000,5.220000 7.180000,5.220000 6.520000,5.880000 4.620000,5.880000 3.980000,5.220000 1.600000,5.220000 1.600000,4.935000 0.120000,4.935000 0.120000,7.465000 1.620000,7.465000 1.620000,7.180000 3.980000,7.180000 4.620000,6.520000 6.520000,6.520000 7.180000,7.180000 9.520000,7.180000 9.520000,7.465000 11.000000,7.465000 z M 11.000000,0.120000 0.120000,0.120000 0.120000,4.685000 1.600000,4.685000 1.600000,4.420000 1.620000,4.400000 4.320000,4.400000 5.000000,5.080000 6.150000,5.080000 6.820000,4.400000 9.520000,4.400000 9.520000,4.685000 11.000000,4.685000 z%22 /><path class=%22layer_0_32767%22 d=%22M 1.612000,2.205000 1.132000,2.205000 1.132000,1.165000 1.612000,1.165000 1.812000,1.365000 1.812000,2.005000 z M 1.652000,1.445000 1.532000,1.325000 1.292000,1.325000 1.292000,2.045000 1.532000,2.045000 1.652000,1.925000 z%22 /><path class=%22layer_0_32767%22 d=%22M 2.036000,1.725000 2.036000,1.165000 2.196000,1.165000 2.196000,1.725000 z%22 /><path class=%22layer_0_32767%22 d=%22M 2.036000,2.045000 2.036000,1.885000 2.196000,1.885000 2.196000,2.045000 z%22 /><path class=%22layer_0_32767%22 d=%22M 3.060000,1.645000 3.060000,1.746000 2.921000,1.885000 2.641000,1.885000 2.580000,1.826000 2.521000,1.885000 2.420000,1.885000 2.420000,1.165000 2.580000,1.165000 2.580000,1.645000 2.660000,1.725000 2.820000,1.725000 2.900000,1.645000 z%22 /><path class=%22layer_0_32767%22 d=%22M 3.284000,1.325000 3.284000,1.165000 3.444000,1.165000 3.444000,1.325000 z%22 /><path class=%22layer_0_32767%22 d=%22M 5.204000,1.426000 5.065000,1.426000 4.964000,1.325000 4.804000,1.325000 4.724000,1.405000 4.724000,1.645000 4.804000,1.725000 4.964000,1.725000 5.065000,1.626000 5.204000,1.626000 5.204000,1.706000 5.025000,1.885000 4.745000,1.885000 4.564000,1.706000 4.564000,1.346000 4.745000,1.165000 5.025000,1.165000 5.204000,1.346000 z%22 /><path class=%22layer_0_32767%22 d=%22M 5.889000,1.885000 5.609000,1.885000 5.428000,1.706000 5.428000,1.346000 5.609000,1.165000 5.889000,1.165000 6.068000,1.346000 6.068000,1.706000 z M 5.908000,1.405000 5.828000,1.325000 5.668000,1.325000 5.588000,1.405000 5.588000,1.645000 5.668000,1.725000 5.828000,1.725000 5.908000,1.645000 z%22 /><path class=%22layer_0_32767%22 d=%22M 6.852000,1.165000 6.852000,1.885000 6.692000,1.885000 6.692000,1.405000 6.612000,1.325000 6.532000,1.325000 6.452000,1.405000 6.452000,1.885000 6.292000,1.885000 6.292000,1.346000 6.473000,1.165000 6.633000,1.165000 6.692000,1.226000 6.753000,1.165000 z%22 /><path class=%22layer_0_32767%22 d=%22M 7.537000,1.885000 7.076000,1.885000 7.076000,0.845000 7.236000,0.845000 7.236000,1.165000 7.537000,1.165000 7.716000,1.346000 7.716000,1.706000 z M 7.556000,1.405000 7.476000,1.325000 7.236000,1.325000 7.236000,1.725000 7.476000,1.725000 7.556000,1.645000 z%22 /><path class=%22layer_0_32767%22 d=%22M 8.260000,1.325000 8.100000,1.325000 8.100000,2.205000 7.940000,2.205000 7.940000,1.285000 8.060000,1.165000 8.260000,1.165000 z%22 /><path class=%22layer_0_32767%22 d=%22M 9.004000,1.885000 8.604000,1.885000 8.484000,1.765000 8.484000,1.285000 8.604000,1.165000 9.084000,1.165000 9.084000,1.325000 8.644000,1.325000 8.644000,1.445000 9.004000,1.445000 9.124000,1.565000 9.124000,1.765000 z M 8.964000,1.605000 8.644000,1.605000 8.644000,1.725000 8.964000,1.725000 z%22 /><path class=%22layer_0_32767%22 d=%22M 9.988000,1.645000 9.988000,1.746000 9.849000,1.885000 9.569000,1.885000 9.508000,1.826000 9.449000,1.885000 9.348000,1.885000 9.348000,1.165000 9.508000,1.165000 9.508000,1.645000 9.588000,1.725000 9.748000,1.725000 9.828000,1.645000 z%22 /></g><g id=%22C2%22 data-name=%22MSB%22><path class=%22layer_0_32767%22 d=%22M 0.000000,10.180000 0.000000,6.645000 0.000000,6.395000 0.000000,0.000000 40.000000,0.000000 40.000000,6.395000 40.000000,6.645000 40.000000,10.180000 z M 39.880000,6.645000 38.400000,6.645000 38.400000,7.180000 25.633000,7.180000 25.525000,7.200000 25.633000,7.400000 38.400000,7.400000 38.400000,8.580000 1.600000,8.580000 1.600000,7.400000 24.452000,7.400000 24.560000,7.380000 24.452000,7.180000 1.600000,7.180000 1.600000,6.645000 0.120000,6.645000 0.120000,10.060000 39.880000,10.060000 z M 25.901000,6.230000 25.633000,6.180000 25.096000,6.280000 24.560000,6.180000 24.292000,6.230000 24.292000,6.800000 24.560000,6.860000 25.096000,6.760000 25.633000,6.860000 25.901000,6.800000 z M 15.708000,8.280000 15.440000,8.230000 14.367000,8.230000 14.099000,8.280000 14.099000,8.430000 14.367000,8.480000 14.904000,8.380000 15.440000,8.480000 15.708000,8.430000 z M 25.901000,7.560000 25.633000,7.500000 25.096000,7.600000 24.560000,7.500000 24.292000,7.560000 24.292000,8.430000 24.560000,8.480000 25.096000,8.380000 25.633000,8.480000 25.901000,8.430000 z M 39.880000,0.120000 0.120000,0.120000 0.120000,6.395000 1.600000,6.395000 1.600000,5.860000 24.452000,5.860000 24.560000,5.830000 24.452000,5.630000 1.600000,5.630000 1.600000,4.400000 38.400000,4.400000 38.400000,5.630000 25.633000,5.630000 25.525000,5.660000 25.633000,5.860000 38.400000,5.860000 38.400000,6.395000 39.880000,6.395000 z M 25.901000,5.230000 25.633000,5.180000 24.560000,5.180000 24.292000,5.230000 24.292000,5.480000 24.560000,5.530000 25.096000,5.430000 25.633000,5.530000 25.901000,5.480000 z%22 /><path class=%22layer_0_32767%22 d=%22M 16.437000,2.045000 15.896000,2.045000 15.896000,1.005000 16.056000,1.005000 16.056000,1.405000 16.437000,1.405000 16.616000,1.586000 16.616000,1.866000 z M 16.456000,1.645000 16.376000,1.565000 16.056000,1.565000 16.056000,1.885000 16.376000,1.885000 16.456000,1.805000 z%22 /><path class=%22layer_0_32767%22 d=%22M 17.480000,1.005000 17.480000,1.426000 17.301000,1.605000 17.000000,1.605000 17.000000,2.045000 16.840000,2.045000 16.840000,1.005000 17.000000,1.005000 17.000000,1.445000 17.240000,1.445000 17.320000,1.365000 17.320000,1.005000 z%22 /><path class=%22layer_0_32767%22 d=%22M 18.264000,1.725000 17.784000,1.725000 17.704000,1.645000 17.704000,1.565000 18.184000,1.565000 18.184000,1.445000 17.824000,1.445000 17.704000,1.325000 17.704000,1.125000 17.824000,1.005000 18.344000,1.005000 18.344000,1.645000 z M 18.184000,1.165000 17.864000,1.165000 17.864000,1.285000 18.184000,1.285000 z%22 /><path class=%22layer_0_32767%22 d=%22M 18.648000,1.005000 19.088000,1.005000 19.208000,1.125000 19.208000,1.325000 19.088000,1.445000 18.728000,1.445000 18.728000,1.565000 19.208000,1.565000 19.208000,1.645000 19.128000,1.725000 18.648000,1.725000 18.568000,1.645000 18.568000,1.405000 18.688000,1.285000 19.048000,1.285000 19.048000,1.165000 18.568000,1.165000 18.568000,1.085000 z%22 /><path class=%22layer_0_32767%22 d=%22M 19.952000,1.725000 19.552000,1.725000 19.432000,1.605000 19.432000,1.125000 19.552000,1.005000 20.032000,1.005000 20.032000,1.165000 19.592000,1.165000 19.592000,1.285000 19.952000,1.285000 20.072000,1.405000 20.072000,1.605000 z M 19.912000,1.445000 19.592000,1.445000 19.592000,1.565000 19.912000,1.565000 z%22 /><path class=%22layer_0_32767%22 d=%22M 21.192000,1.725000 21.192000,1.005000 21.352000,1.005000 21.352000,1.485000 21.432000,1.565000 21.512000,1.485000 21.512000,1.005000 21.672000,1.005000 21.672000,1.485000 21.752000,1.565000 21.832000,1.485000 21.832000,1.005000 21.992000,1.005000 21.992000,1.546000 21.813000,1.725000 21.693000,1.725000 21.592000,1.626000 21.493000,1.725000 z%22 /><path class=%22layer_0_32767%22 d=%22M 22.677000,1.725000 22.397000,1.725000 22.216000,1.546000 22.216000,1.186000 22.397000,1.005000 22.677000,1.005000 22.856000,1.186000 22.856000,1.546000 z M 22.696000,1.245000 22.616000,1.165000 22.456000,1.165000 22.376000,1.245000 22.376000,1.485000 22.456000,1.565000 22.616000,1.565000 22.696000,1.485000 z%22 /><path class=%22layer_0_32767%22 d=%22M 23.560000,2.045000 23.560000,1.685000 23.261000,1.685000 23.080000,1.506000 23.080000,1.186000 23.261000,1.005000 23.720000,1.005000 23.720000,2.045000 z M 23.560000,1.165000 23.320000,1.165000 23.240000,1.245000 23.240000,1.445000 23.320000,1.525000 23.560000,1.525000 z%22 /><path class=%22layer_0_32767%22 d=%22M 23.944000,1.165000 23.944000,1.005000 24.104000,1.005000 24.104000,1.165000 z%22 /></g><g id=%22C3%22 data-name=%22LSB%22><path class=%22layer_0_32767%22 d=%22M 0.000000,10.180000 0.000000,6.645000 0.000000,6.395000 0.000000,0.000000 20.000000,0.000000 20.000000,6.395000 20.000000,6.645000 20.000000,10.180000 z M 19.880000,6.645000 18.400000,6.645000 18.400000,7.180000 12.571000,7.180000 12.522000,7.200000 12.571000,7.400000 18.400000,7.400000 18.400000,8.580000 1.600000,8.580000 1.600000,7.400000 12.033000,7.400000 12.082000,7.380000 12.033000,7.180000 1.600000,7.180000 1.600000,6.645000 0.120000,6.645000 0.120000,10.060000 19.880000,10.060000 z M 12.694000,6.230000 12.571000,6.180000 12.327000,6.280000 12.082000,6.180000 11.959000,6.230000 11.959000,6.800000 12.082000,6.860000 12.327000,6.760000 12.571000,6.860000 12.694000,6.800000 z M 8.041000,8.280000 7.918000,8.230000 7.429000,8.230000 7.306000,8.280000 7.306000,8.430000 7.429000,8.480000 7.673000,8.380000 7.918000,8.480000 8.041000,8.430000 z M 12.694000,7.560000 12.571000,7.500000 12.327000,7.600000 12.082000,7.500000 11.959000,7.560000 11.959000,8.430000 12.082000,8.480000 12.327000,8.380000 12.571000,8.480000 12.694000,8.430000 z M 19.880000,0.120000 0.120000,0.120000 0.120000,6.395000 1.600000,6.395000 1.600000,5.860000 12.033000,5.860000 12.082000,5.830000 12.033000,5.630000 1.600000,5.630000 1.600000,4.400000 18.400000,4.400000 18.400000,5.630000 12.571000,5.630000 12.522000,5.660000 12.571000,5.860000 18.400000,5.860000 18.400000,6.395000 19.880000,6.395000 z M 12.694000,5.230000 12.571000,5.180000 12.082000,5.180000 11.959000,5.230000 11.959000,5.480000 12.082000,5.530000 12.327000,5.430000 12.571000,5.530000 12.694000,5.480000 z%22 /><path class=%22layer_0_32767%22 d=%22M 6.437000,2.045000 5.896000,2.045000 5.896000,1.005000 6.056000,1.005000 6.056000,1.405000 6.437000,1.405000 6.616000,1.586000 6.616000,1.866000 z M 6.456000,1.645000 6.376000,1.565000 6.056000,1.565000 6.056000,1.885000 6.376000,1.885000 6.456000,1.805000 z%22 /><path class=%22layer_0_32767%22 d=%22M 7.480000,1.005000 7.480000,1.426000 7.301000,1.605000 7.000000,1.605000 7.000000,2.045000 6.840000,2.045000 6.840000,1.005000 7.000000,1.005000 7.000000,1.445000 7.240000,1.445000 7.320000,1.365000 7.320000,1.005000 z%22 /><path class=%22layer_0_32767%22 d=%22M 8.264000,1.725000 7.784000,1.725000 7.704000,1.645000 7.704000,1.565000 8.184000,1.565000 8.184000,1.445000 7.824000,1.445000 7.704000,1.325000 7.704000,1.125000 7.824000,1.005000 8.344000,1.005000 8.344000,1.645000 z M 8.184000,1.165000 7.864000,1.165000 7.864000,1.285000 8.184000,1.285000 z%22 /><path class=%22layer_0_32767%22 d=%22M 8.648000,1.005000 9.088000,1.005000 9.208000,1.125000 9.208000,1.325000 9.088000,1.445000 8.728000,1.445000 8.728000,1.565000 9.208000,1.565000 9.208000,1.645000 9.128000,1.725000 8.648000,1.725000 8.568000,1.645000 8.568000,1.405000 8.688000,1.285000 9.048000,1.285000 9.048000,1.165000 8.568000,1.165000 8.568000,1.085000 z%22 /><path class=%22layer_0_32767%22 d=%22M 9.952000,1.725000 9.552000,1.725000 9.432000,1.605000 9.432000,1.125000 9.552000,1.005000 10.032000,1.005000 10.032000,1.165000 9.592000,1.165000 9.592000,1.285000 9.952000,1.285000 10.072000,1.405000 10.072000,1.605000 z M 9.912000,1.445000 9.592000,1.445000 9.592000,1.565000 9.912000,1.565000 z%22 /><path class=%22layer_0_32767%22 d=%22M 11.192000,1.725000 11.192000,1.005000 11.352000,1.005000 11.352000,1.485000 11.432000,1.565000 11.512000,1.485000 11.512000,1.005000 11.672000,1.005000 11.672000,1.485000 11.752000,1.565000 11.832000,1.485000 11.832000,1.005000 11.992000,1.005000 11.992000,1.546000 11.813000,1.725000 11.693000,1.725000 11.592000,1.626000 11.493000,1.725000 z%22 /><path class=%22layer_0_32767%22 d=%22M 12.677000,1.725000 12.397000,1.725000 12.216000,1.546000 12.216000,1.186000 12.397000,1.005000 12.677000,1.005000 12.856000,1.186000 12.856000,1.546000 z M 12.696000,1.245000 12.616000,1.165000 12.456000,1.165000 12.376000,1.245000 12.376000,1.485000 12.456000,1.565000 12.616000,1.565000 12.696000,1.485000 z%22 /><path class=%22layer_0_32767%22 d=%22M 13.560000,2.045000 13.560000,1.685000 13.261000,1.685000 13.080000,1.506000 13.080000,1.186000 13.261000,1.005000 13.720000,1.005000 13.720000,2.045000 z M 13.560000,1.165000 13.320000,1.165000 13.240000,1.245000 13.240000,1.445000 13.320000,1.525000 13.560000,1.525000 z%22 /><path class=%22layer_0_32767%22 d=%22M 13.944000,1.165000 13.944000,1.005000 14.104000,1.005000 14.104000,1.165000 z%22 /></g><g id=%22C4%22 data-name=%22Analytic Waveguide%22><path class=%22layer_0_32767%22 d=%22M 0.000000,10.180000 0.000000,6.645000 0.000000,6.395000 0.000000,0.000000 15.398000,0.000000 15.398000,6.395000 15.398000,6.645000 15.398000,10.180000 z M 15.278000,6.645000 13.799000,6.645000 13.799000,7.180000 9.567000,7.180000 9.532000,7.200000 9.567000,7.400000 13.799000,7.400000 13.799000,8.580000 1.601000,8.580000 1.601000,7.400000 9.176000,7.400000 9.211000,7.380000 9.176000,7.180000 1.601000,7.180000 1.601000,6.645000 0.120000,6.645000 0.120000,10.060000 15.278000,10.060000 z M 9.656000,6.230000 9.567000,6.180000 9.389000,6.280000 9.211000,6.180000 9.123000,6.230000 9.123000,6.800000 9.211000,6.860000 9.389000,6.760000 9.567000,6.860000 9.656000,6.800000 z M 6.277000,8.280000 6.189000,8.230000 5.833000,8.230000 5.744000,8.280000 5.744000,8.430000 5.833000,8.480000 6.011000,8.380000 6.189000,8.480000 6.277000,8.430000 z M 9.656000,7.560000 9.567000,7.500000 9.389000,7.600000 9.211000,7.500000 9.123000,7.560000 9.123000,8.430000 9.211000,8.480000 9.389000,8.380000 9.567000,8.480000 9.656000,8.430000 z M 15.278000,0.120000 0.120000,0.120000 0.120000,6.395000 1.601000,6.395000 1.601000,5.860000 9.176000,5.860000 9.211000,5.830000 9.176000,5.630000 1.601000,5.630000 1.601000,4.400000 13.799000,4.400000 13.799000,5.630000 9.567000,5.630000 9.532000,5.660000 9.567000,5.860000 13.799000,5.860000 13.799000,6.395000 15.278000,6.395000 z M 9.656000,5.230000 9.567000,5.180000 9.211000,5.180000 9.123000,5.230000 9.123000,5.480000 9.211000,5.530000 9.389000,5.430000 9.567000,5.530000 9.656000,5.480000 z%22 /><path class=%22layer_0_32767%22 d=%22M 4.137000,2.045000 3.596000,2.045000 3.596000,1.005000 3.756000,1.005000 3.756000,1.405000 4.137000,1.405000 4.316000,1.586000 4.316000,1.866000 z M 4.156000,1.645000 4.076000,1.565000 3.756000,1.565000 3.756000,1.885000 4.076000,1.885000 4.156000,1.805000 z%22 /><path class=%22layer_0_32767%22 d=%22M 5.180000,1.005000 5.180000,1.426000 5.001000,1.605000 4.700000,1.605000 4.700000,2.045000 4.540000,2.045000 4.540000,1.005000 4.700000,1.005000 4.700000,1.445000 4.940000,1.445000 5.020000,1.365000 5.020000,1.005000 z%22 /><path class=%22layer_0_32767%22 d=%22M 5.964000,1.725000 5.484000,1.725000 5.404000,1.645000 5.404000,1.565000 5.884000,1.565000 5.884000,1.445000 5.524000,1.445000 5.404000,1.325000 5.404000,1.125000 5.524000,1.005000 6.044000,1.005000 6.044000,1.645000 z M 5.884000,1.165000 5.564000,1.165000 5.564000,1.285000 5.884000,1.285000 z%22 /><path class=%22layer_0_32767%22 d=%22M 6.348000,1.005000 6.788000,1.005000 6.908000,1.125000 6.908000,1.325000 6.788000,1.445000 6.428000,1.445000 6.428000,1.565000 6.908000,1.565000 6.908000,1.645000 6.828000,1.725000 6.348000,1.725000 6.268000,1.645000 6.268000,1.405000 6.388000,1.285000 6.748000,1.285000 6.748000,1.165000 6.268000,1.165000 6.268000,1.085000 z%22 /><path class=%22layer_0_32767%22 d=%22M 7.652000,1.725000 7.252000,1.725000 7.132000,1.605000 7.132000,1.125000 7.252000,1.005000 7.732000,1.005000 7.732000,1.165000 7.292000,1.165000 7.292000,1.285000 7.652000,1.285000 7.772000,1.405000 7.772000,1.605000 z M 7.612000,1.445000 7.292000,1.445000 7.292000,1.565000 7.612000,1.565000 z%22 /><path class=%22layer_0_32767%22 d=%22M 8.892000,1.725000 8.892000,1.005000 9.052000,1.005000 9.052000,1.485000 9.132000,1.565000 9.212000,1.485000 9.212000,1.005000 9.372000,1.005000 9.372000,1.485000 9.452000,1.565000 9.532000,1.485000 9.532000,1.005000 9.692000,1.005000 9.692000,1.546000 9.513000,1.725000 9.393000,1.725000 9.292000,1.626000 9.193000,1.725000 z%22 /><path class=%22layer_0_32767%22 d=%22M 10.377000,1.725000 10.097000,1.725000 9.916000,1.546000 9.916000,1.186000 10.097000,1.005000 10.377000,1.005000 10.556000,1.186000 10.556000,1.546000 z M 10.396000,1.245000 10.316000,1.165000 10.156000,1.165000 10.076000,1.245000 10.076000,1.485000 10.156000,1.565000 10.316000,1.565000 10.396000,1.485000 z%22 /><path class=%22layer_0_32767%22 d=%22M 11.260000,2.045000 11.260000,1.685000 10.961000,1.685000 10.780000,1.506000 10.780000,1.186000 10.961000,1.005000 11.420000,1.005000 11.420000,2.045000 z M 11.260000,1.165000 11.020000,1.165000 10.940000,1.245000 10.940000,1.445000 11.020000,1.525000 11.260000,1.525000 z%22 /><path class=%22layer_0_32767%22 d=%22M 11.644000,1.165000 11.644000,1.005000 11.804000,1.005000 11.804000,1.165000 z%22 /></g></defs><g transform=%22scale(1 -1)%22><g id=%22C0%22 data-name=%22Microring Modulator%22><use transform=%22translate(0.000000 0.000000)%22 href=%22%23C1%22 /><use transform=%22translate(0.000000 5.000000) rotate(90.000000)%22 href=%22%23C2%22 /><use transform=%22translate(20.000000 45.000000) rotate(-90.000000)%22 href=%22%23C3%22 /><use transform=%22translate(20.000000 5.000000) rotate(90.000000)%22 href=%22%23C4%22 /><g transform=%22translate(0.000000 5.000000) rotate(90.000000)%22><path class=%22port%22 d=%22M 0,-0.500000 V 0.500000%22 /><use href=%22%23port-symbol%22 /></g><text class=%22label%22 text-anchor=%22end%22 dominant-baseline=%22text-after-edge%22 x=%220.000000%22 y=%22-5.000000%22>E0</text><g transform=%22translate(20.000000 45.000000) rotate(-90.000000)%22><path class=%22port%22 d=%22M 0,-0.500000 V 0.500000%22 /><use href=%22%23port-symbol%22 /></g><text class=%22label%22 text-anchor=%22end%22 dominant-baseline=%22text-before-edge%22 x=%2220.000000%22 y=%22-45.000000%22>E1</text><g transform=%22translate(0.000000 4.810000) rotate(0.000000)%22><path class=%22port%22 d=%22M 0,-0.500000 V 0.500000%22 /><use href=%22%23port-symbol%22 /></g><text class=%22label%22 text-anchor=%22start%22 dominant-baseline=%22text-after-edge%22 x=%220.000000%22 y=%22-4.810000%22>P0</text><g transform=%22translate(11.120000 4.810000) rotate(180.000000)%22><path class=%22port%22 d=%22M 0,-0.500000 V 0.500000%22 /><use href=%22%23port-symbol%22 /></g><text class=%22label%22 text-anchor=%22end%22 dominant-baseline=%22text-before-edge%22 x=%2211.120000%22 y=%22-4.810000%22>P1</text><g transform=%22translate(-6.520000 5.000000)%22><use href=%22%23connection-symbol%22 /></g><g transform=%22translate(0.000000 7.590000)%22><use href=%22%23connection-symbol%22 /></g><path class=%22virtual-connection%22 d=%22M -6.520000,5.000000 C -6.520000,3.830735 -1.169265,7.590000 0.000000,7.590000%22 /><g transform=%22translate(-6.520000 45.000000)%22><use href=%22%23connection-symbol%22 /></g><g transform=%22translate(26.520000 45.000000)%22><use href=%22%23connection-symbol%22 /></g><path class=%22virtual-connection%22 d=%22M -6.520000,45.000000 C -6.520000,50.506667 26.520000,50.506667 26.520000,45.000000%22 /><g transform=%22translate(26.520000 25.000000)%22><use href=%22%23connection-symbol%22 /></g><g transform=%22translate(13.480000 20.398000)%22><use href=%22%23connection-symbol%22 /></g><path class=%22virtual-connection%22 d=%22M 26.520000,25.000000 C 26.520000,22.695295 13.480000,22.702705 13.480000,20.398000%22 /><g transform=%22translate(13.480000 5.000000)%22><use href=%22%23connection-symbol%22 /></g><g transform=%22translate(11.120000 7.590000)%22><use href=%22%23connection-symbol%22 /></g><path class=%22virtual-connection%22 d=%22M 13.480000,5.000000 C 13.480000,4.416008 11.703992,7.590000 11.120000,7.590000%22 /></g></g></svg>)
%22><use href=%22%23g-dc%22 transform=%22translate(-30.00 -30.00) scale(1.2)%22/><circle cx=%22-30.00%22 cy=%22-6.54%22 r=%224%22 fill=%22%2300643c%22 stroke=%22%2300643c%22 stroke-width=%221%22/><circle cx=%22-30.00%22 cy=%2210.05%22 r=%224%22 fill=%22%2300643c%22 stroke=%22%2300643c%22 stroke-width=%221%22/><circle cx=%2230.00%22 cy=%22-6.51%22 r=%224%22 fill=%22%2300643c%22 stroke=%22%2300643c%22 stroke-width=%221%22/><circle cx=%2230.00%22 cy=%2210.17%22 r=%224%22 fill=%22%2300643c%22 stroke=%22%2300643c%22 stroke-width=%221%22/></g><text x=%22192.00%22 y=%2291.80%22 font-size=%229%22 fill=%22%23232530%22 font-weight=%22400%22 text-anchor=%22middle%22 dominant-baseline=%22hanging%22 stroke=%22%23ffffff%22 stroke-width=%223.15%22 stroke-linejoin=%22round%22 paint-order=%22stroke%22>BBDirectionalCoupler_1</text><text x=%22150.00%22 y=%2270.05%22 font-size=%2210%22 fill=%22%23b8461c%22 font-weight=%22700%22 text-anchor=%22end%22 dominant-baseline=%22middle%22 stroke=%22%23ffffff%22 stroke-width=%223.50%22 stroke-linejoin=%22round%22 paint-order=%22stroke%22>P0</text><text x=%22234.00%22 y=%2270.17%22 font-size=%2210%22 fill=%22%23b8461c%22 font-weight=%22700%22 text-anchor=%22start%22 dominant-baseline=%22middle%22 stroke=%22%23ffffff%22 stroke-width=%223.50%22 stroke-linejoin=%22round%22 paint-order=%22stroke%22>P1</text><g transform=%22matrix(6.12323e-17 -1 1 6.12323e-17 0.000 60.000)%22><rect x=%22-30.00%22 y=%22-30.00%22 width=%2260.00%22 height=%2260.00%22 fill=%22%23f4f5f7%22 stroke=%22%23232530%22 stroke-width=%221%22/><use href=%22%23g-eo_ps%22 transform=%22translate(-30.00 -30.00) scale(1.2)%22/><circle cx=%22-30.00%22 cy=%22-15.00%22 r=%224%22 fill=%22%2300643c%22 stroke=%22%2300643c%22 stroke-width=%221%22/><circle cx=%22-30.00%22 cy=%2215.00%22 r=%224%22 fill=%22%23f44e6a%22 stroke=%22%23f44e6a%22 stroke-width=%221%22/><circle cx=%2230.00%22 cy=%220.00%22 r=%224%22 fill=%22%2300643c%22 stroke=%22%2300643c%22 stroke-width=%221%22/></g><text x=%220.00%22 y=%2295.80%22 font-size=%229%22 fill=%22%23232530%22 font-weight=%22400%22 text-anchor=%22middle%22 dominant-baseline=%22hanging%22 stroke=%22%23ffffff%22 stroke-width=%223.15%22 stroke-linejoin=%22round%22 paint-order=%22stroke%22>MSB_1</text><text x=%2215.00%22 y=%22102.00%22 font-size=%2210%22 fill=%22%23b8461c%22 font-weight=%22700%22 text-anchor=%22middle%22 dominant-baseline=%22hanging%22 stroke=%22%23ffffff%22 stroke-width=%223.50%22 stroke-linejoin=%22round%22 paint-order=%22stroke%22>E0</text><g transform=%22matrix(6.12323e-17 1 -1 6.12323e-17 576.000 -60.000)%22><rect x=%22-30.00%22 y=%22-30.00%22 width=%2260.00%22 height=%2260.00%22 fill=%22%23f4f5f7%22 stroke=%22%23232530%22 stroke-width=%221%22/><use href=%22%23g-eo_ps%22 transform=%22translate(-30.00 -30.00) scale(1.2)%22/><circle cx=%22-30.00%22 cy=%22-15.00%22 r=%224%22 fill=%22%2300643c%22 stroke=%22%2300643c%22 stroke-width=%221%22/><circle cx=%22-30.00%22 cy=%2215.00%22 r=%224%22 fill=%22%23f44e6a%22 stroke=%22%23f44e6a%22 stroke-width=%221%22/><circle cx=%2230.00%22 cy=%220.00%22 r=%224%22 fill=%22%2300643c%22 stroke=%22%2300643c%22 stroke-width=%221%22/></g><text x=%22576.00%22 y=%22-24.20%22 font-size=%229%22 fill=%22%23232530%22 font-weight=%22400%22 text-anchor=%22middle%22 dominant-baseline=%22hanging%22 stroke=%22%23ffffff%22 stroke-width=%223.15%22 stroke-linejoin=%22round%22 paint-order=%22stroke%22>LSB_1</text><text x=%22561.00%22 y=%22-102.00%22 font-size=%2210%22 fill=%22%23b8461c%22 font-weight=%22700%22 text-anchor=%22middle%22 dominant-baseline=%22auto%22 stroke=%22%23ffffff%22 stroke-width=%223.50%22 stroke-linejoin=%22round%22 paint-order=%22stroke%22>E1</text><g transform=%22matrix(6.12323e-17 -1 1 6.12323e-17 384.000 60.000)%22><rect x=%22-30.00%22 y=%22-30.00%22 width=%2260.00%22 height=%2260.00%22 fill=%22%23f4f5f7%22 stroke=%22%23232530%22 stroke-width=%221%22/><use href=%22%23g-eo_ps%22 transform=%22translate(-30.00 -30.00) scale(1.2)%22/><circle cx=%22-30.00%22 cy=%220.00%22 r=%224%22 fill=%22%2300643c%22 stroke=%22%2300643c%22 stroke-width=%221%22/><circle cx=%2230.00%22 cy=%220.00%22 r=%224%22 fill=%22%2300643c%22 stroke=%22%2300643c%22 stroke-width=%221%22/></g><text x=%22384.00%22 y=%2295.80%22 font-size=%229%22 fill=%22%23232530%22 font-weight=%22400%22 text-anchor=%22middle%22 dominant-baseline=%22hanging%22 stroke=%22%23ffffff%22 stroke-width=%223.15%22 stroke-linejoin=%22round%22 paint-order=%22stroke%22>Analytic_Waveguide_1</text><g fill=%22none%22 stroke-width=%222%22></g></svg>)
Then, we instantiate the microring modulator and compute its optical S-matrix over a fine wavelength sweep around the O-band carrier. Using a dense wavelength grid is essential for resonant devices because the resonance features are narrow and require high spectral resolution.
By plotting the through response, we observe a clear resonance dip at approximately 1309 nm, confirming that the ring resonance is captured by the circuit-level model of the assembled MRM.
# Instantiate the microring modulatormrm = create_mrm()
# Compute the S-matrix of the microring over the fine frequency grids_matrix_mrm = mrm.s_matrix(freqs_fine)
# Plot the through-port transmission response to visualize the resonance dipfig, ax = pf.plot_s_matrix(    s_matrix_mrm, y="dB", input_ports=["P0"], output_ports=["P1"])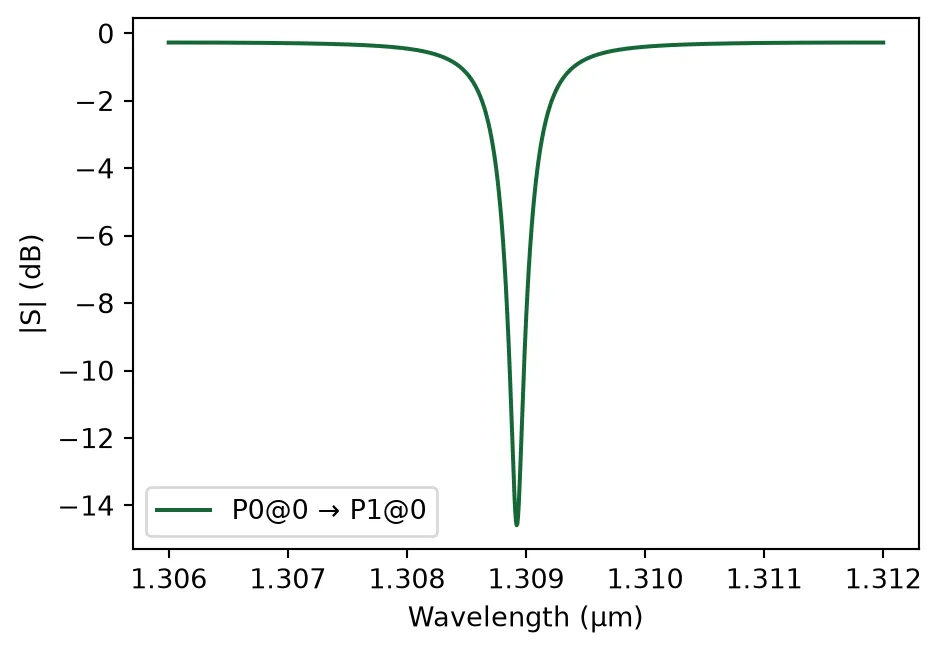
Voltage-Dependent Resonance Tuning
Section titled “Voltage-Dependent Resonance Tuning”In this section, we analyze how the microring transmission spectrum shifts with applied junction voltage for the MSB and LSB modulator segments.
Although the physical device operates under reverse bias (negative voltage), we apply positive voltage values in the model for simplicity while keeping positive. If we were to use negative voltages directly, we would need to assign negative values for to preserve the correct modulation polarity. To avoid confusion, the plot legend explicitly displays the voltage with a negative sign to emphasize that these correspond to reverse-bias conditions.
For each voltage value, we:
- apply the voltage to only one segment at a time (MSB-only or LSB-only),
- compute the updated S-matrix over a fine wavelength grid,
- convert the through response to in dB, and
- extract the resonance wavelength as the wavelength at which the transmission is minimum.
# Reverse bias voltagesvoltages = np.array([-0.5, 0, 1, 2, 3, 4])
# Initialize the figurefig, ax = plt.subplots(1, 2, figsize=(10, 4))
res_wv_msb = np.zeros_like(voltages)res_wv_lsb = np.zeros_like(voltages)for i, v in enumerate(voltages):    # Update only the MSB segment voltage while keeping LSB at 0 V    updates_msb = {        ("MSB", 0): {"model_updates": {"voltage": v}},        ("LSB", 0): {"model_updates": {"voltage": 0}},    }    # Update only the LSB segment voltage while keeping MSB at 0 V    updates_lsb = {        ("MSB", 0): {"model_updates": {"voltage": 0}},        ("LSB", 0): {"model_updates": {"voltage": v}},    }    # Compute the S-matrix under MSB-only and LSB-only bias conditions    s_matrix_msb = mrm.s_matrix(freqs_fine, model_kwargs={"updates": updates_msb})    s_matrix_lsb = mrm.s_matrix(freqs_fine, model_kwargs={"updates": updates_lsb})
    # Compute the through response in dB    s_21_msb = 10 * np.log10(np.abs(s_matrix_msb[("P0@0", "P1@0")]) ** 2)    s_21_lsb = 10 * np.log10(np.abs(s_matrix_lsb[("P0@0", "P1@0")]) ** 2)
    # Extract the resonance wavelength as the transmission minimum    res_wv_msb[i] = lda_fine[np.argmin(s_21_msb)]    res_wv_lsb[i] = lda_fine[np.argmin(s_21_lsb)]
    # Label voltage with negative sign to emphasize reverse-bias convention    label = f"$V = {-v:.1f} V$"    ax[0].plot(lda_fine * 1000, s_21_msb, label=label)    ax[1].plot(lda_fine * 1000, s_21_lsb, label=label)
# Final plot formattingax[0].set_xlabel("Wavelength (nm)")ax[0].set_ylabel("Through-port transmission $|S_{21}|^2$ (dB)")ax[0].legend()ax[0].set_xlim(1308.6, 1309.3)ax[0].set_title("MSB segment: resonance vs. bias voltage")ax[0].grid(True, alpha=0.3)ax[1].set_xlabel("Wavelength (nm)")ax[1].set_ylabel("Through-port transmission $|S_{21}|^2$ (dB)")ax[1].legend()ax[1].set_xlim(1308.6, 1309.3)ax[1].set_title("LSB segment: resonance vs. bias voltage")ax[1].grid(True, alpha=0.3)fig.suptitle("Microring transmission vs. wavelength at different bias voltages", y=1.02)plt.tight_layout()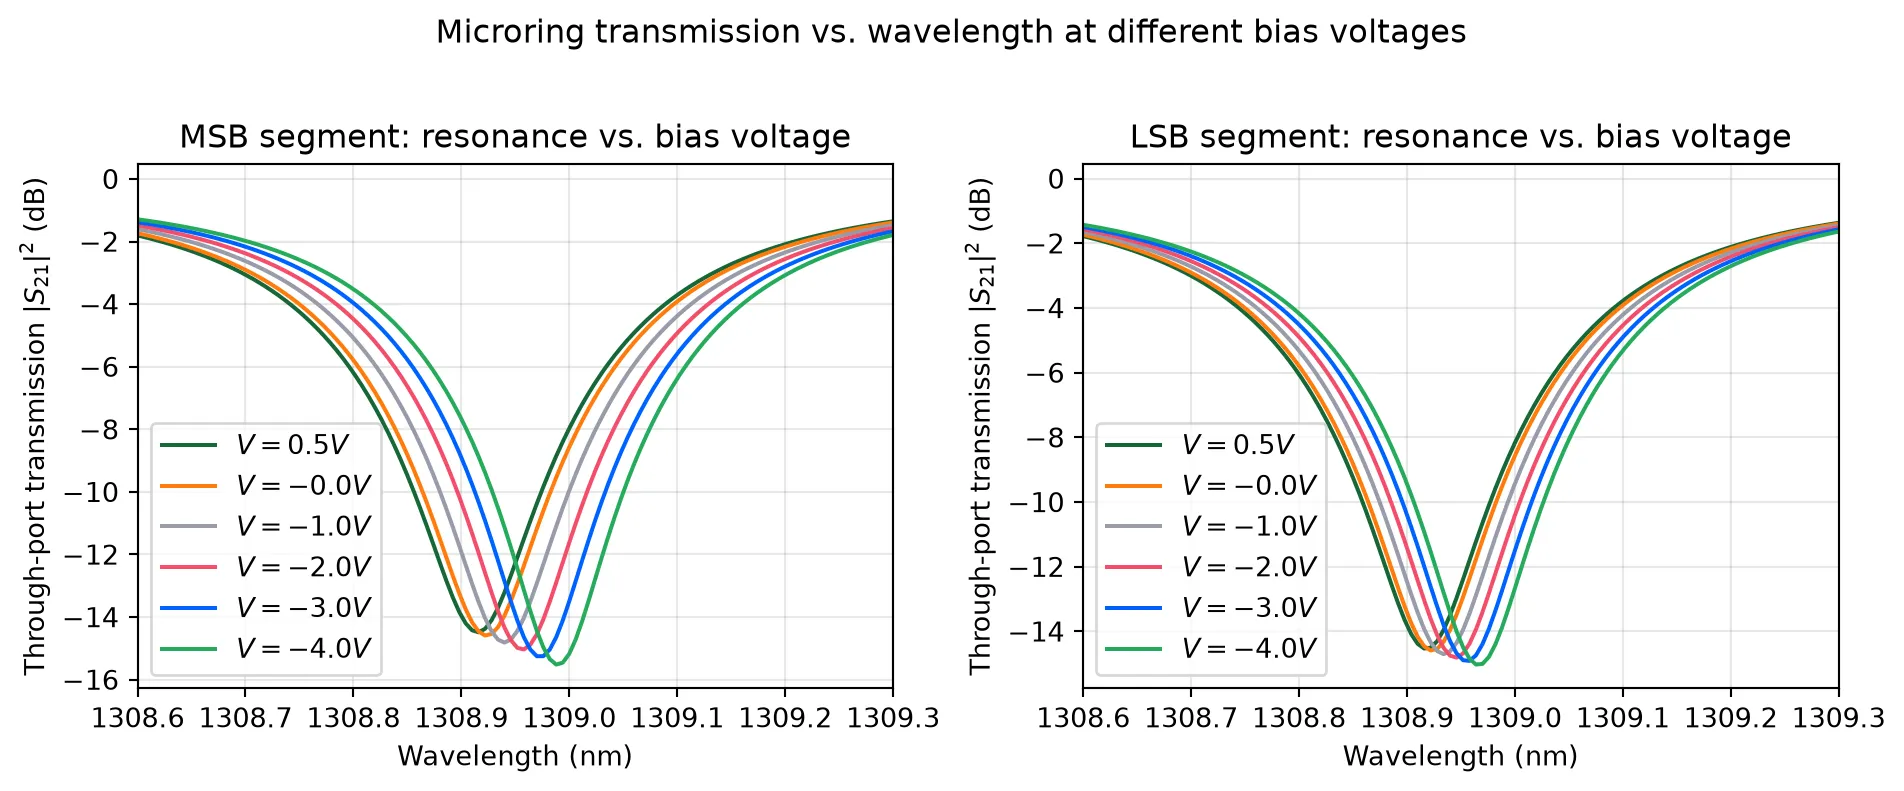
We also quantify the voltage-induced resonance shift for the MSB and LSB segments by plotting the extracted resonance wavelength as a function of bias voltage.
As before, the horizontal axis is shown using negative voltages to reflect the physical reverse-bias operation, while the model internally uses positive voltages. We then perform a linear fit to extract the tuning efficiency in units of pm/V for each segment, which can be directly compared against the reported experimental values.
# Plot resonance wavelength versus bias voltage for MSB and LSBfig, ax = plt.subplots(1, 2, figsize=(10, 4))
# MSB resonance shiftax[0].plot(-voltages, res_wv_msb * 1e6, "ro", label="Simulated resonance")ax[0].set_ylabel("Resonance wavelength (pm)")ax[0].set_xlabel("Bias voltage (V, reverse bias)")ax[0].set_title("MSB: resonance shift vs. voltage")
# Linear fit for MSBmsb_fit_params = np.polyfit(voltages, res_wv_msb * 1e6, 1)slope_msb = msb_fit_params[0]intercept_msb = msb_fit_params[1]
# Fitted line: y = m*x + cfit_msb = slope_msb * voltages + intercept_msbax[0].plot(-voltages, fit_msb, "b--", label=f"Fit ({slope_msb:.1f} pm/V)")ax[0].legend()
# LSB resonance shiftax[1].plot(-voltages, res_wv_lsb * 1e6, "ro", label="Simulated resonance")ax[1].set_ylabel("Resonance wavelength (pm)")ax[1].set_xlabel("Bias voltage (V, reverse bias)")ax[1].set_title("LSB: resonance shift vs. voltage")
# Linear fit for LSBlsb_fit_params = np.polyfit(voltages, res_wv_lsb * 1e6, 1)slope_lsb = lsb_fit_params[0]intercept_lsb = lsb_fit_params[1]
# Fitted line: y = m*x + cfit_lsb = slope_lsb * voltages + intercept_lsbax[1].plot(-voltages, fit_lsb, "g--", label=f"Fit ({slope_lsb:.1f} pm/V)")ax[1].legend()
plt.tight_layout()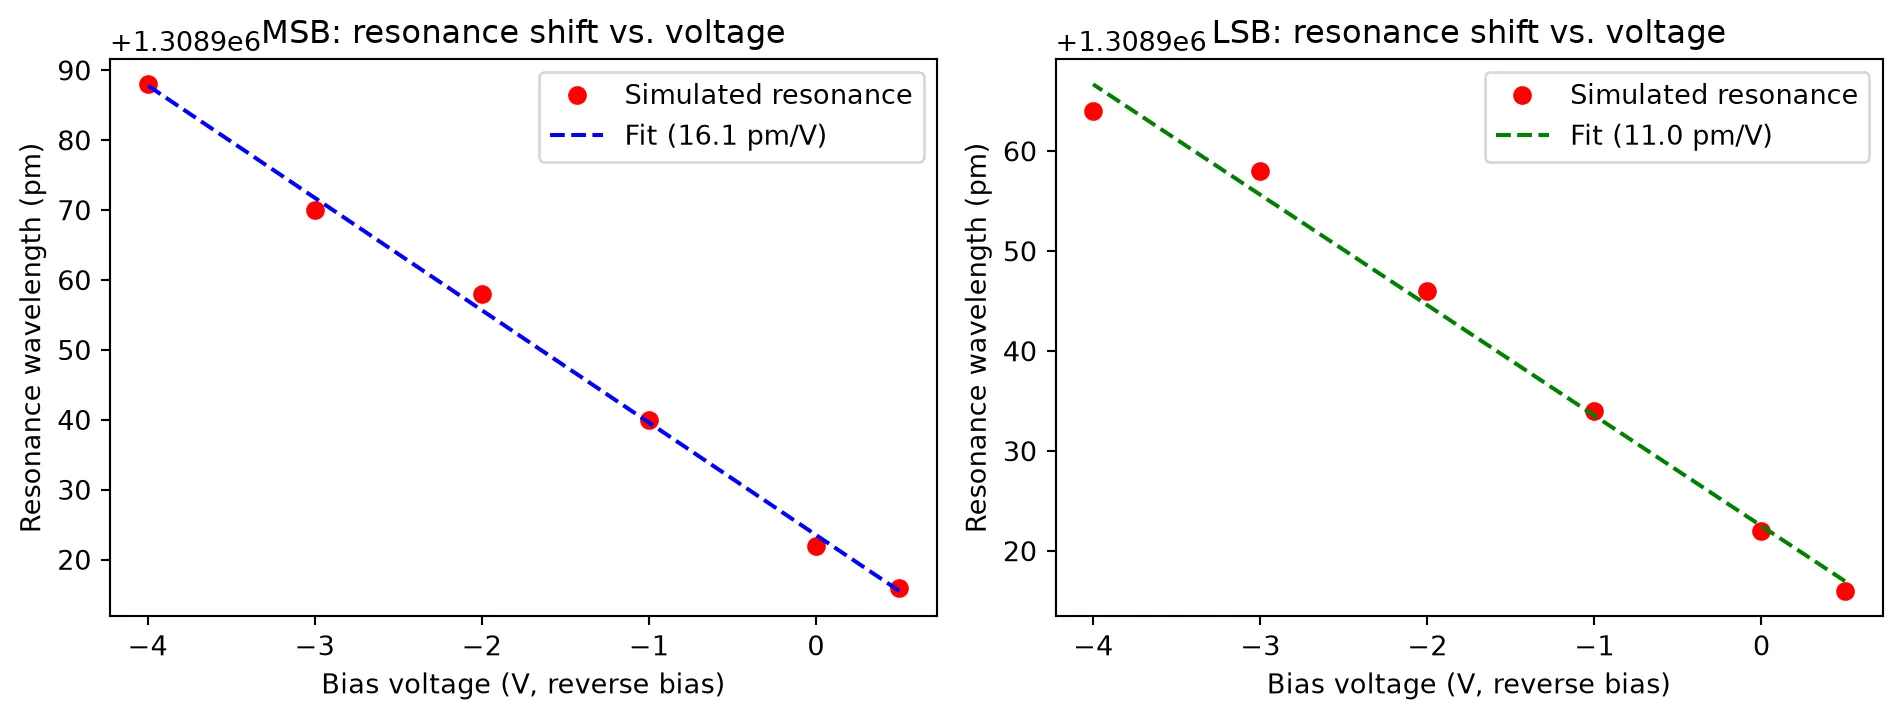
Full Time-Domain Dual-Segment MRM Testbench
Section titled “Full Time-Domain Dual-Segment MRM Testbench”In this section, we assemble a complete time-domain testbench for the two-segment microring modulator.
Electrical Drive Sources for Time-Domain Modulation
Section titled “Electrical Drive Sources for Time-Domain Modulation”First, we define the time-domain electrical excitation used to drive the microring modulator segments.
PhotonForge operates on complex wave amplitudes, where electrical and optical signals are represented in terms of voltage-wave amplitudes rather than instantaneous power. As a result, the signal magnitude is proportional to the square root of power. To apply a desired physical voltage level to a port with characteristic impedance , the voltage values must therefore be scaled by . In this example, we assume a default impedance, which is why both the waveform amplitude and offset are divided by .
We set the symbol rate to . For the MSB drive, the combination of offset + amplitude/2 defines the effective DC bias point applied to the junction. With the chosen parameters, this corresponds to a 3 V reverse-bias operating point, consistent with the device characterization. The LSB source is initially configured with zero amplitude and zero offset so that it can be enabled independently without modifying the circuit topology.
The code below implements these two voltage sources using pfa.signal_source.
f_m = 100e9Z0 = 50.0
voltage_source_msb = pfa.signal_source(    frequency=f_m,    amplitude=1.6 / Z0**0.5,    offset=2.2 / Z0**0.5,    waveform="trapezoid",    width=1,    prbs=7,    seed=123,)
voltage_source_lsb = pfa.signal_source(    frequency=f_m,    amplitude=0,    offset=0,    waveform="trapezoid",    width=1,    prbs=7,    seed=123,)
Continuous-Wave Laser Source
Section titled “Continuous-Wave Laser Source”Then, we define the optical input laser used for time-domain modulation simulations.
We intentionally detune the laser wavelength by 0.1 nm from the resonance to operate the microring close to the point of maximum transmission slope, where the modulation efficiency is highest. This operating point is commonly used in resonant modulators to maximize optical modulation amplitude for a given phase shift.
The laser is modeled as an ideal continuous-wave (CW) source with fixed optical power and frequency, implemented as a pfa.cw_laser. This abstraction provides a clean optical excitation without introducing additional modulation or noise sources.
lambda_laser = res_wv_msb[-2] - 0.0001  # detuned to operate close to maximum slopef_laser = pf.C_0 / lambda_laser
laser = pfa.cw_laser(power=1e-3)
Photodiode Receiver
Section titled “Photodiode Receiver”We also need to define a compact photodiode model to convert the modulated optical signal into an electrical waveform that we can monitor in the time domain.
We configure a pfa.photodiode using parameters consistent with a Keysight N1030A 65 GHz unamplified module, including responsivity, effective transimpedance gain from a 50 Ω load, saturation and dark current limits, thermal (Johnson) noise, and a finite receiver bandwidth modeled as a low-pass response with a specified roll-off.
The pfa.photodiode component already exposes an electrical output port (E0) alongside the optical input (P0), so it can be connected directly into the circuit netlist as an optical input / electrical output element.
# Setup for Keysight N1030A (65 GHz Unamplified Module)detector = pfa.photodiode( responsivity=0.85, # A/W (Typical for InGaAs) gain=50.0, # V/A (Effective gain from 50 Ohm load) saturation_current=6.8e-3, # A (Based on 8 mW max linear input) dark_current=10e-9, # A (Typical 10 nA) thermal_noise=3.3e-22, # A²/Hz (Johnson noise of 50 Ohm load) filter_frequency=65e9, # Hz (65 GHz Bandwidth) roll_off=2, seed=123, # Same noise in every run)Finally, we assemble the two-segment microring modulator by wiring together the optical and electrical building blocks into a single circuit netlist.
The netlist includes:
- the microring modulator (with separate MSB and LSB electrical ports),
- two independent electrical drive sources (MSB and LSB),
- a CW laser feeding the microring input, and
- a photodiode receiver that converts the modulated optical output into an electrical signal.
We connect each electrical source to its corresponding modulator segment (MSB-to-E0 and LSB-to-E1), route the laser into the microring input port, and route the microring through-port output into the detector. Finally, we expose only the detector’s electrical output as the external port of the composite component so that downstream simulations can directly probe the recovered electrical waveform.
The next cell defines the netlist as a dictionary (instances, virtual connections, exposed ports) and builds the composite component with component_from_netlist.
netlist_dual_segment = {    "name": "Dual Segment MRM modulator",    "instances": {        "mrm": {"component": mrm, "origin": (10, 0)},        "vs_msb": {"component": voltage_source_msb, "origin": (15, 5)},        "vs_lsb": {"component": voltage_source_lsb, "origin": (30, 50)},        "laser": {"component": laser, "rotation": 180},        "detector": {"component": detector, "origin": (30, 0)},    },    "virtual connections": [        (("vs_msb", "E0"), ("mrm", "E0")),  # Connect MSB source to MSB port        (("vs_lsb", "E0"), ("mrm", "E1")),  # Connect LSB source to LSB port        (("laser", "P0"), ("mrm", "P0")),        (("detector", "P0"), ("mrm", "P1")),    ],    "ports": [("detector", "E0")],    "models": [(pf.CircuitModel(), "Circuit")],}
msb_modulator = pf.component_from_netlist(netlist_dual_segment)msb_modulator;fill:%23221f20;font-weight:bold;font-size:3.049200px;}.terminal{fill:none;stroke:%23805080;stroke-width:0.381150;}.dashed{stroke-dasharray:1.905750,1.143450;}.port{fill:none;stroke:%23805080;stroke-width:0.762300;}.virtual-connection{fill:none;stroke:%23907090;stroke-width:0.571725;}.layer_5_0{stroke:%23998573;fill:url(%23pat-layer_5_0);fill-opacity:0.492;}.label_5_0{fill:%23998573;}.layer_3_0{stroke:%238851ad;fill:url(%23pat-layer_3_0);fill-opacity:0.492;}.label_3_0{fill:%238851ad;}.layer_4_0{stroke:%23535e59;fill:url(%23pat-layer_4_0);fill-opacity:0.492;}.label_4_0{fill:%23535e59;}.layer_1_0{stroke:%23858d89;fill:url(%23pat-layer_1_0);fill-opacity:0.492;}.label_1_0{fill:%23858d89;}.layer_2_0{stroke:%235b98b9;fill:url(%23pat-layer_2_0);fill-opacity:0.492;}.label_2_0{fill:%235b98b9;}</style><defs><path id=%22port-symbol%22 class=%22port%22 d=%22M 0,-1.524600 L 2.286900,0 0,1.524600%22 /><path id=%22ref-port-symbol%22 class=%22port%22 style=%22stroke-opacity:0.33;%22 d=%22M 0,-1.143450 C 1.524600,-1.143450 1.524600,1.143450 0,1.143450%22 /><circle id=%22port-bend-symbol%22 style=%22stroke-width:0;stroke:none;fill:%23805080;fill-opacity:1;%22 cx=%220%22 cy=%220%22 r=%220.686070%22 /><circle id=%22connection-symbol%22 style=%22stroke-width:0;stroke:none;fill:%23907090;fill-opacity:1;%22 cx=%220%22 cy=%220%22 r=%220.800415%22 /><pattern id=%22pat-layer_5_0%22 patternUnits=%22userSpaceOnUse%22 width=%221.905750%22 height=%221.905750%22 patternTransform=%22translate(0.112103,1.705145)%22><line x1=%221.905750%22 y1=%220%22 x2=%220%22 y2=%221.905750%22 style=%22stroke:%23998573;stroke-width:0.190575%22 /><line x1=%222.858625%22 y1=%220.952875%22 x2=%220.952875%22 y2=%222.858625%22 style=%22stroke:%23998573;stroke-width:0.190575%22 /><line x1=%220.952875%22 y1=%22-0.952875%22 x2=%22-0.952875%22 y2=%220.952875%22 style=%22stroke:%23998573;stroke-width:0.190575%22 /></pattern><pattern id=%22pat-layer_3_0%22 patternUnits=%22userSpaceOnUse%22 width=%221.143450%22 height=%221.143450%22 patternTransform=%22translate(0.269047,0.842542)%22><circle cx=%220.571725%22 cy=%220.571725%22 r=%220.190575%22 style=%22stroke:none;fill:%238851ad;fill-opacity:1.0%22 /></pattern><pattern id=%22pat-layer_4_0%22 patternUnits=%22userSpaceOnUse%22 width=%221.905750%22 height=%221.905750%22 patternTransform=%22translate(1.233132,0.601816)%22><line x1=%220.952875%22 y1=%220%22 x2=%220.952875%22 y2=%221.905750%22 style=%22stroke:%23535e59;stroke-width:0.190575%22 /><line x1=%220%22 y1=%220.952875%22 x2=%221.905750%22 y2=%220.952875%22 style=%22stroke:%23535e59;stroke-width:0.190575%22 /></pattern><pattern id=%22pat-layer_1_0%22 patternUnits=%22userSpaceOnUse%22 width=%221.905750%22 height=%221.905750%22 patternTransform=%22translate(0.784721,1.103329)%22><circle cx=%220.952875%22 cy=%220.952875%22 r=%220.190575%22 style=%22stroke:none;fill:%23858d89;fill-opacity:1.0%22 /></pattern><pattern id=%22pat-layer_2_0%22 patternUnits=%22userSpaceOnUse%22 width=%221.905750%22 height=%221.905750%22 patternTransform=%22translate(1.569441,0.300908)%22><line x1=%220%22 y1=%220%22 x2=%221.905750%22 y2=%221.905750%22 style=%22stroke:%235b98b9;stroke-width:0.190575%22 /><line x1=%22-0.952875%22 y1=%220.952875%22 x2=%220.952875%22 y2=%222.858625%22 style=%22stroke:%235b98b9;stroke-width:0.190575%22 /><line x1=%220.952875%22 y1=%22-0.952875%22 x2=%222.858625%22 y2=%220.952875%22 style=%22stroke:%235b98b9;stroke-width:0.190575%22 /></pattern><g id=%22C1%22 data-name=%22Microring Modulator%22><use transform=%22translate(0.000000 0.000000)%22 href=%22%23C6%22 /><use transform=%22translate(0.000000 5.000000) rotate(90.000000)%22 href=%22%23C7%22 /><use transform=%22translate(20.000000 45.000000) rotate(-90.000000)%22 href=%22%23C8%22 /><use transform=%22translate(20.000000 5.000000) rotate(90.000000)%22 href=%22%23C9%22 /><g transform=%22translate(-6.520000 5.000000)%22><use href=%22%23connection-symbol%22 /></g><g transform=%22translate(0.000000 7.590000)%22><use href=%22%23connection-symbol%22 /></g><path class=%22virtual-connection%22 d=%22M -6.520000,5.000000 C -6.520000,3.830735 -1.169265,7.590000 0.000000,7.590000%22 /><g transform=%22translate(-6.520000 45.000000)%22><use href=%22%23connection-symbol%22 /></g><g transform=%22translate(26.520000 45.000000)%22><use href=%22%23connection-symbol%22 /></g><path class=%22virtual-connection%22 d=%22M -6.520000,45.000000 C -6.520000,50.506667 26.520000,50.506667 26.520000,45.000000%22 /><g transform=%22translate(26.520000 25.000000)%22><use href=%22%23connection-symbol%22 /></g><g transform=%22translate(13.480000 20.398000)%22><use href=%22%23connection-symbol%22 /></g><path class=%22virtual-connection%22 d=%22M 26.520000,25.000000 C 26.520000,22.695295 13.480000,22.702705 13.480000,20.398000%22 /><g transform=%22translate(13.480000 5.000000)%22><use href=%22%23connection-symbol%22 /></g><g transform=%22translate(11.120000 7.590000)%22><use href=%22%23connection-symbol%22 /></g><path class=%22virtual-connection%22 d=%22M 13.480000,5.000000 C 13.480000,4.416008 11.703992,7.590000 11.120000,7.590000%22 /></g><g id=%22C2%22 data-name=%22Source%22><path class=%22layer_0_32767%22 d=%22M 0.000000,9.700000 0.000000,0.000000 11.640000,0.000000 11.640000,6.125000 11.640000,6.375000 11.640000,9.700000 z M 11.520000,6.375000 5.880000,6.375000 5.880000,8.100000 3.650000,8.100000 3.620000,8.080000 3.620000,4.820000 3.600000,4.800000 1.720000,4.800000 1.720000,4.420000 3.620000,4.420000 3.650000,4.400000 4.020000,4.420000 4.020000,7.700000 4.050000,7.720000 5.450000,7.720000 5.500000,7.680000 5.500000,4.800000 5.480000,4.780000 5.500000,4.400000 5.850000,4.400000 5.880000,4.420000 9.920000,4.420000 9.920000,4.800000 5.900000,4.800000 5.880000,4.820000 5.880000,6.125000 11.520000,6.125000 11.520000,0.120000 0.120000,0.120000 0.120000,9.580000 11.520000,9.580000 z%22 /><path class=%22layer_0_32767%22 d=%22M 1.460000,2.026000 1.281000,2.205000 0.921000,2.205000 0.740000,2.026000 0.740000,1.805000 0.940000,1.605000 1.220000,1.605000 1.300000,1.525000 1.300000,1.405000 1.220000,1.325000 0.980000,1.325000 0.881000,1.426000 0.740000,1.426000 0.740000,1.346000 0.921000,1.165000 1.281000,1.165000 1.460000,1.346000 1.460000,1.565000 1.260000,1.765000 0.980000,1.765000 0.900000,1.845000 0.900000,1.965000 0.980000,2.045000 1.220000,2.045000 1.321000,1.946000 1.460000,1.946000 z%22 /><path class=%22layer_0_32767%22 d=%22M 1.684000,1.725000 1.684000,1.165000 1.844000,1.165000 1.844000,1.725000 z%22 /><path class=%22layer_0_32767%22 d=%22M 1.684000,2.045000 1.684000,1.885000 1.844000,1.885000 1.844000,2.045000 z%22 /><path class=%22layer_0_32767%22 d=%22M 2.249000,1.885000 2.068000,1.706000 2.068000,1.346000 2.249000,1.165000 2.548000,1.165000 2.548000,1.005000 2.228000,1.005000 2.228000,0.845000 2.588000,0.845000 2.708000,0.965000 2.708000,1.885000 z M 2.548000,1.325000 2.308000,1.325000 2.228000,1.405000 2.228000,1.645000 2.308000,1.725000 2.548000,1.725000 z%22 /><path class=%22layer_0_32767%22 d=%22M 2.932000,1.885000 2.932000,1.165000 3.092000,1.165000 3.092000,1.645000 3.172000,1.725000 3.252000,1.725000 3.332000,1.645000 3.332000,1.165000 3.492000,1.165000 3.492000,1.706000 3.313000,1.885000 3.153000,1.885000 3.092000,1.826000 3.033000,1.885000 z%22 /><path class=%22layer_0_32767%22 d=%22M 4.276000,1.885000 3.796000,1.885000 3.716000,1.805000 3.716000,1.725000 4.196000,1.725000 4.196000,1.605000 3.836000,1.605000 3.716000,1.485000 3.716000,1.285000 3.836000,1.165000 4.356000,1.165000 4.356000,1.805000 z M 4.196000,1.325000 3.876000,1.325000 3.876000,1.445000 4.196000,1.445000 z%22 /><path class=%22layer_0_32767%22 d=%22M 4.900000,1.325000 4.740000,1.325000 4.740000,2.205000 4.580000,2.205000 4.580000,1.285000 4.700000,1.165000 4.900000,1.165000 z%22 /><path class=%22layer_0_32767%22 d=%22M 6.100000,1.165000 6.540000,1.165000 6.660000,1.285000 6.660000,1.485000 6.540000,1.605000 6.180000,1.605000 6.180000,1.725000 6.660000,1.725000 6.660000,1.805000 6.580000,1.885000 6.100000,1.885000 6.020000,1.805000 6.020000,1.565000 6.140000,1.445000 6.500000,1.445000 6.500000,1.325000 6.020000,1.325000 6.020000,1.245000 z%22 /><path class=%22layer_0_32767%22 d=%22M 7.345000,1.885000 7.065000,1.885000 6.884000,1.706000 6.884000,1.346000 7.065000,1.165000 7.345000,1.165000 7.524000,1.346000 7.524000,1.706000 z M 7.364000,1.405000 7.284000,1.325000 7.124000,1.325000 7.044000,1.405000 7.044000,1.645000 7.124000,1.725000 7.284000,1.725000 7.364000,1.645000 z%22 /><path class=%22layer_0_32767%22 d=%22M 8.308000,1.165000 8.308000,1.885000 8.148000,1.885000 8.148000,1.405000 8.068000,1.325000 7.988000,1.325000 7.908000,1.405000 7.908000,1.885000 7.748000,1.885000 7.748000,1.346000 7.929000,1.165000 8.089000,1.165000 8.148000,1.226000 8.209000,1.165000 z%22 /><path class=%22layer_0_32767%22 d=%22M 9.172000,1.645000 9.172000,1.746000 9.033000,1.885000 8.753000,1.885000 8.692000,1.826000 8.633000,1.885000 8.532000,1.885000 8.532000,1.165000 8.692000,1.165000 8.692000,1.645000 8.772000,1.725000 8.932000,1.725000 9.012000,1.645000 z%22 /><path class=%22layer_0_32767%22 d=%22M 10.036000,1.426000 9.897000,1.426000 9.796000,1.325000 9.636000,1.325000 9.556000,1.405000 9.556000,1.645000 9.636000,1.725000 9.796000,1.725000 9.897000,1.626000 10.036000,1.626000 10.036000,1.706000 9.857000,1.885000 9.577000,1.885000 9.396000,1.706000 9.396000,1.346000 9.577000,1.165000 9.857000,1.165000 10.036000,1.346000 z%22 /><path class=%22layer_0_32767%22 d=%22M 10.780000,1.885000 10.380000,1.885000 10.260000,1.765000 10.260000,1.285000 10.380000,1.165000 10.860000,1.165000 10.860000,1.325000 10.420000,1.325000 10.420000,1.445000 10.780000,1.445000 10.900000,1.565000 10.900000,1.765000 z M 10.740000,1.605000 10.420000,1.605000 10.420000,1.725000 10.740000,1.725000 z%22 /></g><g id=%22C3%22 data-name=%22Source%22><path class=%22layer_0_32767%22 d=%22M 0.000000,9.700000 0.000000,0.000000 11.640000,0.000000 11.640000,6.125000 11.640000,6.375000 11.640000,9.700000 z M 11.520000,6.375000 5.880000,6.375000 5.880000,8.100000 3.650000,8.100000 3.620000,8.080000 3.620000,4.820000 3.600000,4.800000 1.720000,4.800000 1.720000,4.420000 3.620000,4.420000 3.650000,4.400000 4.020000,4.420000 4.020000,7.700000 4.050000,7.720000 5.450000,7.720000 5.500000,7.680000 5.500000,4.800000 5.480000,4.780000 5.500000,4.400000 5.850000,4.400000 5.880000,4.420000 9.920000,4.420000 9.920000,4.800000 5.900000,4.800000 5.880000,4.820000 5.880000,6.125000 11.520000,6.125000 11.520000,0.120000 0.120000,0.120000 0.120000,9.580000 11.520000,9.580000 z%22 /><path class=%22layer_0_32767%22 d=%22M 1.460000,2.026000 1.281000,2.205000 0.921000,2.205000 0.740000,2.026000 0.740000,1.805000 0.940000,1.605000 1.220000,1.605000 1.300000,1.525000 1.300000,1.405000 1.220000,1.325000 0.980000,1.325000 0.881000,1.426000 0.740000,1.426000 0.740000,1.346000 0.921000,1.165000 1.281000,1.165000 1.460000,1.346000 1.460000,1.565000 1.260000,1.765000 0.980000,1.765000 0.900000,1.845000 0.900000,1.965000 0.980000,2.045000 1.220000,2.045000 1.321000,1.946000 1.460000,1.946000 z%22 /><path class=%22layer_0_32767%22 d=%22M 1.684000,1.725000 1.684000,1.165000 1.844000,1.165000 1.844000,1.725000 z%22 /><path class=%22layer_0_32767%22 d=%22M 1.684000,2.045000 1.684000,1.885000 1.844000,1.885000 1.844000,2.045000 z%22 /><path class=%22layer_0_32767%22 d=%22M 2.249000,1.885000 2.068000,1.706000 2.068000,1.346000 2.249000,1.165000 2.548000,1.165000 2.548000,1.005000 2.228000,1.005000 2.228000,0.845000 2.588000,0.845000 2.708000,0.965000 2.708000,1.885000 z M 2.548000,1.325000 2.308000,1.325000 2.228000,1.405000 2.228000,1.645000 2.308000,1.725000 2.548000,1.725000 z%22 /><path class=%22layer_0_32767%22 d=%22M 2.932000,1.885000 2.932000,1.165000 3.092000,1.165000 3.092000,1.645000 3.172000,1.725000 3.252000,1.725000 3.332000,1.645000 3.332000,1.165000 3.492000,1.165000 3.492000,1.706000 3.313000,1.885000 3.153000,1.885000 3.092000,1.826000 3.033000,1.885000 z%22 /><path class=%22layer_0_32767%22 d=%22M 4.276000,1.885000 3.796000,1.885000 3.716000,1.805000 3.716000,1.725000 4.196000,1.725000 4.196000,1.605000 3.836000,1.605000 3.716000,1.485000 3.716000,1.285000 3.836000,1.165000 4.356000,1.165000 4.356000,1.805000 z M 4.196000,1.325000 3.876000,1.325000 3.876000,1.445000 4.196000,1.445000 z%22 /><path class=%22layer_0_32767%22 d=%22M 4.900000,1.325000 4.740000,1.325000 4.740000,2.205000 4.580000,2.205000 4.580000,1.285000 4.700000,1.165000 4.900000,1.165000 z%22 /><path class=%22layer_0_32767%22 d=%22M 6.100000,1.165000 6.540000,1.165000 6.660000,1.285000 6.660000,1.485000 6.540000,1.605000 6.180000,1.605000 6.180000,1.725000 6.660000,1.725000 6.660000,1.805000 6.580000,1.885000 6.100000,1.885000 6.020000,1.805000 6.020000,1.565000 6.140000,1.445000 6.500000,1.445000 6.500000,1.325000 6.020000,1.325000 6.020000,1.245000 z%22 /><path class=%22layer_0_32767%22 d=%22M 7.345000,1.885000 7.065000,1.885000 6.884000,1.706000 6.884000,1.346000 7.065000,1.165000 7.345000,1.165000 7.524000,1.346000 7.524000,1.706000 z M 7.364000,1.405000 7.284000,1.325000 7.124000,1.325000 7.044000,1.405000 7.044000,1.645000 7.124000,1.725000 7.284000,1.725000 7.364000,1.645000 z%22 /><path class=%22layer_0_32767%22 d=%22M 8.308000,1.165000 8.308000,1.885000 8.148000,1.885000 8.148000,1.405000 8.068000,1.325000 7.988000,1.325000 7.908000,1.405000 7.908000,1.885000 7.748000,1.885000 7.748000,1.346000 7.929000,1.165000 8.089000,1.165000 8.148000,1.226000 8.209000,1.165000 z%22 /><path class=%22layer_0_32767%22 d=%22M 9.172000,1.645000 9.172000,1.746000 9.033000,1.885000 8.753000,1.885000 8.692000,1.826000 8.633000,1.885000 8.532000,1.885000 8.532000,1.165000 8.692000,1.165000 8.692000,1.645000 8.772000,1.725000 8.932000,1.725000 9.012000,1.645000 z%22 /><path class=%22layer_0_32767%22 d=%22M 10.036000,1.426000 9.897000,1.426000 9.796000,1.325000 9.636000,1.325000 9.556000,1.405000 9.556000,1.645000 9.636000,1.725000 9.796000,1.725000 9.897000,1.626000 10.036000,1.626000 10.036000,1.706000 9.857000,1.885000 9.577000,1.885000 9.396000,1.706000 9.396000,1.346000 9.577000,1.165000 9.857000,1.165000 10.036000,1.346000 z%22 /><path class=%22layer_0_32767%22 d=%22M 10.780000,1.885000 10.380000,1.885000 10.260000,1.765000 10.260000,1.285000 10.380000,1.165000 10.860000,1.165000 10.860000,1.325000 10.420000,1.325000 10.420000,1.445000 10.780000,1.445000 10.900000,1.565000 10.900000,1.765000 z M 10.740000,1.605000 10.420000,1.605000 10.420000,1.725000 10.740000,1.725000 z%22 /></g><g id=%22C4%22 data-name=%22CW Laser%22><path class=%22layer_0_32767%22 d=%22M 0.000000,9.600000 0.000000,0.000000 10.500000,0.000000 10.500000,6.075000 10.500000,6.325000 10.500000,9.600000 z M 10.380000,6.325000 8.900000,6.325000 8.900000,8.000000 1.600000,8.000000 1.600000,4.400000 8.900000,4.400000 8.900000,6.075000 10.380000,6.075000 10.380000,0.120000 0.120000,0.120000 0.120000,9.480000 10.380000,9.480000 z M 7.840000,6.100000 7.800000,6.060000 6.920000,6.060000 7.320000,5.660000 7.140000,5.460000 6.740000,5.860000 6.700000,5.830000 6.700000,4.860000 6.640000,4.800000 6.470000,4.800000 6.420000,4.860000 6.420000,5.830000 6.370000,5.860000 5.970000,5.460000 5.770000,5.630000 6.200000,6.060000 1.740000,6.060000 1.700000,6.100000 1.800000,6.200000 1.700000,6.300000 1.740000,6.360000 6.140000,6.360000 5.770000,6.760000 5.970000,6.930000 6.340000,6.560000 6.420000,6.580000 6.420000,7.480000 6.470000,7.530000 6.640000,7.530000 6.700000,7.480000 6.700000,6.580000 6.770000,6.560000 7.140000,6.900000 7.320000,6.730000 6.940000,6.360000 7.800000,6.360000 7.840000,6.300000 z%22 /><path class=%22layer_0_32767%22 d=%22M 2.351000,1.005000 2.570000,1.205000 2.570000,1.365000 2.410000,1.365000 2.410000,1.285000 2.290000,1.165000 2.130000,1.165000 2.010000,1.285000 2.010000,1.765000 2.130000,1.885000 2.290000,1.885000 2.410000,1.765000 2.410000,1.685000 2.570000,1.685000 2.570000,1.845000 2.370000,2.045000 2.050000,2.045000 1.850000,1.845000 1.850000,1.205000 2.050000,1.005000 z%22 /><path class=%22layer_0_32767%22 d=%22M 2.794000,1.005000 2.975000,1.005000 3.274000,1.306000 3.575000,1.005000 3.754000,1.005000 3.754000,2.045000 3.594000,2.045000 3.594000,1.325000 3.514000,1.325000 3.274000,1.565000 3.034000,1.325000 2.954000,1.325000 2.954000,2.045000 2.794000,2.045000 z%22 /><path class=%22layer_0_32767%22 d=%22M 5.194000,1.165000 5.034000,1.165000 5.034000,2.045000 4.874000,2.045000 4.874000,1.125000 4.994000,1.005000 5.194000,1.005000 z%22 /><path class=%22layer_0_32767%22 d=%22M 5.978000,1.725000 5.498000,1.725000 5.418000,1.645000 5.418000,1.565000 5.898000,1.565000 5.898000,1.445000 5.538000,1.445000 5.418000,1.325000 5.418000,1.125000 5.538000,1.005000 6.058000,1.005000 6.058000,1.645000 z M 5.898000,1.165000 5.578000,1.165000 5.578000,1.285000 5.898000,1.285000 z%22 /><path class=%22layer_0_32767%22 d=%22M 6.362000,1.005000 6.802000,1.005000 6.922000,1.125000 6.922000,1.325000 6.802000,1.445000 6.442000,1.445000 6.442000,1.565000 6.922000,1.565000 6.922000,1.645000 6.842000,1.725000 6.362000,1.725000 6.282000,1.645000 6.282000,1.405000 6.402000,1.285000 6.762000,1.285000 6.762000,1.165000 6.282000,1.165000 6.282000,1.085000 z%22 /><path class=%22layer_0_32767%22 d=%22M 7.666000,1.725000 7.266000,1.725000 7.146000,1.605000 7.146000,1.125000 7.266000,1.005000 7.746000,1.005000 7.746000,1.165000 7.306000,1.165000 7.306000,1.285000 7.666000,1.285000 7.786000,1.405000 7.786000,1.605000 z M 7.626000,1.445000 7.306000,1.445000 7.306000,1.565000 7.626000,1.565000 z%22 /><path class=%22layer_0_32767%22 d=%22M 8.650000,1.485000 8.650000,1.586000 8.511000,1.725000 8.231000,1.725000 8.170000,1.666000 8.111000,1.725000 8.010000,1.725000 8.010000,1.005000 8.170000,1.005000 8.170000,1.485000 8.250000,1.565000 8.410000,1.565000 8.490000,1.485000 z%22 /></g><g id=%22C5%22 data-name=%22Photodiode%22><path class=%22layer_0_32767%22 d=%22M 4.685000,12.970000 4.435000,12.970000 0.000000,12.970000 0.000000,7.705000 0.000000,7.455000 0.000000,0.000000 9.130000,0.000000 9.130000,12.970000 z M 4.493000,8.940000 4.470000,8.920000 3.355000,8.920000 3.355000,8.740000 4.470000,8.740000 4.493000,8.670000 3.801000,7.700000 3.717000,7.700000 3.717000,7.705000 0.120000,7.705000 0.120000,12.850000 4.435000,12.850000 4.435000,11.320000 4.493000,11.320000 z M 9.010000,0.120000 0.120000,0.120000 0.120000,7.455000 3.656000,7.455000 2.965000,6.500000 4.470000,6.500000 4.493000,6.470000 4.493000,4.400000 4.716000,4.400000 4.716000,6.470000 4.749000,6.500000 6.165000,6.500000 4.716000,8.540000 4.749000,8.740000 5.786000,8.740000 5.786000,8.920000 4.749000,8.920000 4.716000,8.940000 4.716000,11.370000 4.685000,11.370000 4.685000,12.850000 9.010000,12.850000 z%22 /><path class=%22layer_0_32767%22 d=%22M 1.178000,2.045000 0.637000,2.045000 0.637000,1.005000 0.797000,1.005000 0.797000,1.405000 1.178000,1.405000 1.357000,1.586000 1.357000,1.866000 z M 1.197000,1.645000 1.117000,1.565000 0.797000,1.565000 0.797000,1.885000 1.117000,1.885000 1.197000,1.805000 z%22 /><path class=%22layer_0_32767%22 d=%22M 2.221000,1.005000 2.221000,1.426000 2.042000,1.605000 1.741000,1.605000 1.741000,2.045000 1.581000,2.045000 1.581000,1.005000 1.741000,1.005000 1.741000,1.445000 1.981000,1.445000 2.061000,1.365000 2.061000,1.005000 z%22 /><path class=%22layer_0_32767%22 d=%22M 2.906000,1.725000 2.626000,1.725000 2.445000,1.546000 2.445000,1.186000 2.626000,1.005000 2.906000,1.005000 3.085000,1.186000 3.085000,1.546000 z M 2.925000,1.245000 2.845000,1.165000 2.685000,1.165000 2.605000,1.245000 2.605000,1.485000 2.685000,1.565000 2.845000,1.565000 2.925000,1.485000 z%22 /><path class=%22layer_0_32767%22 d=%22M 3.789000,1.165000 3.629000,1.165000 3.629000,1.645000 3.789000,1.645000 3.789000,1.805000 3.629000,1.805000 3.629000,2.045000 3.469000,2.045000 3.469000,1.805000 3.309000,1.805000 3.309000,1.645000 3.469000,1.645000 3.469000,1.125000 3.589000,1.005000 3.789000,1.005000 z%22 /><path class=%22layer_0_32767%22 d=%22M 4.474000,1.725000 4.194000,1.725000 4.013000,1.546000 4.013000,1.186000 4.194000,1.005000 4.474000,1.005000 4.653000,1.186000 4.653000,1.546000 z M 4.493000,1.245000 4.413000,1.165000 4.253000,1.165000 4.173000,1.245000 4.173000,1.485000 4.253000,1.565000 4.413000,1.565000 4.493000,1.485000 z%22 /><path class=%22layer_0_32767%22 d=%22M 5.357000,2.045000 5.357000,1.685000 5.058000,1.685000 4.877000,1.506000 4.877000,1.186000 5.058000,1.005000 5.517000,1.005000 5.517000,2.045000 z M 5.357000,1.165000 5.117000,1.165000 5.037000,1.245000 5.037000,1.445000 5.117000,1.525000 5.357000,1.525000 z%22 /><path class=%22layer_0_32767%22 d=%22M 5.741000,1.565000 5.741000,1.005000 5.901000,1.005000 5.901000,1.565000 z%22 /><path class=%22layer_0_32767%22 d=%22M 5.741000,1.885000 5.741000,1.725000 5.901000,1.725000 5.901000,1.885000 z%22 /><path class=%22layer_0_32767%22 d=%22M 6.586000,1.725000 6.306000,1.725000 6.125000,1.546000 6.125000,1.186000 6.306000,1.005000 6.586000,1.005000 6.765000,1.186000 6.765000,1.546000 z M 6.605000,1.245000 6.525000,1.165000 6.365000,1.165000 6.285000,1.245000 6.285000,1.485000 6.365000,1.565000 6.525000,1.565000 6.605000,1.485000 z%22 /><path class=%22layer_0_32767%22 d=%22M 7.469000,2.045000 7.469000,1.685000 7.170000,1.685000 6.989000,1.506000 6.989000,1.186000 7.170000,1.005000 7.629000,1.005000 7.629000,2.045000 z M 7.469000,1.165000 7.229000,1.165000 7.149000,1.245000 7.149000,1.445000 7.229000,1.525000 7.469000,1.525000 z%22 /><path class=%22layer_0_32767%22 d=%22M 8.373000,1.725000 7.973000,1.725000 7.853000,1.605000 7.853000,1.125000 7.973000,1.005000 8.453000,1.005000 8.453000,1.165000 8.013000,1.165000 8.013000,1.285000 8.373000,1.285000 8.493000,1.405000 8.493000,1.605000 z M 8.333000,1.445000 8.013000,1.445000 8.013000,1.565000 8.333000,1.565000 z%22 /></g><g id=%22C6%22 data-name=%22BBDirectionalCoupler%22><path class=%22layer_0_32767%22 d=%22M 0.000000,9.600000 0.000000,7.715000 0.000000,7.465000 0.000000,4.935000 0.000000,4.685000 0.000000,0.000000 11.120000,0.000000 11.120000,4.685000 11.120000,4.935000 11.120000,7.465000 11.120000,7.715000 11.120000,9.600000 z M 11.000000,7.715000 9.520000,7.715000 9.520000,8.000000 6.820000,8.000000 6.180000,7.350000 4.980000,7.350000 4.320000,8.000000 1.620000,8.000000 1.620000,7.715000 0.120000,7.715000 0.120000,9.480000 11.000000,9.480000 z M 11.000000,4.935000 9.520000,4.935000 9.520000,5.220000 7.180000,5.220000 6.520000,5.880000 4.620000,5.880000 3.980000,5.220000 1.600000,5.220000 1.600000,4.935000 0.120000,4.935000 0.120000,7.465000 1.620000,7.465000 1.620000,7.180000 3.980000,7.180000 4.620000,6.520000 6.520000,6.520000 7.180000,7.180000 9.520000,7.180000 9.520000,7.465000 11.000000,7.465000 z M 11.000000,0.120000 0.120000,0.120000 0.120000,4.685000 1.600000,4.685000 1.600000,4.420000 1.620000,4.400000 4.320000,4.400000 5.000000,5.080000 6.150000,5.080000 6.820000,4.400000 9.520000,4.400000 9.520000,4.685000 11.000000,4.685000 z%22 /><path class=%22layer_0_32767%22 d=%22M 1.612000,2.205000 1.132000,2.205000 1.132000,1.165000 1.612000,1.165000 1.812000,1.365000 1.812000,2.005000 z M 1.652000,1.445000 1.532000,1.325000 1.292000,1.325000 1.292000,2.045000 1.532000,2.045000 1.652000,1.925000 z%22 /><path class=%22layer_0_32767%22 d=%22M 2.036000,1.725000 2.036000,1.165000 2.196000,1.165000 2.196000,1.725000 z%22 /><path class=%22layer_0_32767%22 d=%22M 2.036000,2.045000 2.036000,1.885000 2.196000,1.885000 2.196000,2.045000 z%22 /><path class=%22layer_0_32767%22 d=%22M 3.060000,1.645000 3.060000,1.746000 2.921000,1.885000 2.641000,1.885000 2.580000,1.826000 2.521000,1.885000 2.420000,1.885000 2.420000,1.165000 2.580000,1.165000 2.580000,1.645000 2.660000,1.725000 2.820000,1.725000 2.900000,1.645000 z%22 /><path class=%22layer_0_32767%22 d=%22M 3.284000,1.325000 3.284000,1.165000 3.444000,1.165000 3.444000,1.325000 z%22 /><path class=%22layer_0_32767%22 d=%22M 5.204000,1.426000 5.065000,1.426000 4.964000,1.325000 4.804000,1.325000 4.724000,1.405000 4.724000,1.645000 4.804000,1.725000 4.964000,1.725000 5.065000,1.626000 5.204000,1.626000 5.204000,1.706000 5.025000,1.885000 4.745000,1.885000 4.564000,1.706000 4.564000,1.346000 4.745000,1.165000 5.025000,1.165000 5.204000,1.346000 z%22 /><path class=%22layer_0_32767%22 d=%22M 5.889000,1.885000 5.609000,1.885000 5.428000,1.706000 5.428000,1.346000 5.609000,1.165000 5.889000,1.165000 6.068000,1.346000 6.068000,1.706000 z M 5.908000,1.405000 5.828000,1.325000 5.668000,1.325000 5.588000,1.405000 5.588000,1.645000 5.668000,1.725000 5.828000,1.725000 5.908000,1.645000 z%22 /><path class=%22layer_0_32767%22 d=%22M 6.852000,1.165000 6.852000,1.885000 6.692000,1.885000 6.692000,1.405000 6.612000,1.325000 6.532000,1.325000 6.452000,1.405000 6.452000,1.885000 6.292000,1.885000 6.292000,1.346000 6.473000,1.165000 6.633000,1.165000 6.692000,1.226000 6.753000,1.165000 z%22 /><path class=%22layer_0_32767%22 d=%22M 7.537000,1.885000 7.076000,1.885000 7.076000,0.845000 7.236000,0.845000 7.236000,1.165000 7.537000,1.165000 7.716000,1.346000 7.716000,1.706000 z M 7.556000,1.405000 7.476000,1.325000 7.236000,1.325000 7.236000,1.725000 7.476000,1.725000 7.556000,1.645000 z%22 /><path class=%22layer_0_32767%22 d=%22M 8.260000,1.325000 8.100000,1.325000 8.100000,2.205000 7.940000,2.205000 7.940000,1.285000 8.060000,1.165000 8.260000,1.165000 z%22 /><path class=%22layer_0_32767%22 d=%22M 9.004000,1.885000 8.604000,1.885000 8.484000,1.765000 8.484000,1.285000 8.604000,1.165000 9.084000,1.165000 9.084000,1.325000 8.644000,1.325000 8.644000,1.445000 9.004000,1.445000 9.124000,1.565000 9.124000,1.765000 z M 8.964000,1.605000 8.644000,1.605000 8.644000,1.725000 8.964000,1.725000 z%22 /><path class=%22layer_0_32767%22 d=%22M 9.988000,1.645000 9.988000,1.746000 9.849000,1.885000 9.569000,1.885000 9.508000,1.826000 9.449000,1.885000 9.348000,1.885000 9.348000,1.165000 9.508000,1.165000 9.508000,1.645000 9.588000,1.725000 9.748000,1.725000 9.828000,1.645000 z%22 /></g><g id=%22C7%22 data-name=%22MSB%22><path class=%22layer_0_32767%22 d=%22M 0.000000,10.180000 0.000000,6.645000 0.000000,6.395000 0.000000,0.000000 40.000000,0.000000 40.000000,6.395000 40.000000,6.645000 40.000000,10.180000 z M 39.880000,6.645000 38.400000,6.645000 38.400000,7.180000 25.633000,7.180000 25.525000,7.200000 25.633000,7.400000 38.400000,7.400000 38.400000,8.580000 1.600000,8.580000 1.600000,7.400000 24.452000,7.400000 24.560000,7.380000 24.452000,7.180000 1.600000,7.180000 1.600000,6.645000 0.120000,6.645000 0.120000,10.060000 39.880000,10.060000 z M 25.901000,6.230000 25.633000,6.180000 25.096000,6.280000 24.560000,6.180000 24.292000,6.230000 24.292000,6.800000 24.560000,6.860000 25.096000,6.760000 25.633000,6.860000 25.901000,6.800000 z M 15.708000,8.280000 15.440000,8.230000 14.367000,8.230000 14.099000,8.280000 14.099000,8.430000 14.367000,8.480000 14.904000,8.380000 15.440000,8.480000 15.708000,8.430000 z M 25.901000,7.560000 25.633000,7.500000 25.096000,7.600000 24.560000,7.500000 24.292000,7.560000 24.292000,8.430000 24.560000,8.480000 25.096000,8.380000 25.633000,8.480000 25.901000,8.430000 z M 39.880000,0.120000 0.120000,0.120000 0.120000,6.395000 1.600000,6.395000 1.600000,5.860000 24.452000,5.860000 24.560000,5.830000 24.452000,5.630000 1.600000,5.630000 1.600000,4.400000 38.400000,4.400000 38.400000,5.630000 25.633000,5.630000 25.525000,5.660000 25.633000,5.860000 38.400000,5.860000 38.400000,6.395000 39.880000,6.395000 z M 25.901000,5.230000 25.633000,5.180000 24.560000,5.180000 24.292000,5.230000 24.292000,5.480000 24.560000,5.530000 25.096000,5.430000 25.633000,5.530000 25.901000,5.480000 z%22 /><path class=%22layer_0_32767%22 d=%22M 16.437000,2.045000 15.896000,2.045000 15.896000,1.005000 16.056000,1.005000 16.056000,1.405000 16.437000,1.405000 16.616000,1.586000 16.616000,1.866000 z M 16.456000,1.645000 16.376000,1.565000 16.056000,1.565000 16.056000,1.885000 16.376000,1.885000 16.456000,1.805000 z%22 /><path class=%22layer_0_32767%22 d=%22M 17.480000,1.005000 17.480000,1.426000 17.301000,1.605000 17.000000,1.605000 17.000000,2.045000 16.840000,2.045000 16.840000,1.005000 17.000000,1.005000 17.000000,1.445000 17.240000,1.445000 17.320000,1.365000 17.320000,1.005000 z%22 /><path class=%22layer_0_32767%22 d=%22M 18.264000,1.725000 17.784000,1.725000 17.704000,1.645000 17.704000,1.565000 18.184000,1.565000 18.184000,1.445000 17.824000,1.445000 17.704000,1.325000 17.704000,1.125000 17.824000,1.005000 18.344000,1.005000 18.344000,1.645000 z M 18.184000,1.165000 17.864000,1.165000 17.864000,1.285000 18.184000,1.285000 z%22 /><path class=%22layer_0_32767%22 d=%22M 18.648000,1.005000 19.088000,1.005000 19.208000,1.125000 19.208000,1.325000 19.088000,1.445000 18.728000,1.445000 18.728000,1.565000 19.208000,1.565000 19.208000,1.645000 19.128000,1.725000 18.648000,1.725000 18.568000,1.645000 18.568000,1.405000 18.688000,1.285000 19.048000,1.285000 19.048000,1.165000 18.568000,1.165000 18.568000,1.085000 z%22 /><path class=%22layer_0_32767%22 d=%22M 19.952000,1.725000 19.552000,1.725000 19.432000,1.605000 19.432000,1.125000 19.552000,1.005000 20.032000,1.005000 20.032000,1.165000 19.592000,1.165000 19.592000,1.285000 19.952000,1.285000 20.072000,1.405000 20.072000,1.605000 z M 19.912000,1.445000 19.592000,1.445000 19.592000,1.565000 19.912000,1.565000 z%22 /><path class=%22layer_0_32767%22 d=%22M 21.192000,1.725000 21.192000,1.005000 21.352000,1.005000 21.352000,1.485000 21.432000,1.565000 21.512000,1.485000 21.512000,1.005000 21.672000,1.005000 21.672000,1.485000 21.752000,1.565000 21.832000,1.485000 21.832000,1.005000 21.992000,1.005000 21.992000,1.546000 21.813000,1.725000 21.693000,1.725000 21.592000,1.626000 21.493000,1.725000 z%22 /><path class=%22layer_0_32767%22 d=%22M 22.677000,1.725000 22.397000,1.725000 22.216000,1.546000 22.216000,1.186000 22.397000,1.005000 22.677000,1.005000 22.856000,1.186000 22.856000,1.546000 z M 22.696000,1.245000 22.616000,1.165000 22.456000,1.165000 22.376000,1.245000 22.376000,1.485000 22.456000,1.565000 22.616000,1.565000 22.696000,1.485000 z%22 /><path class=%22layer_0_32767%22 d=%22M 23.560000,2.045000 23.560000,1.685000 23.261000,1.685000 23.080000,1.506000 23.080000,1.186000 23.261000,1.005000 23.720000,1.005000 23.720000,2.045000 z M 23.560000,1.165000 23.320000,1.165000 23.240000,1.245000 23.240000,1.445000 23.320000,1.525000 23.560000,1.525000 z%22 /><path class=%22layer_0_32767%22 d=%22M 23.944000,1.165000 23.944000,1.005000 24.104000,1.005000 24.104000,1.165000 z%22 /></g><g id=%22C8%22 data-name=%22LSB%22><path class=%22layer_0_32767%22 d=%22M 0.000000,10.180000 0.000000,6.645000 0.000000,6.395000 0.000000,0.000000 20.000000,0.000000 20.000000,6.395000 20.000000,6.645000 20.000000,10.180000 z M 19.880000,6.645000 18.400000,6.645000 18.400000,7.180000 12.571000,7.180000 12.522000,7.200000 12.571000,7.400000 18.400000,7.400000 18.400000,8.580000 1.600000,8.580000 1.600000,7.400000 12.033000,7.400000 12.082000,7.380000 12.033000,7.180000 1.600000,7.180000 1.600000,6.645000 0.120000,6.645000 0.120000,10.060000 19.880000,10.060000 z M 12.694000,6.230000 12.571000,6.180000 12.327000,6.280000 12.082000,6.180000 11.959000,6.230000 11.959000,6.800000 12.082000,6.860000 12.327000,6.760000 12.571000,6.860000 12.694000,6.800000 z M 8.041000,8.280000 7.918000,8.230000 7.429000,8.230000 7.306000,8.280000 7.306000,8.430000 7.429000,8.480000 7.673000,8.380000 7.918000,8.480000 8.041000,8.430000 z M 12.694000,7.560000 12.571000,7.500000 12.327000,7.600000 12.082000,7.500000 11.959000,7.560000 11.959000,8.430000 12.082000,8.480000 12.327000,8.380000 12.571000,8.480000 12.694000,8.430000 z M 19.880000,0.120000 0.120000,0.120000 0.120000,6.395000 1.600000,6.395000 1.600000,5.860000 12.033000,5.860000 12.082000,5.830000 12.033000,5.630000 1.600000,5.630000 1.600000,4.400000 18.400000,4.400000 18.400000,5.630000 12.571000,5.630000 12.522000,5.660000 12.571000,5.860000 18.400000,5.860000 18.400000,6.395000 19.880000,6.395000 z M 12.694000,5.230000 12.571000,5.180000 12.082000,5.180000 11.959000,5.230000 11.959000,5.480000 12.082000,5.530000 12.327000,5.430000 12.571000,5.530000 12.694000,5.480000 z%22 /><path class=%22layer_0_32767%22 d=%22M 6.437000,2.045000 5.896000,2.045000 5.896000,1.005000 6.056000,1.005000 6.056000,1.405000 6.437000,1.405000 6.616000,1.586000 6.616000,1.866000 z M 6.456000,1.645000 6.376000,1.565000 6.056000,1.565000 6.056000,1.885000 6.376000,1.885000 6.456000,1.805000 z%22 /><path class=%22layer_0_32767%22 d=%22M 7.480000,1.005000 7.480000,1.426000 7.301000,1.605000 7.000000,1.605000 7.000000,2.045000 6.840000,2.045000 6.840000,1.005000 7.000000,1.005000 7.000000,1.445000 7.240000,1.445000 7.320000,1.365000 7.320000,1.005000 z%22 /><path class=%22layer_0_32767%22 d=%22M 8.264000,1.725000 7.784000,1.725000 7.704000,1.645000 7.704000,1.565000 8.184000,1.565000 8.184000,1.445000 7.824000,1.445000 7.704000,1.325000 7.704000,1.125000 7.824000,1.005000 8.344000,1.005000 8.344000,1.645000 z M 8.184000,1.165000 7.864000,1.165000 7.864000,1.285000 8.184000,1.285000 z%22 /><path class=%22layer_0_32767%22 d=%22M 8.648000,1.005000 9.088000,1.005000 9.208000,1.125000 9.208000,1.325000 9.088000,1.445000 8.728000,1.445000 8.728000,1.565000 9.208000,1.565000 9.208000,1.645000 9.128000,1.725000 8.648000,1.725000 8.568000,1.645000 8.568000,1.405000 8.688000,1.285000 9.048000,1.285000 9.048000,1.165000 8.568000,1.165000 8.568000,1.085000 z%22 /><path class=%22layer_0_32767%22 d=%22M 9.952000,1.725000 9.552000,1.725000 9.432000,1.605000 9.432000,1.125000 9.552000,1.005000 10.032000,1.005000 10.032000,1.165000 9.592000,1.165000 9.592000,1.285000 9.952000,1.285000 10.072000,1.405000 10.072000,1.605000 z M 9.912000,1.445000 9.592000,1.445000 9.592000,1.565000 9.912000,1.565000 z%22 /><path class=%22layer_0_32767%22 d=%22M 11.192000,1.725000 11.192000,1.005000 11.352000,1.005000 11.352000,1.485000 11.432000,1.565000 11.512000,1.485000 11.512000,1.005000 11.672000,1.005000 11.672000,1.485000 11.752000,1.565000 11.832000,1.485000 11.832000,1.005000 11.992000,1.005000 11.992000,1.546000 11.813000,1.725000 11.693000,1.725000 11.592000,1.626000 11.493000,1.725000 z%22 /><path class=%22layer_0_32767%22 d=%22M 12.677000,1.725000 12.397000,1.725000 12.216000,1.546000 12.216000,1.186000 12.397000,1.005000 12.677000,1.005000 12.856000,1.186000 12.856000,1.546000 z M 12.696000,1.245000 12.616000,1.165000 12.456000,1.165000 12.376000,1.245000 12.376000,1.485000 12.456000,1.565000 12.616000,1.565000 12.696000,1.485000 z%22 /><path class=%22layer_0_32767%22 d=%22M 13.560000,2.045000 13.560000,1.685000 13.261000,1.685000 13.080000,1.506000 13.080000,1.186000 13.261000,1.005000 13.720000,1.005000 13.720000,2.045000 z M 13.560000,1.165000 13.320000,1.165000 13.240000,1.245000 13.240000,1.445000 13.320000,1.525000 13.560000,1.525000 z%22 /><path class=%22layer_0_32767%22 d=%22M 13.944000,1.165000 13.944000,1.005000 14.104000,1.005000 14.104000,1.165000 z%22 /></g><g id=%22C9%22 data-name=%22Analytic Waveguide%22><path class=%22layer_0_32767%22 d=%22M 0.000000,10.180000 0.000000,6.645000 0.000000,6.395000 0.000000,0.000000 15.398000,0.000000 15.398000,6.395000 15.398000,6.645000 15.398000,10.180000 z M 15.278000,6.645000 13.799000,6.645000 13.799000,7.180000 9.567000,7.180000 9.532000,7.200000 9.567000,7.400000 13.799000,7.400000 13.799000,8.580000 1.601000,8.580000 1.601000,7.400000 9.176000,7.400000 9.211000,7.380000 9.176000,7.180000 1.601000,7.180000 1.601000,6.645000 0.120000,6.645000 0.120000,10.060000 15.278000,10.060000 z M 9.656000,6.230000 9.567000,6.180000 9.389000,6.280000 9.211000,6.180000 9.123000,6.230000 9.123000,6.800000 9.211000,6.860000 9.389000,6.760000 9.567000,6.860000 9.656000,6.800000 z M 6.277000,8.280000 6.189000,8.230000 5.833000,8.230000 5.744000,8.280000 5.744000,8.430000 5.833000,8.480000 6.011000,8.380000 6.189000,8.480000 6.277000,8.430000 z M 9.656000,7.560000 9.567000,7.500000 9.389000,7.600000 9.211000,7.500000 9.123000,7.560000 9.123000,8.430000 9.211000,8.480000 9.389000,8.380000 9.567000,8.480000 9.656000,8.430000 z M 15.278000,0.120000 0.120000,0.120000 0.120000,6.395000 1.601000,6.395000 1.601000,5.860000 9.176000,5.860000 9.211000,5.830000 9.176000,5.630000 1.601000,5.630000 1.601000,4.400000 13.799000,4.400000 13.799000,5.630000 9.567000,5.630000 9.532000,5.660000 9.567000,5.860000 13.799000,5.860000 13.799000,6.395000 15.278000,6.395000 z M 9.656000,5.230000 9.567000,5.180000 9.211000,5.180000 9.123000,5.230000 9.123000,5.480000 9.211000,5.530000 9.389000,5.430000 9.567000,5.530000 9.656000,5.480000 z%22 /><path class=%22layer_0_32767%22 d=%22M 4.137000,2.045000 3.596000,2.045000 3.596000,1.005000 3.756000,1.005000 3.756000,1.405000 4.137000,1.405000 4.316000,1.586000 4.316000,1.866000 z M 4.156000,1.645000 4.076000,1.565000 3.756000,1.565000 3.756000,1.885000 4.076000,1.885000 4.156000,1.805000 z%22 /><path class=%22layer_0_32767%22 d=%22M 5.180000,1.005000 5.180000,1.426000 5.001000,1.605000 4.700000,1.605000 4.700000,2.045000 4.540000,2.045000 4.540000,1.005000 4.700000,1.005000 4.700000,1.445000 4.940000,1.445000 5.020000,1.365000 5.020000,1.005000 z%22 /><path class=%22layer_0_32767%22 d=%22M 5.964000,1.725000 5.484000,1.725000 5.404000,1.645000 5.404000,1.565000 5.884000,1.565000 5.884000,1.445000 5.524000,1.445000 5.404000,1.325000 5.404000,1.125000 5.524000,1.005000 6.044000,1.005000 6.044000,1.645000 z M 5.884000,1.165000 5.564000,1.165000 5.564000,1.285000 5.884000,1.285000 z%22 /><path class=%22layer_0_32767%22 d=%22M 6.348000,1.005000 6.788000,1.005000 6.908000,1.125000 6.908000,1.325000 6.788000,1.445000 6.428000,1.445000 6.428000,1.565000 6.908000,1.565000 6.908000,1.645000 6.828000,1.725000 6.348000,1.725000 6.268000,1.645000 6.268000,1.405000 6.388000,1.285000 6.748000,1.285000 6.748000,1.165000 6.268000,1.165000 6.268000,1.085000 z%22 /><path class=%22layer_0_32767%22 d=%22M 7.652000,1.725000 7.252000,1.725000 7.132000,1.605000 7.132000,1.125000 7.252000,1.005000 7.732000,1.005000 7.732000,1.165000 7.292000,1.165000 7.292000,1.285000 7.652000,1.285000 7.772000,1.405000 7.772000,1.605000 z M 7.612000,1.445000 7.292000,1.445000 7.292000,1.565000 7.612000,1.565000 z%22 /><path class=%22layer_0_32767%22 d=%22M 8.892000,1.725000 8.892000,1.005000 9.052000,1.005000 9.052000,1.485000 9.132000,1.565000 9.212000,1.485000 9.212000,1.005000 9.372000,1.005000 9.372000,1.485000 9.452000,1.565000 9.532000,1.485000 9.532000,1.005000 9.692000,1.005000 9.692000,1.546000 9.513000,1.725000 9.393000,1.725000 9.292000,1.626000 9.193000,1.725000 z%22 /><path class=%22layer_0_32767%22 d=%22M 10.377000,1.725000 10.097000,1.725000 9.916000,1.546000 9.916000,1.186000 10.097000,1.005000 10.377000,1.005000 10.556000,1.186000 10.556000,1.546000 z M 10.396000,1.245000 10.316000,1.165000 10.156000,1.165000 10.076000,1.245000 10.076000,1.485000 10.156000,1.565000 10.316000,1.565000 10.396000,1.485000 z%22 /><path class=%22layer_0_32767%22 d=%22M 11.260000,2.045000 11.260000,1.685000 10.961000,1.685000 10.780000,1.506000 10.780000,1.186000 10.961000,1.005000 11.420000,1.005000 11.420000,2.045000 z M 11.260000,1.165000 11.020000,1.165000 10.940000,1.245000 10.940000,1.445000 11.020000,1.525000 11.260000,1.525000 z%22 /><path class=%22layer_0_32767%22 d=%22M 11.644000,1.165000 11.644000,1.005000 11.804000,1.005000 11.804000,1.165000 z%22 /></g></defs><g transform=%22scale(1 -1)%22><g id=%22C0%22 data-name=%22Dual Segment MRM modulator%22><use transform=%22translate(10.000000 0.000000)%22 href=%22%23C1%22 /><use transform=%22translate(15.000000 5.000000)%22 href=%22%23C2%22 /><use transform=%22translate(30.000000 50.000000)%22 href=%22%23C3%22 /><use transform=%22translate(0.000000 0.000000) rotate(180.000000)%22 href=%22%23C4%22 /><use transform=%22translate(30.000000 0.000000)%22 href=%22%23C5%22 /><g transform=%22translate(34.560000 12.970000) rotate(-90.000000)%22><path class=%22port%22 d=%22M 0,-0.500000 V 0.500000%22 /><use href=%22%23port-symbol%22 /></g><text class=%22label%22 text-anchor=%22end%22 dominant-baseline=%22text-before-edge%22 x=%2234.560000%22 y=%22-12.970000%22>E0</text><g transform=%22translate(26.640000 11.250000)%22><use href=%22%23connection-symbol%22 /></g><g transform=%22translate(10.000000 5.000000)%22><use href=%22%23connection-symbol%22 /></g><path class=%22virtual-connection%22 d=%22M 26.640000,11.250000 C 29.602507,11.250000 10.000000,2.037493 10.000000,5.000000%22 /><g transform=%22translate(41.640000 56.250000)%22><use href=%22%23connection-symbol%22 /></g><g transform=%22translate(30.000000 45.000000)%22><use href=%22%23connection-symbol%22 /></g><path class=%22virtual-connection%22 d=%22M 41.640000,56.250000 C 44.338004,56.250000 30.000000,47.698004 30.000000,45.000000%22 /><g transform=%22translate(-10.500000 -6.200000)%22><use href=%22%23connection-symbol%22 /></g><g transform=%22translate(10.000000 4.810000)%22><use href=%22%23connection-symbol%22 /></g><path class=%22virtual-connection%22 d=%22M -10.500000,-6.200000 C -14.378252,-6.200000 6.121748,4.810000 10.000000,4.810000%22 /><g transform=%22translate(30.000000 7.580000)%22><use href=%22%23connection-symbol%22 /></g><g transform=%22translate(21.120000 4.810000)%22><use href=%22%23connection-symbol%22 /></g><path class=%22virtual-connection%22 d=%22M 30.000000,7.580000 C 28.449666,7.580000 22.670334,4.810000 21.120000,4.810000%22 /></g></g></svg>)
%22><rect x=%22-30.00%22 y=%22-30.00%22 width=%2260.00%22 height=%2260.00%22 fill=%22%23f4f5f7%22 stroke=%22%23232530%22 stroke-width=%221%22/><use href=%22%23g-mrm%22 transform=%22translate(-30.00 -30.00) scale(1.2)%22/><circle cx=%22-20.00%22 cy=%2230.00%22 r=%224%22 fill=%22%23f44e6a%22 stroke=%22%23f44e6a%22 stroke-width=%221%22/><circle cx=%22-0.00%22 cy=%2230.00%22 r=%224%22 fill=%22%2300643c%22 stroke=%22%2300643c%22 stroke-width=%221%22/><circle cx=%2220.00%22 cy=%2230.00%22 r=%224%22 fill=%22%2300643c%22 stroke=%22%2300643c%22 stroke-width=%221%22/><circle cx=%220.00%22 cy=%22-30.00%22 r=%224%22 fill=%22%23f44e6a%22 stroke=%22%23f44e6a%22 stroke-width=%221%22/></g><text x=%22192.00%22 y=%2235.80%22 font-size=%229%22 fill=%22%23232530%22 font-weight=%22400%22 text-anchor=%22middle%22 dominant-baseline=%22hanging%22 stroke=%22%23ffffff%22 stroke-width=%223.15%22 stroke-linejoin=%22round%22 paint-order=%22stroke%22>Microring_Modulator_1</text><g transform=%22matrix(1 -0 0 1 384.000 0.000)%22><rect x=%22-30.00%22 y=%22-30.00%22 width=%2260.00%22 height=%2260.00%22 fill=%22%23f4f5f7%22 stroke=%22%23232530%22 stroke-width=%221%22/><use href=%22%23g-source%22 transform=%22translate(-30.00 -30.00) scale(1.2)%22/><circle cx=%2230.00%22 cy=%220.00%22 r=%224%22 fill=%22%23f44e6a%22 stroke=%22%23f44e6a%22 stroke-width=%221%22/></g><text x=%22384.00%22 y=%2231.80%22 font-size=%229%22 fill=%22%23232530%22 font-weight=%22400%22 text-anchor=%22middle%22 dominant-baseline=%22hanging%22 stroke=%22%23ffffff%22 stroke-width=%223.15%22 stroke-linejoin=%22round%22 paint-order=%22stroke%22>Source_1</text><g transform=%22matrix(1 -0 0 1 384.000 -120.000)%22><rect x=%22-30.00%22 y=%22-30.00%22 width=%2260.00%22 height=%2260.00%22 fill=%22%23f4f5f7%22 stroke=%22%23232530%22 stroke-width=%221%22/><use href=%22%23g-source%22 transform=%22translate(-30.00 -30.00) scale(1.2)%22/><circle cx=%2230.00%22 cy=%220.00%22 r=%224%22 fill=%22%23f44e6a%22 stroke=%22%23f44e6a%22 stroke-width=%221%22/></g><text x=%22384.00%22 y=%22-88.20%22 font-size=%229%22 fill=%22%23232530%22 font-weight=%22400%22 text-anchor=%22middle%22 dominant-baseline=%22hanging%22 stroke=%22%23ffffff%22 stroke-width=%223.15%22 stroke-linejoin=%22round%22 paint-order=%22stroke%22>Source_2</text><g transform=%22matrix(-1 -1.22465e-16 1.22465e-16 -1 0.000 0.000)%22><rect x=%22-30.00%22 y=%22-30.00%22 width=%2260.00%22 height=%2260.00%22 fill=%22%23f4f5f7%22 stroke=%22%23232530%22 stroke-width=%221%22/><use href=%22%23g-cw_laser%22 transform=%22translate(-30.00 -30.00) scale(1.2)%22/><circle cx=%2230.00%22 cy=%220.00%22 r=%224%22 fill=%22%2300643c%22 stroke=%22%2300643c%22 stroke-width=%221%22/></g><text x=%220.00%22 y=%2231.80%22 font-size=%229%22 fill=%22%23232530%22 font-weight=%22400%22 text-anchor=%22middle%22 dominant-baseline=%22hanging%22 stroke=%22%23ffffff%22 stroke-width=%223.15%22 stroke-linejoin=%22round%22 paint-order=%22stroke%22>CW_Laser_1</text><g transform=%22matrix(1 -0 0 1 384.000 120.000)%22><rect x=%22-30.00%22 y=%22-30.00%22 width=%2260.00%22 height=%2260.00%22 fill=%22%23f4f5f7%22 stroke=%22%23232530%22 stroke-width=%221%22/><use href=%22%23g-photodiode%22 transform=%22translate(-30.00 -30.00) scale(1.2)%22/><circle cx=%22-30.00%22 cy=%220.00%22 r=%224%22 fill=%22%2300643c%22 stroke=%22%2300643c%22 stroke-width=%221%22/><circle cx=%220.00%22 cy=%22-30.00%22 r=%224%22 fill=%22%23f44e6a%22 stroke=%22%23f44e6a%22 stroke-width=%221%22/></g><text x=%22384.00%22 y=%22151.80%22 font-size=%229%22 fill=%22%23232530%22 font-weight=%22400%22 text-anchor=%22middle%22 dominant-baseline=%22hanging%22 stroke=%22%23ffffff%22 stroke-width=%223.15%22 stroke-linejoin=%22round%22 paint-order=%22stroke%22>Photodiode_1</text><text x=%22384.00%22 y=%2278.00%22 font-size=%2210%22 fill=%22%23b8461c%22 font-weight=%22700%22 text-anchor=%22middle%22 dominant-baseline=%22auto%22 stroke=%22%23ffffff%22 stroke-width=%223.50%22 stroke-linejoin=%22round%22 paint-order=%22stroke%22>E0</text><g fill=%22none%22 stroke-width=%222%22></g></svg>)
Time-Domain Simulation of the Dual-Segment Microring Modulator
Section titled “Time-Domain Simulation of the Dual-Segment Microring Modulator”In this section, we run a time-domain simulation of the assembled dual-segment MRM testbench and observe the recovered electrical waveform at the detector output.
We define a discrete time grid with samples spaced by time_step. The circuit time stepper is set up with carrier_frequency=f_laser so that the rapidly rotating optical envelope at the laser frequency is handled internally by the simulator; this lets the time step be sized only by the RF modulation bandwidth rather than by the absolute optical frequency. Because and are already supplied as frequency-dependent Interpolator objects, the waveguide and phase-modulator models automatically evaluate them at the chosen carrier — no manual dispersion correction is required.
We also provide a frequency grid for the time stepper that spans a wide band around the carrier (here ) to capture modulation-induced sidebands. After resetting the time stepper state, we step the simulation forward, extract the detector electrical output, and use time-stepper monitors to directly read the source-port electrical wave amplitudes. We then plot both the input drive signals and the recovered electrical waveform over a short time window for inspection.
# Time-domain simulation parameters and time vectortime_step = 0.01 / f_mN_steps = 100000t = time_step * np.arange(N_steps)
# Resolve subcomponent references for monitor placementrefs = msb_modulator.referencesvs_msb_ref = refs[1]vs_lsb_ref = refs[2]
# Configure time-stepper with monitors on electrical source portsts = msb_modulator.setup_time_stepper(    time_step=time_step,    carrier_frequency=f_laser,    time_stepper_kwargs={        "frequencies": np.linspace(freq0 - 200 * f_m, freq0 + 200 * f_m, 100),        "monitors": {            "msb_src": vs_msb_ref["E0"],            "lsb_src": vs_lsb_ref["E0"],        },    },)
# Reset internal states before steppingts.reset()
# Run the time-domain simulationoutputs = ts.step(steps=N_steps, time_step=time_step)
# Extract detector electrical output waveformoutput_signal = outputs["E0@0"]msb_src_wave = outputs["msb_src@0+"]lsb_src_wave = outputs["lsb_src@0+"]
# Convert monitored wave amplitudes to equivalent voltage at 50 Ohm for readabilityv_msb_phys = np.real(msb_src_wave) * np.sqrt(Z0)v_lsb_phys = np.real(lsb_src_wave) * np.sqrt(Z0)
# Plot input drive and detector output over a short time windowwin = slice(1000, 4000)fig, (ax1, ax2) = plt.subplots(2, 1, figsize=(10, 5), sharex=True)ax1.plot(t[win] * 1e9, v_msb_phys[win], label=f"MSB source", color="C0")ax1.plot(t[win] * 1e9, v_lsb_phys[win], label=f"LSB source", color="C1")ax1.set_ylabel("Input voltage (V)")ax1.set_title("Electrical drive signals from time-stepper monitors")ax1.legend(loc="upper right")ax1.grid(True, alpha=0.3)
ax2.plot(t[win] * 1e9, np.real(output_signal[win]), label="Detector output (real)")ax2.set_xlabel("Time (ns)")ax2.set_ylabel("Amplitude")ax2.set_title("Recovered electrical waveform at detector output")ax2.legend(loc="upper right")ax2.grid(True, alpha=0.3)
fig.suptitle("Time-domain simulation: monitored input drive and output signal", y=1.02)plt.tight_layout()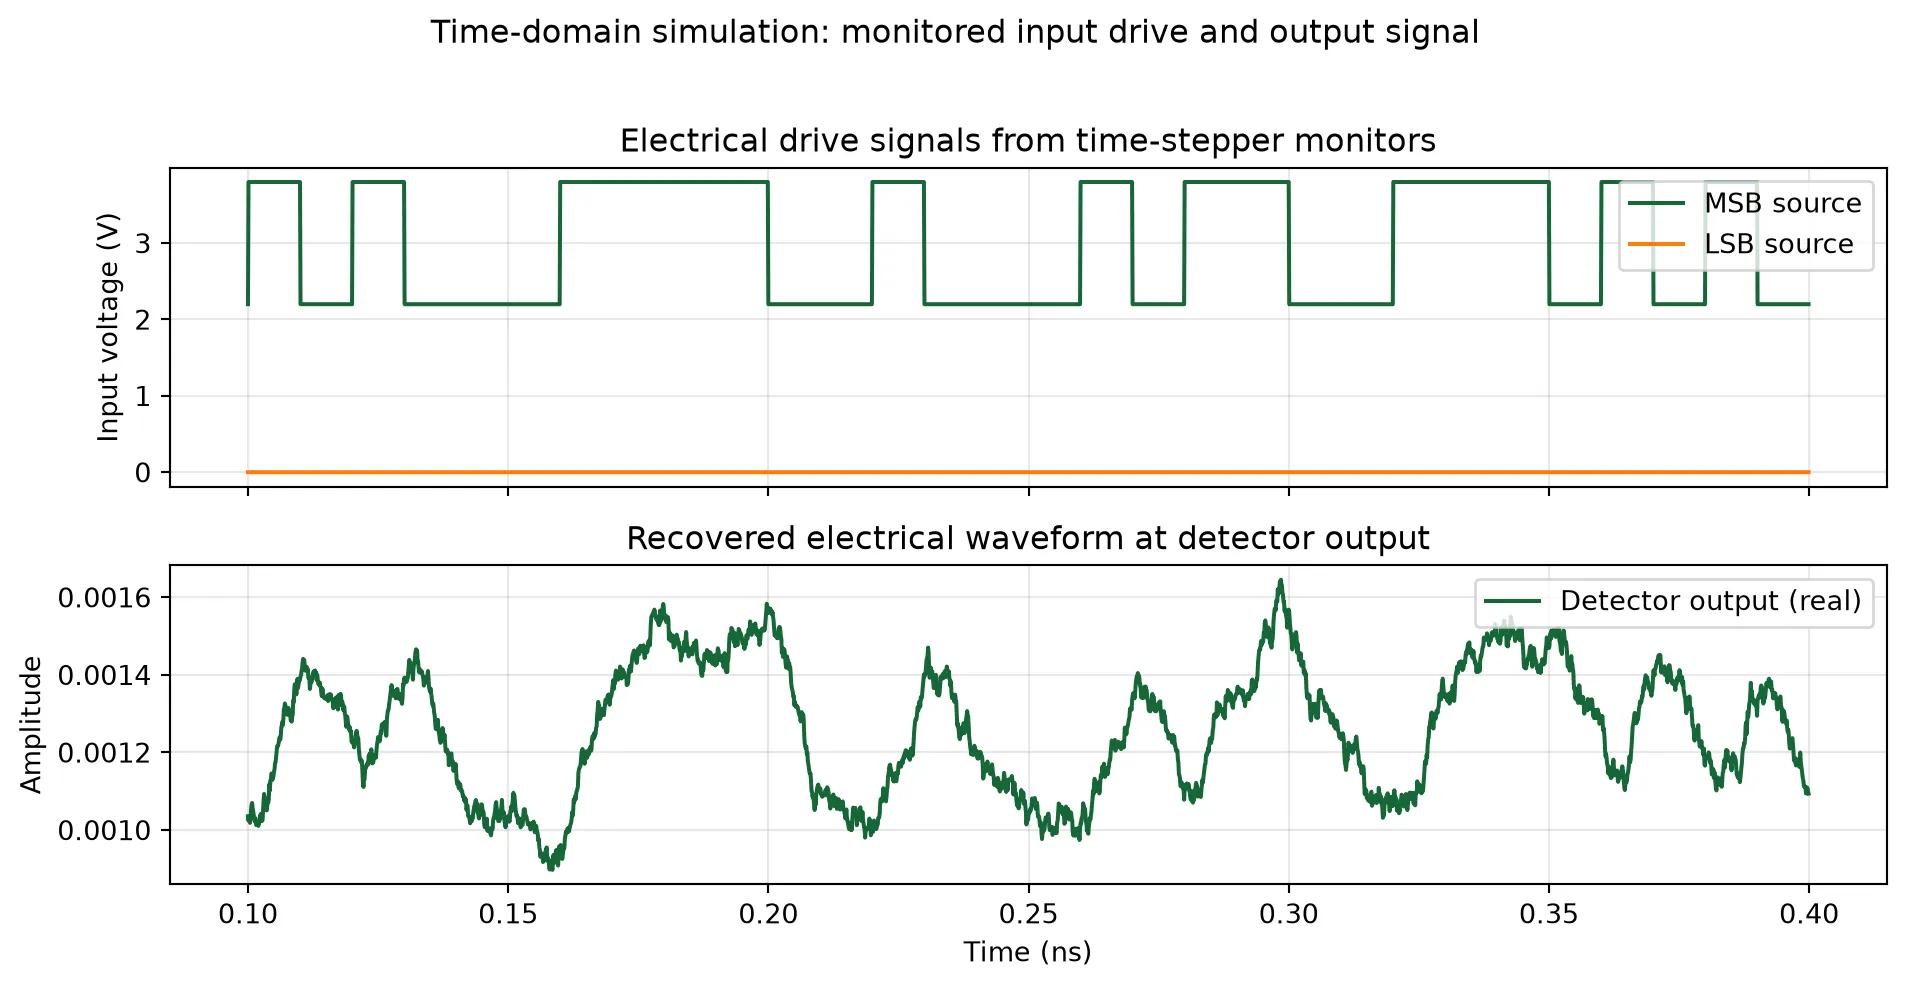
Finally, we generate an eye diagram from the recovered detector waveform to evaluate signal integrity at the target symbol rate.
The following function slices the waveform into consecutive 2T windows (with 1T shift) and overlays them on a common time axis to form the eye. We then call it with the detector output, bit rate, and time step from the simulation.
def plot_eye_diagram(optical_output_signal, bit_rate, time_step):    """    Plot a 2T eye diagram by slicing a uniformly sampled waveform into    consecutive 1T-shifted windows and overlaying them on a common time axis.    """    # Compute sampling frequency from the time step    Fs = 1 / time_step  # sampling frequency    samples_per_bit = int(0.5 + Fs / bit_rate)
    # Calculate window parameters    samples_per_window = 2 * samples_per_bit  # 2T window    start_index = samples_per_window  # Skip initial transients
    # Calculate number of windows    num_windows = (        len(optical_output_signal)        - start_index        - (samples_per_window - samples_per_bit)    ) // samples_per_bit    if num_windows <= 0:        raise ValueError("Output signal is too short to generate eye diagram.")
    # Extract signal segments for the eye diagram    parts = []    for k in range(num_windows):        idx_start = start_index + k * samples_per_bit        idx_end = idx_start + samples_per_window        part = optical_output_signal[idx_start:idx_end]        parts.append(part)
    parts = np.array(parts).T  # Transpose for time on x-axis
    # Time vector for plotting (centered around 0, in nanoseconds)    t = (np.arange(samples_per_window) - samples_per_bit) * time_step * 1e12
    # Plotting    fig, ax = plt.subplots(1, 1, tight_layout=True)    ax.plot(t, parts, color="yellow", alpha=0.1)    ax.set(        xlabel="Time (ps)",        ylabel="Detector output amplitude",        facecolor="k",        xlim=(t[0], t[-1]),    )    ax.set_title("Eye diagram (2T window, detector output)")    ax.grid(ls=":")
plot_eye_diagram(np.real(output_signal), f_m, time_step)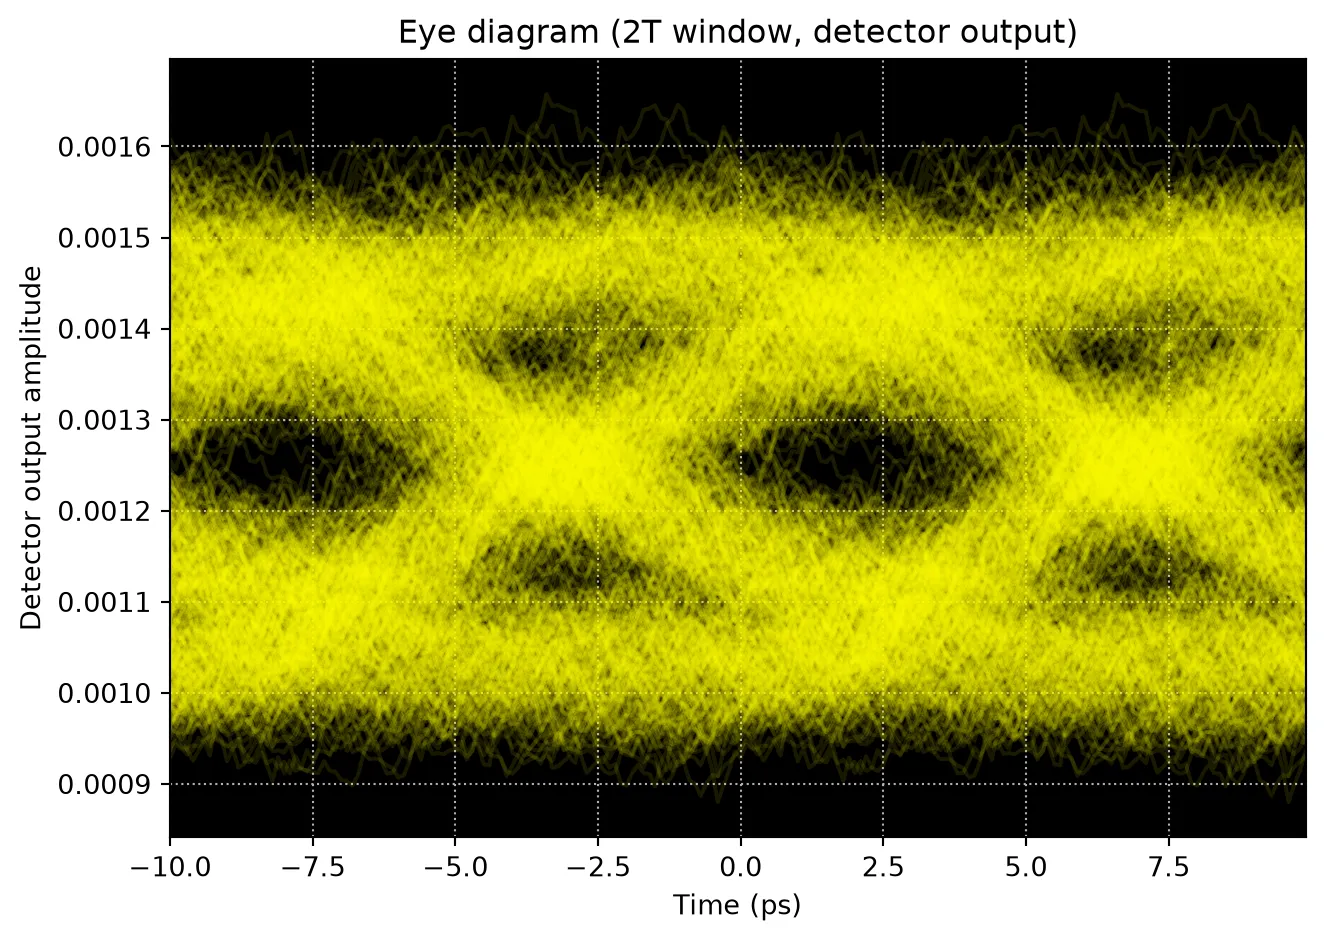
Summary and conclusion
Section titled “Summary and conclusion”This notebook demonstrated a compact modeling workflow for a two-segment silicon microring modulator:
-
Waveguide and coupler: We used an analytical waveguide model and replaced the full-wave directional coupler S-matrix with a compact DirectionalCouplerModel to gain speed and to add loss and modulation in a controlled way later.
-
Microring assembly: We built the MRM from passive and active segments using AnalyticWaveguideModel with PhaseModTimeStepper for electro-optic phase modulation, and validated resonance and voltage tuning in the frequency domain.
-
Time-domain testbench: We assembled a netlist with electrical drive sources (
pfa.signal_source), apfa.cw_laserfor the optical input, and apfa.photodiodefor the receiver, then ran a time-domain simulation and plotted both the input voltage and the recovered electrical output. The eye diagram illustrated signal integrity at the target symbol rate.
PhotonForge APIs used
Section titled “PhotonForge APIs used”| API | Purpose |
|---|---|
AnalyticWaveguideModel | Passive and active waveguide segments with , , loss, , RC bandwidth |
DirectionalCouplerModel | Compact bus–ring coupling (replacing full-wave S-matrix) |
PhaseModTimeStepper | Voltage-dependent phase and loss in time domain |
pfa.signal_source | PRBS trapezoid electrical drive |
pfa.cw_laser | CW optical source |
pfa.photodiode | Optical-to-electrical conversion with bandwidth and noise |
component_from_netlist | Assembly of composite circuit from instances and connections |