

Integrator
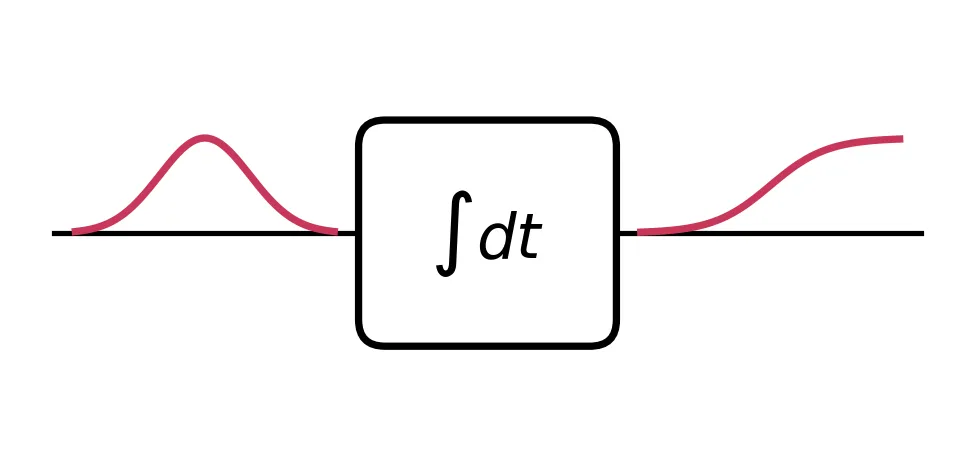
Accumulation is as fundamental as differentiation: a photodiode current integrated over a gate is a collected charge, the I term of a PID controller accumulates the error history, and a ramp generator is nothing but an integrator with a reset. The abstract integrator provides the running integral of an electrical signal, based on the IntegralTimeStepper:
with the scaling factor given in , so the output is and a scale near the inverse of the signal time scale keeps the output amplitude comparable to the input. Around this accumulator the stepper offers the machinery of a practical integrator:
limitsclamp the output between a lower and an upper rail,- port
E1is an edge-triggered reset that returns the output tostart_value, withreset_triggerselecting rising, falling, or both edges andreset_tolerancesetting the minimum step that counts as an edge, - the input is
E0and the output isE2.
This guide integrates a pulse, builds a sawtooth generator from the reset feature, and closes with a pulse energy meter combining optical and electrical components.
import matplotlib.pyplot as pltimport numpy as npfrom scipy.special import erfimport photonforge as pfimport photonforge.abstract as pfa
viewer = pf.live_viewer.LiveViewer()
LiveViewer started at http://127.0.0.1:34319. Call its 'stop()' method to free the port.tech = pf.basic_technology()pf.config.default_technology = tech
f0 = pf.C_0 / 1.55time_step = 1e-12z0 = 50.0 # impedance of the virtual electrical portsIntegrating a Pulse
Section titled “Integrating a Pulse”The running integral of a Gaussian pulse is the error-function step, plotted below for reference:
That choice of scale makes the plateau equal to the pulse peak: the output settles at times the pulse area. The pulse is injected directly at E0 and the integral read at E2.
sigma = 20e-12  # pulse width (s)v_pk = 1.0  # pulse peak (V)t0 = 100e-12
num_steps = 400t = np.arange(num_steps) * time_steppulse = v_pk / np.sqrt(z0) * np.exp(-((t - t0) ** 2) / (2 * sigma**2))
# Scale 1 / (sqrt(2 pi) sigma) makes the output plateau at the pulse peak valueintegrator = pfa.integrator(scale=1 / (np.sqrt(2 * np.pi) * sigma))time_stepper = integrator.setup_time_stepper(    time_step=time_step, carrier_frequency=f0, show_progress=False)out = time_stepper.step(    inputs=pf.TimeSeries({"E0@0": pulse}, time_step), show_progress=False)integral = np.real(out["E2@0"]) * np.sqrt(z0)
analytic = v_pk / 2 * (1 + erf((t - t0) / (np.sqrt(2) * sigma)))
fig, ax = plt.subplots(figsize=(7, 3), tight_layout=True)ax.plot(t * 1e12, pulse * np.sqrt(z0), label="Input pulse")ax.plot(t * 1e12, integral, label="Simulated $s \\int V \\, dt$")ax.plot(t * 1e12, analytic, "k:", label="Analytic integral")ax.set(xlabel="Time (ps)", ylabel="Voltage (V)")_ = ax.legend(fontsize=8)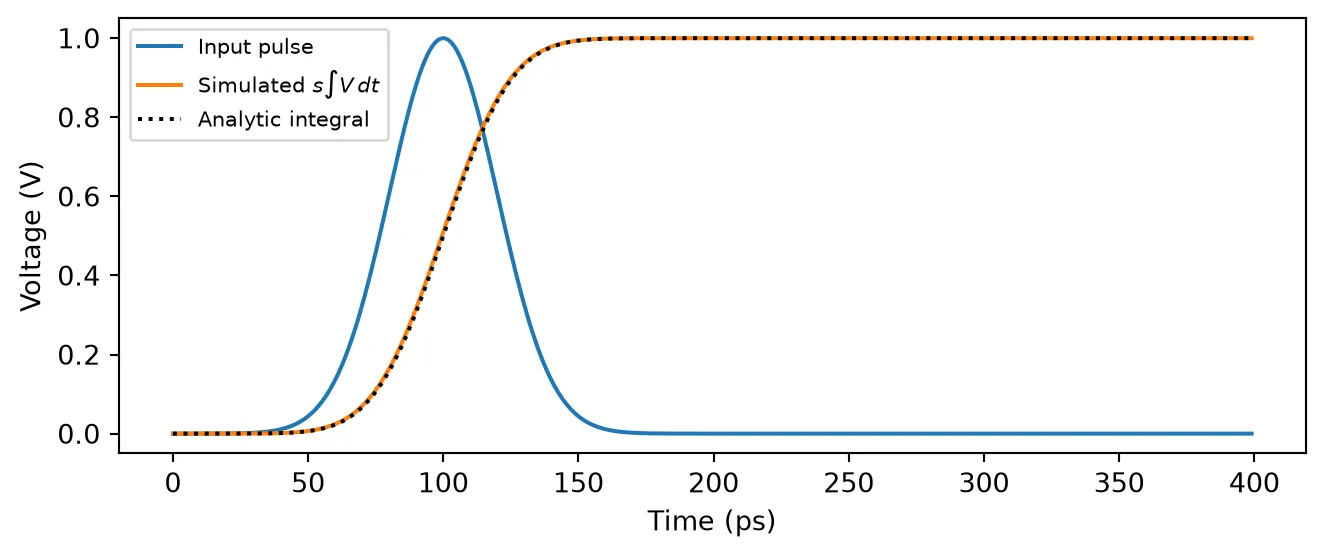
Reset and Limits
Section titled “Reset and Limits”A constant input turns the integrator into a ramp generator, and the two remaining features shape that ramp. Feeding narrow ticks to the reset port E1 restarts the ramp on every rising edge, producing the classic sawtooth of a function generator. Setting limits instead clamps the accumulation at a rail, like a capacitor charged against a supply: the ramp flattens when it reaches the limit and resumes only if the input changes sign.
num_steps = 1000t = np.arange(num_steps) * time_stepdrive = 0.5 / np.sqrt(z0) * np.ones(num_steps)  # constant 0.5 V input
# Sawtooth: narrow 1 V reset ticks every 200 ps restart the ramp on their rising edgesreset_ticks = 1.0 / np.sqrt(z0) * ((t % 200e-12) < 2e-12)sawtooth_generator = pfa.integrator(scale=1 / 100e-12)time_stepper = sawtooth_generator.setup_time_stepper(    time_step=time_step, carrier_frequency=f0, show_progress=False)out = time_stepper.step(    inputs=pf.TimeSeries({"E0@0": drive, "E1@0": reset_ticks}, time_step),    show_progress=False,)sawtooth = np.real(out["E2@0"]) * np.sqrt(z0)
# Clamped ramp: same drive, no resets, output limited to 0.8 Vclamped_integrator = pfa.integrator(scale=1 / 100e-12, limits=(0, 0.8 / np.sqrt(z0)))time_stepper = clamped_integrator.setup_time_stepper(    time_step=time_step, carrier_frequency=f0, show_progress=False)out = time_stepper.step(    inputs=pf.TimeSeries({"E0@0": drive}, time_step), show_progress=False)clamped = np.real(out["E2@0"]) * np.sqrt(z0)
fig, (ax1, ax2) = plt.subplots(2, 1, figsize=(7, 4), sharex=True, tight_layout=True)ax1.plot(t * 1e12, sawtooth, label="Output")ax1.plot(t * 1e12, reset_ticks * np.sqrt(z0), color="tab:gray", linewidth=1, label="Reset ticks")ax1.set(ylabel="Sawtooth (V)")ax1.legend(fontsize=8, loc="upper right")ax2.plot(t * 1e12, clamped, color="tab:orange")ax2.axhline(0.8, color="black", linestyle=":", linewidth=1)ax2.text(10, 0.83, "limit", fontsize=8)_ = ax2.set(xlabel="Time (ps)", ylabel="Clamped ramp (V)")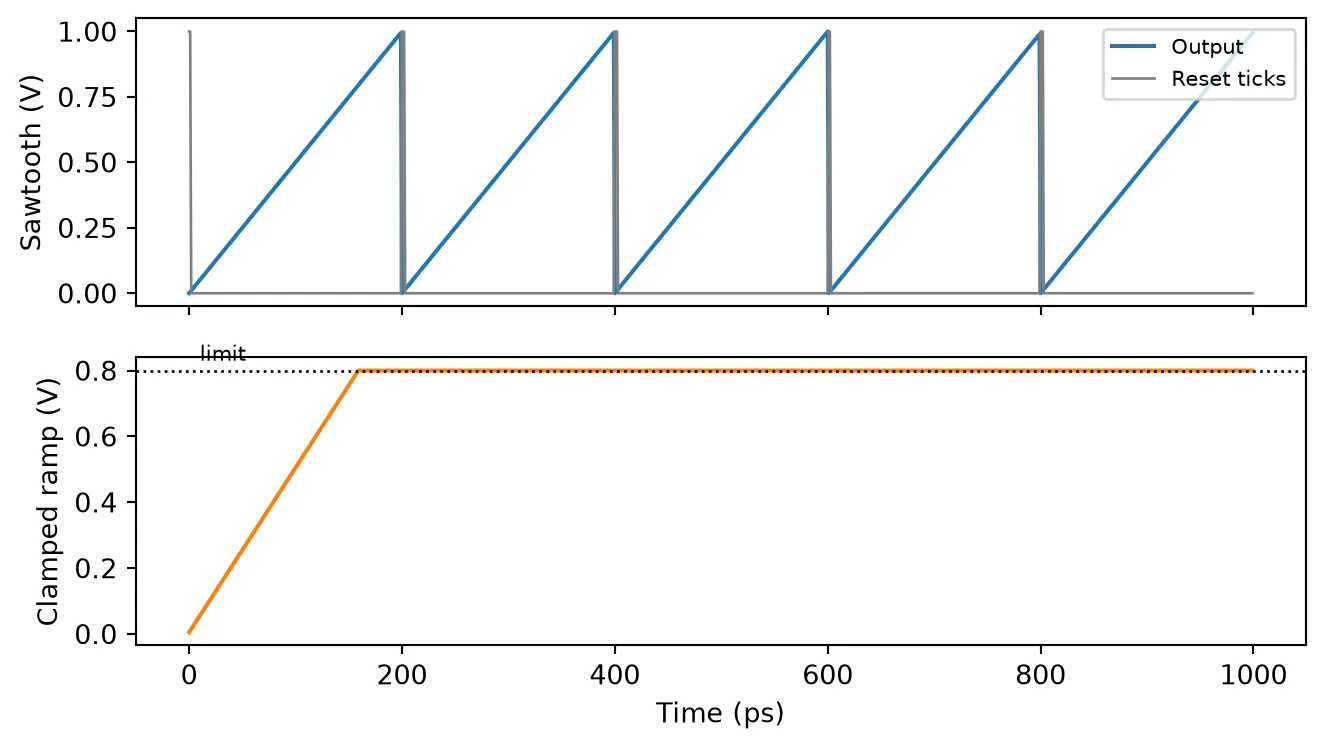
Application: a Pulse Energy Meter
Section titled “Application: a Pulse Energy Meter”Integrating a detected photocurrent measures the energy of an optical pulse, the working principle of gated energy monitors. An optical_pulse with a known energy of 2 pJ illuminates a photodiode whose output voltage is with responsivity A/W and transimpedance gain V/A. Choosing the integrator scale as
calibrates the meter to 1 V of output per picojoule of detected energy, so the reading should settle at 2 V. The reset port is exposed as a circuit port, ready to gate consecutive measurements (and its zero drive sets the duration of the run).
responsivity = 1.0  # photodiode responsivity (A/W)gain = 1.0  # transimpedance gain (V/A)
pulse_source = pfa.optical_pulse(energy=2e-12, width=50e-12)photodiode = pfa.photodiode(responsivity=responsivity, gain=gain)# Calibration: 1 V of integrator output per pJ of detected optical energymeter = pfa.integrator(scale=1 / (gain * responsivity * 1e-12))
energy_meter = pf.Component("energy_meter")pulse_ref = energy_meter.add_reference(pulse_source)photodiode_ref = energy_meter.add_reference(photodiode)meter_ref = energy_meter.add_reference(meter)photodiode_ref.connect("P0", pulse_ref["P0"])meter_ref.connect("E0", photodiode_ref["E0"])energy_meter.add_port(meter_ref["E2"], "energy")energy_meter.add_port(meter_ref["E1"], "reset")energy_meter.add_model(pf.CircuitModel(), "Circuit")
num_steps = 600t = np.arange(num_steps) * time_steptime_stepper = energy_meter.setup_time_stepper(    time_step=time_step, carrier_frequency=f0, show_progress=False)out = time_stepper.step(    inputs=pf.TimeSeries({"reset@0": np.zeros(num_steps)}, time_step),    show_progress=False,)reading = np.real(out["energy@0"]) * np.sqrt(z0)
fig, ax = plt.subplots(figsize=(7, 3), tight_layout=True)ax.plot(t * 1e12, reading)ax.axhline(2.0, color="black", linestyle=":", linewidth=1)ax.text(10, 2.04, "2 pJ pulse", fontsize=8)ax.set(xlabel="Time (ps)", ylabel="Meter reading (V, 1 V/pJ)")_ = ax.set_ylim(-0.1, 2.3)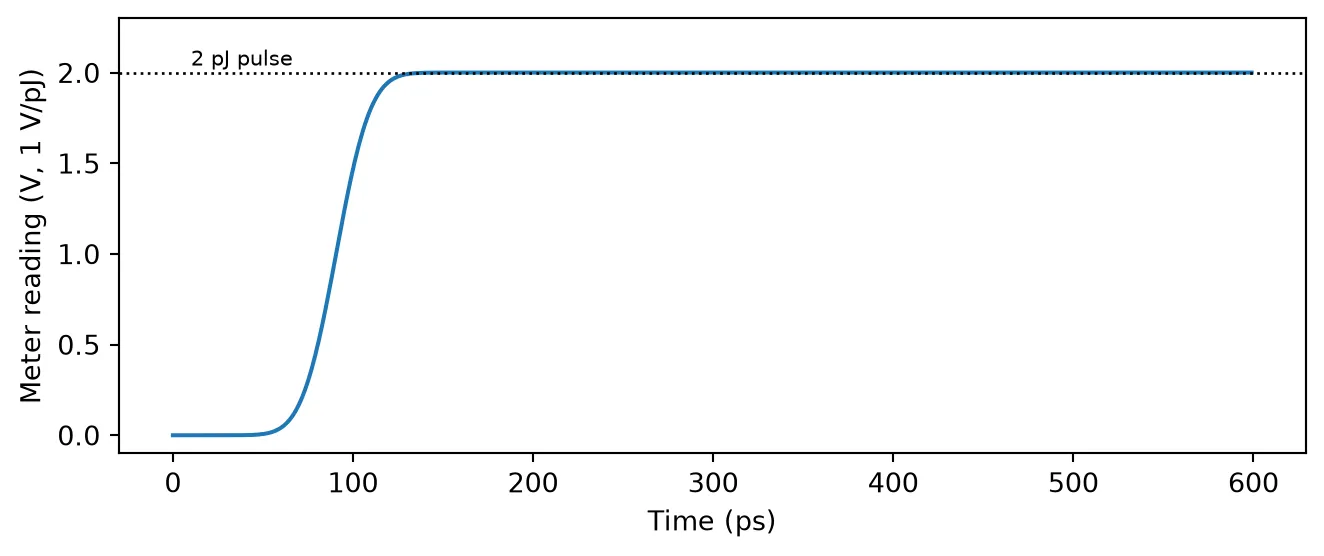
Summary
Section titled “Summary”pfa.integratoraccumulates : the running integral of the signal atE0appears atE2, with the scale in .- The output settles at times the pulse area for pulsed inputs, and ramps with slope for constant inputs.
- Rising (or falling, or both, per
reset_trigger) edges at portE1reset the output tostart_value; a constant drive plus periodic reset ticks is a sawtooth generator. limitsclamp the output between two rails, modeling saturation of the accumulation.- Integrating a photodiode output measures optical pulse energy directly, with the scale providing the calibration.
- The differentiator provides the inverse operation, and the ExpressionTimeStepper covers memoryless custom math.