Bandstructure Analysis of 1D Periodic Waveguides
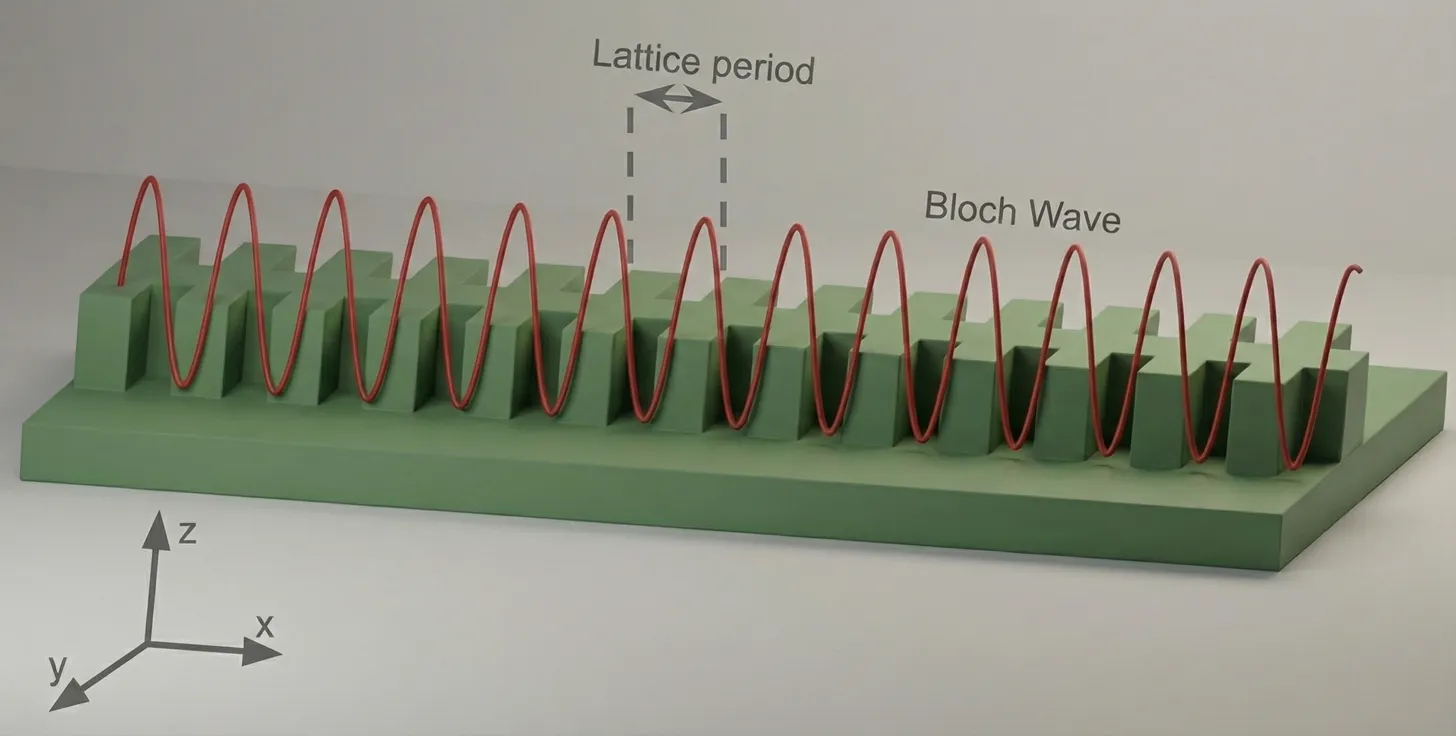
In this notebook, we study one-dimensional periodic waveguides and coupled-resonator optical waveguides (CROWs), which can be used as building blocks for high-speed silicon photonic modulators and filters. Periodic corrugations and resonant chains are commonly employed to engineer dispersion, create slow-light regions, and enhance light–matter interaction—key mechanisms for reducing device length and drive voltage in practical electro-optic modulators.
Accurately analyzing the bandstructure of these devices using brute-force full-wave methods such as FDTD can be computationally expensive, especially when sweeping geometric parameters or constructing large supercells. To address this, we use an equivalent circuit model combined with S-parameter retrieval to efficiently extract the complex bandstructure of periodic photonic structures. Despite its approximate effective-medium nature, this approach has been shown to agree remarkably well with rigorous electromagnetic simulations, while offering orders-of-magnitude improvements in speed and flexibility.
We first apply this framework to a one-dimensional periodic waveguide to compute dispersion relations and validate the results against full-wave simulations and published data. We then extend the same circuit-based methodology to analyze a CROW, where each resonator is modeled as a circuit element within a periodic chain. This allows us to efficiently extract the CROW bandstructure, group velocity, and slow-light behavior in a form that is directly relevant for modulator and integrated-photonics design.
References
- Han, Changhao, et al. “Slow-light silicon modulator with 110-GHz bandwidth.” Science Advances 9 (42), eadi5339 (2023). doi: 10.1126/sciadv.adi5339.
- Pozar, David M. “Microwave engineering.” Fourth Editions, University of Massachusetts at Amherst, John Wiley & Sons, Inc (2012).
import matplotlib.pyplot as pltimport numpy as npimport photonforge as pfimport siepic_forge as siepicimport tidy3d as tdfrom photonforge.live_viewer import LiveViewer
viewer = LiveViewer()td.config.logging.level = "ERROR"
LiveViewer started at http://127.0.0.1:39061. Call its 'stop()' method to free the port.Geometric and Simulation Parameters
Section titled “Geometric and Simulation Parameters”In this section, we define the geometric and simulation parameters for the one-dimensional periodic waveguide structure. The core geometry is based on the dimensions reported in [1] (the tooth_length is guessed because it is not mentioned in the paper text).
Then, we define the wavelength range of interest and convert it to the corresponding frequency range using . This spectral window will be used to compute and visualize the bandstructure and the response of the periodic waveguide and CROW.
# Geometric parameters taken from the reference structurewg_thickness = 0.220  # Silicon thicknessslab_thickness = 0.09  # Slab thicknessbox_thickness = 2.0  # Buried oxide thicknesscore_width = 0.455  # Central spine widthcorrugation_depth = 0.190
# Derived tooth width from core width and corrugation depthtooth_width = core_width + 2 * corrugation_depth
# Longitudinal periodicity and defect-related dimensionsa_lattice = 0.300tooth_length = 0.1  # Not mentioned explicitly in the paper textdefect_length = 0.25
# Discretization of the structure in terms of supercells and grating periodsNr = 10  # Number of CROW supercellsNp = 20  # Number of grating periods
# Wavelength range of interest for the bandstructure calculationwavelengths = np.linspace(1.5, 1.6, 201)freqs = td.C_0 / wavelengths
Technology and Port Specification
Section titled “Technology and Port Specification”Here we set up the technology stack and define the port specification needed for the Tidy3D simulation. We instantiate the SiEPIC platform with the specified slab and buried oxide thicknesses and assign it as the default technology. This defines the material and layer environment for all subsequent components.
Next, we define a rib-waveguide port specification. This rib port will be used when creating ports throughout the notebook.
# Define the SiEPIC technology using slab and oxide thicknessestech = siepic.ebeam(    si_slab_thickness=slab_thickness,    bottom_oxide_thickness=box_thickness,)
# Assign this platform as the default technologypf.config.default_technology = tech
# Port specification for rib waveguiderib_spec = pf.PortSpec(    description="Rib",    width=2.5,    limits=(-1, 1 + wg_thickness),    target_neff=3.5,    path_profiles=(        (core_width, 0.0, tech.layers["Si"].layer),        (3.0, 0.0, tech.layers["Si Slab"].layer),    ),)
Mode Profile and Effective Index Extraction
Section titled “Mode Profile and Effective Index Extraction”To verify the port specification and establish the baseline modal properties, we inspect the optical mode profile of the rib waveguide. We select the frequency at the center of our wavelength range and run a mode solver using the previously defined port specification. We then visualize the electric-field distribution of the fundamental mode and extract its effective index. This value will later serve as an input parameter to the circuit-based bandstructure model.
# Select the central frequency from the defined spectral rangefreq0 = freqs[len(freqs) // 2]
# Run a mode solver for the rib port at the chosen frequencymode_solver = pf.port_modes(rib_spec, [freq0])
# Plot the electric field profile of the fundamental modemode_solver.plot_field("E", mode_index=0, f=freq0)
# Extract the effective index of the fundamental moden_eff = mode_solver.data.n_eff.isel(mode_index=0).item()
Uploading task 'Mode-ModeSolver…'Starting task 'Mode-ModeSolver': https://tidy3d.simulation.cloud/workbench?taskId=mo-28e37a57-dc16-4489-9456-ba8ab3c178acDownloading data from 'Mode-ModeSolver'…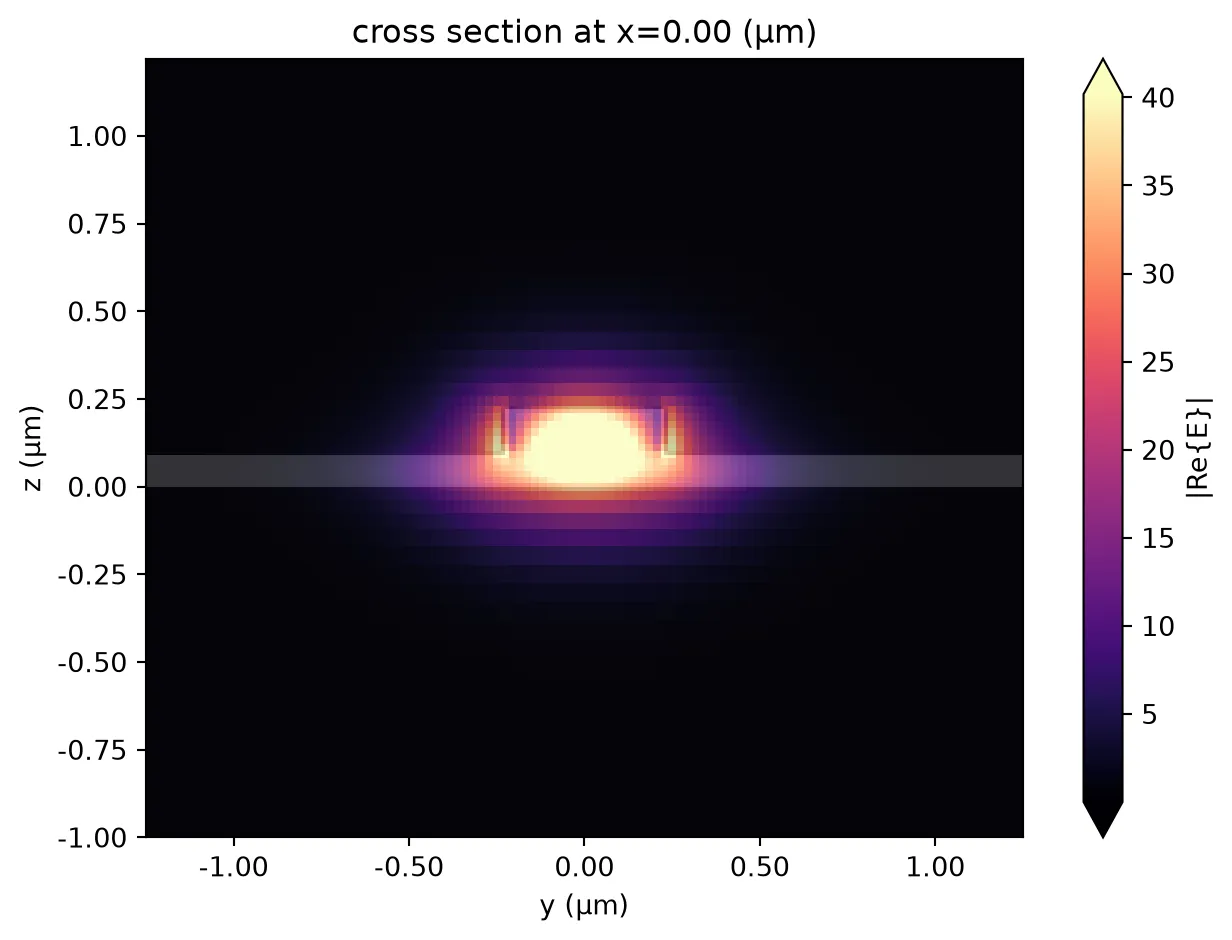
Unit Cell Construction
Section titled “Unit Cell Construction”We now construct the unit cell of the one-dimensional periodic grating. After assembling the geometry, we automatically detect and assign ports based on the rib port specification. Finally, we attach a Tidy3D model with the specified port symmetry, enabling full-wave characterization of a single periodic cell for later circuit-based analysis.
# Create a component representing the grating unit cellunit_cell = pf.Component("Grating Unit Cell")
# Define the corrugated toothtooth = pf.Rectangle(    (-tooth_length / 2, -tooth_width / 2),    (tooth_length / 2, tooth_width / 2),)
# Define the central core regioncore = pf.Rectangle(    (-a_lattice / 2, -core_width / 2),    (a_lattice / 2, core_width / 2),)
# Define the slab region around the coreslab = pf.Rectangle(    (-a_lattice / 2, -1.5),    (a_lattice / 2, 1.5),)
# Add geometric elements to appropriate layersunit_cell.add((1, 0), tooth, core)unit_cell.add((2, 0), slab)
# Automatically detect and assign ports based on the rib specificationunit_cell.add_port(unit_cell.detect_ports([rib_spec]))
# Attach a Tidy3D model with port symmetryunit_cell.add_model(pf.Tidy3DModel(port_symmetries=[("P1", "P0")]))
# Visualize the constructed unit cellviewer(unit_cell)
Building the Full Grating
Section titled “Building the Full Grating”We now assemble the full periodic grating by repeating the unit cell structure. Using a parametric component allows us to flexibly sweep the number of periods or modify the lattice constant and unit cell later.
Ports are automatically detected and added to the grating. We then attach two models to this component: a circuit model for the effective-medium bandstructure calculations, and an FDTD-based Tidy3D model for rigorous simulations.
# Define a parametric component representing the full grating@pf.parametric_componentdef create_grating(Np=Np, a_lattice=a_lattice, unit_cell=unit_cell):    """    Creates a grating component by repeating a unit cell Np times.    """    # Create an empty component for the grating    grating = pf.Component("Grating")
    # Place an array of unit cells with the specified lattice spacing    uc_array = pf.Reference(        component=unit_cell,        columns=Np,        rows=1,        spacing=(a_lattice, 0.0),    )    grating.add(uc_array)
    # Detect and add ports using the rib specification    grating.add_port(grating.detect_ports([rib_spec]))
    # Attach circuit and FDTD models    grating.add_model(pf.CircuitModel(), "Circuit Model")    grating.add_model(        pf.Tidy3DModel(port_symmetries=[("P1", "P0")]),        "FDTD Model",    )
    return grating
# Instantiate the gratinggrating = create_grating()viewer(grating);fill:%23221f20;font-weight:bold;font-size:0.144000px;}.terminal{fill:none;stroke:%23805080;stroke-width:0.018000;}.dashed{stroke-dasharray:0.090000,0.054000;}.port{fill:none;stroke:%23805080;stroke-width:0.036000;}.virtual-connection{fill:none;stroke:%23907090;stroke-width:0.027000;}.layer_31_0{stroke:%238c78ef;fill:url(%23pat-layer_31_0);fill-opacity:0.492;}.label_31_0{fill:%238c78ef;}.layer_33_0{stroke:%238c78ef;fill:url(%23pat-layer_33_0);fill-opacity:0.492;}.label_33_0{fill:%238c78ef;}.layer_102_0{stroke:%238c78ef;fill:url(%23pat-layer_102_0);fill-opacity:0.492;}.label_102_0{fill:%238c78ef;}.layer_110_0{stroke:%238c78ef;fill:url(%23pat-layer_110_0);fill-opacity:0.492;}.label_110_0{fill:%238c78ef;}.layer_189_0{stroke:%23000000;fill:none;}.label_189_0{fill:%23000000;}.layer_201_0{stroke:%2300ee00;fill:url(%23pat-layer_201_0);fill-opacity:0.492;}.label_201_0{fill:%2300ee00;}.layer_401_0{stroke:%236a8ad2;fill:url(%23pat-layer_401_0);fill-opacity:0.492;}.label_401_0{fill:%236a8ad2;}.layer_202_0{stroke:%23007600;fill:url(%23pat-layer_202_0);fill-opacity:0.492;}.label_202_0{fill:%23007600;}.layer_68_0{stroke:%23008000;fill:url(%23pat-layer_68_0);fill-opacity:0.492;}.label_68_0{fill:%23008000;}.layer_5_0{stroke:%236a8ad2;fill:url(%23pat-layer_5_0);fill-opacity:0.492;}.label_5_0{fill:%236a8ad2;}.layer_998_0{stroke:%23000000;fill:none;}.label_998_0{fill:%23000000;}.layer_312_1{stroke:%2300b8b8;fill:url(%23pat-layer_312_1);fill-opacity:0.492;}.label_312_1{fill:%2300b8b8;}.layer_312_0{stroke:%2300b8b8;fill:url(%23pat-layer_312_0);fill-opacity:0.492;}.label_312_0{fill:%2300b8b8;}.layer_402_0{stroke:%23ff0000;fill:url(%23pat-layer_402_0);fill-opacity:0.492;}.label_402_0{fill:%23ff0000;}.layer_401_4{stroke:%236a8ad2;fill:url(%23pat-layer_401_4);fill-opacity:0.492;}.label_401_4{fill:%236a8ad2;}.layer_389_0{stroke:%23ff00ff;fill:url(%23pat-layer_389_0);fill-opacity:0.492;}.label_389_0{fill:%23ff00ff;}.layer_402_1{stroke:%23ff0000;fill:url(%23pat-layer_402_1);fill-opacity:0.492;}.label_402_1{fill:%23ff0000;}.layer_350_1{stroke:%23697a00;fill:url(%23pat-layer_350_1);fill-opacity:0.492;}.label_350_1{fill:%23697a00;}.layer_401_1{stroke:%236a8ad2;fill:url(%23pat-layer_401_1);fill-opacity:0.492;}.label_401_1{fill:%236a8ad2;}.layer_313_2{stroke:%2301d95b;fill:url(%23pat-layer_313_2);fill-opacity:0.492;}.label_313_2{fill:%2301d95b;}.layer_313_1{stroke:%2301d95b;fill:url(%23pat-layer_313_1);fill-opacity:0.492;}.label_313_1{fill:%2301d95b;}.layer_313_0{stroke:%2301d95b;fill:url(%23pat-layer_313_0);fill-opacity:0.492;}.label_313_0{fill:%2301d95b;}.layer_400_0{stroke:%23a96868;fill:url(%23pat-layer_400_0);fill-opacity:0.492;}.label_400_0{fill:%23a96868;}.layer_312_3{stroke:%2300b8b8;fill:url(%23pat-layer_312_3);fill-opacity:0.492;}.label_312_3{fill:%2300b8b8;}.layer_389_1{stroke:%23ff00ff;fill:url(%23pat-layer_389_1);fill-opacity:0.492;}.label_389_1{fill:%23ff00ff;}.layer_401_3{stroke:%236a8ad2;fill:url(%23pat-layer_401_3);fill-opacity:0.492;}.label_401_3{fill:%236a8ad2;}.layer_403_2{stroke:%23500080;fill:url(%23pat-layer_403_2);fill-opacity:0.492;}.label_403_2{fill:%23500080;}.layer_403_3{stroke:%23500080;fill:url(%23pat-layer_403_3);fill-opacity:0.492;}.label_403_3{fill:%23500080;}.layer_403_1{stroke:%23500080;fill:url(%23pat-layer_403_1);fill-opacity:0.492;}.label_403_1{fill:%23500080;}.layer_403_0{stroke:%23500080;fill:url(%23pat-layer_403_0);fill-opacity:0.492;}.label_403_0{fill:%23500080;}.layer_311_1{stroke:%23ac6c56;fill:url(%23pat-layer_311_1);fill-opacity:0.492;}.label_311_1{fill:%23ac6c56;}.layer_311_0{stroke:%23ac6c56;fill:url(%23pat-layer_311_0);fill-opacity:0.492;}.label_311_0{fill:%23ac6c56;}.layer_301_1{stroke:%23800057;fill:url(%23pat-layer_301_1);fill-opacity:0.492;}.label_301_1{fill:%23800057;}.layer_301_0{stroke:%23800057;fill:url(%23pat-layer_301_0);fill-opacity:0.492;}.label_301_0{fill:%23800057;}.layer_305_1{stroke:%23808080;fill:url(%23pat-layer_305_1);fill-opacity:0.492;}.label_305_1{fill:%23808080;}.layer_305_0{stroke:%23808080;fill:url(%23pat-layer_305_0);fill-opacity:0.492;}.label_305_0{fill:%23808080;}.layer_999_0{stroke:%230000ff;fill:url(%23pat-layer_999_0);fill-opacity:0.492;}.label_999_0{fill:%230000ff;}.layer_81_0{stroke:%23808080;fill:url(%23pat-layer_81_0);fill-opacity:0.492;}.label_81_0{fill:%23808080;}.layer_290_0{stroke:%23a46eda;fill:none;}.label_290_0{fill:%23a46eda;}.layer_205_0{stroke:%2349b203;fill:url(%23pat-layer_205_0);fill-opacity:0.492;}.label_205_0{fill:%2349b203;}.layer_11_0{stroke:%230000ff;fill:url(%23pat-layer_11_0);fill-opacity:0.492;}.label_11_0{fill:%230000ff;}.layer_12_0{stroke:%23a57b00;fill:url(%23pat-layer_12_0);fill-opacity:0.492;}.label_12_0{fill:%23a57b00;}.layer_13_0{stroke:%23800057;fill:url(%23pat-layer_13_0);fill-opacity:0.492;}.label_13_0{fill:%23800057;}.layer_6_0{stroke:%23ff0000;fill:url(%23pat-layer_6_0);fill-opacity:0.492;}.label_6_0{fill:%23ff0000;}.layer_1_10{stroke:%23c96585;fill:url(%23pat-layer_1_10);fill-opacity:0.492;}.label_1_10{fill:%23c96585;}.layer_1_11{stroke:%23800000;fill:url(%23pat-layer_1_11);fill-opacity:0.492;}.label_1_11{fill:%23800000;}.layer_200_0{stroke:%23ff0000;fill:url(%23pat-layer_200_0);fill-opacity:0.492;}.label_200_0{fill:%23ff0000;}.layer_1_0{stroke:%23c96585;fill:url(%23pat-layer_1_0);fill-opacity:0.492;}.label_1_0{fill:%23c96585;}.layer_2_0{stroke:%23a46eda;fill:url(%23pat-layer_2_0);fill-opacity:0.492;}.label_2_0{fill:%23a46eda;}.layer_20_0{stroke:%2353793d;fill:url(%23pat-layer_20_0);fill-opacity:0.492;}.label_20_0{fill:%2353793d;}.layer_22_0{stroke:%23ec7600;fill:url(%23pat-layer_22_0);fill-opacity:0.492;}.label_22_0{fill:%23ec7600;}.layer_24_0{stroke:%2300b8b8;fill:url(%23pat-layer_24_0);fill-opacity:0.492;}.label_24_0{fill:%2300b8b8;}.layer_21_0{stroke:%23736264;fill:url(%23pat-layer_21_0);fill-opacity:0.492;}.label_21_0{fill:%23736264;}.layer_23_0{stroke:%23697a00;fill:url(%23pat-layer_23_0);fill-opacity:0.492;}.label_23_0{fill:%23697a00;}.layer_25_0{stroke:%23008000;fill:url(%23pat-layer_25_0);fill-opacity:0.492;}.label_25_0{fill:%23008000;}.layer_350_0{stroke:%23697a00;fill:url(%23pat-layer_350_0);fill-opacity:0.492;}.label_350_0{fill:%23697a00;}.layer_10_0{stroke:%23000000;fill:none;}.label_10_0{fill:%23000000;}.layer_203_0{stroke:%23008000;fill:url(%23pat-layer_203_0);fill-opacity:0.492;}.label_203_0{fill:%23008000;}.layer_40_0{stroke:%230000ff;fill:url(%23pat-layer_40_0);fill-opacity:0.492;}.label_40_0{fill:%230000ff;}.layer_401_2{stroke:%236a8ad2;fill:url(%23pat-layer_401_2);fill-opacity:0.492;}.label_401_2{fill:%236a8ad2;}.layer_301_2{stroke:%23800057;fill:url(%23pat-layer_301_2);fill-opacity:0.492;}.label_301_2{fill:%23800057;}</style><defs><path id=%22port-symbol%22 class=%22port%22 d=%22M 0,-0.072000 L 0.108000,0 0,0.072000%22 /><path id=%22ref-port-symbol%22 class=%22port%22 style=%22stroke-opacity:0.33;%22 d=%22M 0,-0.054000 C 0.072000,-0.054000 0.072000,0.054000 0,0.054000%22 /><circle id=%22port-bend-symbol%22 style=%22stroke-width:0;stroke:none;fill:%23805080;fill-opacity:1;%22 cx=%220%22 cy=%220%22 r=%220.032400%22 /><circle id=%22connection-symbol%22 style=%22stroke-width:0;stroke:none;fill:%23907090;fill-opacity:1;%22 cx=%220%22 cy=%220%22 r=%220.037800%22 /><pattern id=%22pat-layer_31_0%22 patternUnits=%22userSpaceOnUse%22 width=%220.090000%22 height=%220.090000%22 patternTransform=%22translate(0.068824,0.085263)%22><line x1=%220%22 y1=%220%22 x2=%220.090000%22 y2=%220.090000%22 style=%22stroke:%238c78ef;stroke-width:0.009000%22 /><line x1=%22-0.045000%22 y1=%220.045000%22 x2=%220.045000%22 y2=%220.135000%22 style=%22stroke:%238c78ef;stroke-width:0.009000%22 /><line x1=%220.045000%22 y1=%22-0.045000%22 x2=%220.135000%22 y2=%220.045000%22 style=%22stroke:%238c78ef;stroke-width:0.009000%22 /></pattern><pattern id=%22pat-layer_33_0%22 patternUnits=%22userSpaceOnUse%22 width=%220.090000%22 height=%220.090000%22 patternTransform=%22translate(0.052941,0.009474)%22><line x1=%220%22 y1=%220%22 x2=%220.090000%22 y2=%220.090000%22 style=%22stroke:%238c78ef;stroke-width:0.009000%22 /><line x1=%22-0.045000%22 y1=%220.045000%22 x2=%220.045000%22 y2=%220.135000%22 style=%22stroke:%238c78ef;stroke-width:0.009000%22 /><line x1=%220.045000%22 y1=%22-0.045000%22 x2=%220.135000%22 y2=%220.045000%22 style=%22stroke:%238c78ef;stroke-width:0.009000%22 /></pattern><pattern id=%22pat-layer_102_0%22 patternUnits=%22userSpaceOnUse%22 width=%220.090000%22 height=%220.090000%22 patternTransform=%22translate(0.000000,0.004737)%22><line x1=%220%22 y1=%220%22 x2=%220.090000%22 y2=%220.090000%22 style=%22stroke:%238c78ef;stroke-width:0.009000%22 /><line x1=%22-0.045000%22 y1=%220.045000%22 x2=%220.045000%22 y2=%220.135000%22 style=%22stroke:%238c78ef;stroke-width:0.009000%22 /><line x1=%220.045000%22 y1=%22-0.045000%22 x2=%220.135000%22 y2=%220.045000%22 style=%22stroke:%238c78ef;stroke-width:0.009000%22 /></pattern><pattern id=%22pat-layer_110_0%22 patternUnits=%22userSpaceOnUse%22 width=%220.090000%22 height=%220.090000%22 patternTransform=%22translate(0.026471,0.061579)%22><line x1=%220%22 y1=%220%22 x2=%220.090000%22 y2=%220.090000%22 style=%22stroke:%238c78ef;stroke-width:0.009000%22 /><line x1=%22-0.045000%22 y1=%220.045000%22 x2=%220.045000%22 y2=%220.135000%22 style=%22stroke:%238c78ef;stroke-width:0.009000%22 /><line x1=%220.045000%22 y1=%22-0.045000%22 x2=%220.135000%22 y2=%220.045000%22 style=%22stroke:%238c78ef;stroke-width:0.009000%22 /></pattern><pattern id=%22pat-layer_201_0%22 patternUnits=%22userSpaceOnUse%22 width=%220.090000%22 height=%220.090000%22 patternTransform=%22translate(0.068824,0.033158)%22><circle cx=%220.045000%22 cy=%220.045000%22 r=%220.009000%22 style=%22stroke:none;fill:%2300ee00;fill-opacity:1.0%22 /></pattern><pattern id=%22pat-layer_401_0%22 patternUnits=%22userSpaceOnUse%22 width=%220.054000%22 height=%220.054000%22 patternTransform=%22translate(0.006353,0.008526)%22><line x1=%220%22 y1=%220%22 x2=%220.054000%22 y2=%220.054000%22 style=%22stroke:%236a8ad2;stroke-width:0.009000%22 /><line x1=%22-0.027000%22 y1=%220.027000%22 x2=%220.027000%22 y2=%220.081000%22 style=%22stroke:%236a8ad2;stroke-width:0.009000%22 /><line x1=%220.027000%22 y1=%22-0.027000%22 x2=%220.081000%22 y2=%220.027000%22 style=%22stroke:%236a8ad2;stroke-width:0.009000%22 /><line x1=%220.054000%22 y1=%220%22 x2=%220%22 y2=%220.054000%22 style=%22stroke:%236a8ad2;stroke-width:0.009000%22 /><line x1=%220.081000%22 y1=%220.027000%22 x2=%220.027000%22 y2=%220.081000%22 style=%22stroke:%236a8ad2;stroke-width:0.009000%22 /><line x1=%220.027000%22 y1=%22-0.027000%22 x2=%22-0.027000%22 y2=%220.027000%22 style=%22stroke:%236a8ad2;stroke-width:0.009000%22 /></pattern><pattern id=%22pat-layer_202_0%22 patternUnits=%22userSpaceOnUse%22 width=%220.054000%22 height=%220.054000%22 patternTransform=%22translate(0.009529,0.051158)%22><circle cx=%220.027000%22 cy=%220.027000%22 r=%220.009000%22 style=%22stroke:none;fill:%23007600;fill-opacity:1.0%22 /></pattern><pattern id=%22pat-layer_68_0%22 patternUnits=%22userSpaceOnUse%22 width=%220.090000%22 height=%220.090000%22 patternTransform=%22translate(0.000000,0.033158)%22><circle cx=%220.045000%22 cy=%220.045000%22 r=%220.009000%22 style=%22stroke:none;fill:%23008000;fill-opacity:1.0%22 /></pattern><pattern id=%22pat-layer_5_0%22 patternUnits=%22userSpaceOnUse%22 width=%220.054000%22 height=%220.054000%22 patternTransform=%22translate(0.003176,0.048316)%22><line x1=%220.027000%22 y1=%220%22 x2=%220.027000%22 y2=%220.054000%22 style=%22stroke:%236a8ad2;stroke-width:0.009000%22 /></pattern><pattern id=%22pat-layer_312_1%22 patternUnits=%22userSpaceOnUse%22 width=%220.054000%22 height=%220.054000%22 patternTransform=%22translate(0.012706,0.042632)%22><line x1=%220%22 y1=%220%22 x2=%220.054000%22 y2=%220.054000%22 style=%22stroke:%2300b8b8;stroke-width:0.009000%22 /><line x1=%22-0.027000%22 y1=%220.027000%22 x2=%220.027000%22 y2=%220.081000%22 style=%22stroke:%2300b8b8;stroke-width:0.009000%22 /><line x1=%220.027000%22 y1=%22-0.027000%22 x2=%220.081000%22 y2=%220.027000%22 style=%22stroke:%2300b8b8;stroke-width:0.009000%22 /></pattern><pattern id=%22pat-layer_312_0%22 patternUnits=%22userSpaceOnUse%22 width=%220.090000%22 height=%220.090000%22 patternTransform=%22translate(0.042353,0.056842)%22><line x1=%220.045000%22 y1=%220%22 x2=%220.045000%22 y2=%220.090000%22 style=%22stroke:%2300b8b8;stroke-width:0.009000%22 /></pattern><pattern id=%22pat-layer_402_0%22 patternUnits=%22userSpaceOnUse%22 width=%220.090000%22 height=%220.090000%22 patternTransform=%22translate(0.047647,0.066316)%22><line x1=%220.045000%22 y1=%220%22 x2=%220.045000%22 y2=%220.090000%22 style=%22stroke:%23ff0000;stroke-width:0.009000%22 /><line x1=%220%22 y1=%220.045000%22 x2=%220.090000%22 y2=%220.045000%22 style=%22stroke:%23ff0000;stroke-width:0.009000%22 /></pattern><pattern id=%22pat-layer_401_4%22 patternUnits=%22userSpaceOnUse%22 width=%220.054000%22 height=%220.054000%22 patternTransform=%22translate(0.009529,0.042632)%22><line x1=%220.027000%22 y1=%220%22 x2=%220.027000%22 y2=%220.054000%22 style=%22stroke:%236a8ad2;stroke-width:0.009000%22 /></pattern><pattern id=%22pat-layer_389_0%22 patternUnits=%22userSpaceOnUse%22 width=%220.054000%22 height=%220.054000%22 patternTransform=%22translate(0.009529,0.011368)%22><line x1=%220.027000%22 y1=%220%22 x2=%220.027000%22 y2=%220.054000%22 style=%22stroke:%23ff00ff;stroke-width:0.009000%22 /><line x1=%220%22 y1=%220.027000%22 x2=%220.054000%22 y2=%220.027000%22 style=%22stroke:%23ff00ff;stroke-width:0.009000%22 /></pattern><pattern id=%22pat-layer_402_1%22 patternUnits=%22userSpaceOnUse%22 width=%220.054000%22 height=%220.054000%22 patternTransform=%22translate(0.015882,0.048316)%22><line x1=%220%22 y1=%220%22 x2=%220.054000%22 y2=%220.054000%22 style=%22stroke:%23ff0000;stroke-width:0.009000%22 /><line x1=%22-0.027000%22 y1=%220.027000%22 x2=%220.027000%22 y2=%220.081000%22 style=%22stroke:%23ff0000;stroke-width:0.009000%22 /><line x1=%220.027000%22 y1=%22-0.027000%22 x2=%220.081000%22 y2=%220.027000%22 style=%22stroke:%23ff0000;stroke-width:0.009000%22 /><line x1=%220.054000%22 y1=%220%22 x2=%220%22 y2=%220.054000%22 style=%22stroke:%23ff0000;stroke-width:0.009000%22 /><line x1=%220.081000%22 y1=%220.027000%22 x2=%220.027000%22 y2=%220.081000%22 style=%22stroke:%23ff0000;stroke-width:0.009000%22 /><line x1=%220.027000%22 y1=%22-0.027000%22 x2=%22-0.027000%22 y2=%220.027000%22 style=%22stroke:%23ff0000;stroke-width:0.009000%22 /></pattern><pattern id=%22pat-layer_350_1%22 patternUnits=%22userSpaceOnUse%22 width=%220.054000%22 height=%220.054000%22 patternTransform=%22translate(0.047647,0.042632)%22><circle cx=%220.027000%22 cy=%220.027000%22 r=%220.009000%22 style=%22stroke:none;fill:%23697a00;fill-opacity:1.0%22 /></pattern><pattern id=%22pat-layer_401_1%22 patternUnits=%22userSpaceOnUse%22 width=%220.090000%22 height=%220.090000%22 patternTransform=%22translate(0.079412,0.028421)%22><line x1=%220%22 y1=%220%22 x2=%220.090000%22 y2=%220.090000%22 style=%22stroke:%236a8ad2;stroke-width:0.009000%22 /><line x1=%22-0.045000%22 y1=%220.045000%22 x2=%220.045000%22 y2=%220.135000%22 style=%22stroke:%236a8ad2;stroke-width:0.009000%22 /><line x1=%220.045000%22 y1=%22-0.045000%22 x2=%220.135000%22 y2=%220.045000%22 style=%22stroke:%236a8ad2;stroke-width:0.009000%22 /><line x1=%220.090000%22 y1=%220%22 x2=%220%22 y2=%220.090000%22 style=%22stroke:%236a8ad2;stroke-width:0.009000%22 /><line x1=%220.135000%22 y1=%220.045000%22 x2=%220.045000%22 y2=%220.135000%22 style=%22stroke:%236a8ad2;stroke-width:0.009000%22 /><line x1=%220.045000%22 y1=%22-0.045000%22 x2=%22-0.045000%22 y2=%220.045000%22 style=%22stroke:%236a8ad2;stroke-width:0.009000%22 /></pattern><pattern id=%22pat-layer_313_2%22 patternUnits=%22userSpaceOnUse%22 width=%220.054000%22 height=%220.054000%22 patternTransform=%22translate(0.022235,0.028421)%22><line x1=%220%22 y1=%220%22 x2=%220.054000%22 y2=%220.054000%22 style=%22stroke:%2301d95b;stroke-width:0.009000%22 /><line x1=%22-0.027000%22 y1=%220.027000%22 x2=%220.027000%22 y2=%220.081000%22 style=%22stroke:%2301d95b;stroke-width:0.009000%22 /><line x1=%220.027000%22 y1=%22-0.027000%22 x2=%220.081000%22 y2=%220.027000%22 style=%22stroke:%2301d95b;stroke-width:0.009000%22 /></pattern><pattern id=%22pat-layer_313_1%22 patternUnits=%22userSpaceOnUse%22 width=%220.090000%22 height=%220.090000%22 patternTransform=%22translate(0.058235,0.033158)%22><line x1=%220.045000%22 y1=%220%22 x2=%220.045000%22 y2=%220.090000%22 style=%22stroke:%2301d95b;stroke-width:0.009000%22 /></pattern><pattern id=%22pat-layer_313_0%22 patternUnits=%22userSpaceOnUse%22 width=%220.054000%22 height=%220.054000%22 patternTransform=%22translate(0.047647,0.011368)%22><line x1=%220.027000%22 y1=%220%22 x2=%220.027000%22 y2=%220.054000%22 style=%22stroke:%2301d95b;stroke-width:0.009000%22 /></pattern><pattern id=%22pat-layer_400_0%22 patternUnits=%22userSpaceOnUse%22 width=%220.090000%22 height=%220.090000%22 patternTransform=%22translate(0.063529,0.052105)%22><line x1=%220%22 y1=%220%22 x2=%220.090000%22 y2=%220.090000%22 style=%22stroke:%23a96868;stroke-width:0.009000%22 /><line x1=%22-0.045000%22 y1=%220.045000%22 x2=%220.045000%22 y2=%220.135000%22 style=%22stroke:%23a96868;stroke-width:0.009000%22 /><line x1=%220.045000%22 y1=%22-0.045000%22 x2=%220.135000%22 y2=%220.045000%22 style=%22stroke:%23a96868;stroke-width:0.009000%22 /><line x1=%220.090000%22 y1=%220%22 x2=%220%22 y2=%220.090000%22 style=%22stroke:%23a96868;stroke-width:0.009000%22 /><line x1=%220.135000%22 y1=%220.045000%22 x2=%220.045000%22 y2=%220.135000%22 style=%22stroke:%23a96868;stroke-width:0.009000%22 /><line x1=%220.045000%22 y1=%22-0.045000%22 x2=%22-0.045000%22 y2=%220.045000%22 style=%22stroke:%23a96868;stroke-width:0.009000%22 /></pattern><pattern id=%22pat-layer_312_3%22 patternUnits=%22userSpaceOnUse%22 width=%220.054000%22 height=%220.054000%22 patternTransform=%22translate(0.041294,0.005684)%22><line x1=%220.054000%22 y1=%220%22 x2=%220%22 y2=%220.054000%22 style=%22stroke:%2300b8b8;stroke-width:0.009000%22 /><line x1=%220.081000%22 y1=%220.027000%22 x2=%220.027000%22 y2=%220.081000%22 style=%22stroke:%2300b8b8;stroke-width:0.009000%22 /><line x1=%220.027000%22 y1=%22-0.027000%22 x2=%22-0.027000%22 y2=%220.027000%22 style=%22stroke:%2300b8b8;stroke-width:0.009000%22 /></pattern><pattern id=%22pat-layer_389_1%22 patternUnits=%22userSpaceOnUse%22 width=%220.090000%22 height=%220.090000%22 patternTransform=%22translate(0.084706,0.033158)%22><line x1=%220.045000%22 y1=%220%22 x2=%220.045000%22 y2=%220.090000%22 style=%22stroke:%23ff00ff;stroke-width:0.009000%22 /><line x1=%220%22 y1=%220.045000%22 x2=%220.090000%22 y2=%220.045000%22 style=%22stroke:%23ff00ff;stroke-width:0.009000%22 /></pattern><pattern id=%22pat-layer_401_3%22 patternUnits=%22userSpaceOnUse%22 width=%220.090000%22 height=%220.090000%22 patternTransform=%22translate(0.037059,0.056842)%22><line x1=%220%22 y1=%220.045000%22 x2=%220.090000%22 y2=%220.045000%22 style=%22stroke:%236a8ad2;stroke-width:0.009000%22 /></pattern><pattern id=%22pat-layer_403_2%22 patternUnits=%22userSpaceOnUse%22 width=%220.054000%22 height=%220.054000%22 patternTransform=%22translate(0.025412,0.034105)%22><line x1=%220%22 y1=%220%22 x2=%220.054000%22 y2=%220.054000%22 style=%22stroke:%23500080;stroke-width:0.009000%22 /><line x1=%22-0.027000%22 y1=%220.027000%22 x2=%220.027000%22 y2=%220.081000%22 style=%22stroke:%23500080;stroke-width:0.009000%22 /><line x1=%220.027000%22 y1=%22-0.027000%22 x2=%220.081000%22 y2=%220.027000%22 style=%22stroke:%23500080;stroke-width:0.009000%22 /><line x1=%220.054000%22 y1=%220%22 x2=%220%22 y2=%220.054000%22 style=%22stroke:%23500080;stroke-width:0.009000%22 /><line x1=%220.081000%22 y1=%220.027000%22 x2=%220.027000%22 y2=%220.081000%22 style=%22stroke:%23500080;stroke-width:0.009000%22 /><line x1=%220.027000%22 y1=%22-0.027000%22 x2=%22-0.027000%22 y2=%220.027000%22 style=%22stroke:%23500080;stroke-width:0.009000%22 /></pattern><pattern id=%22pat-layer_403_3%22 patternUnits=%22userSpaceOnUse%22 width=%220.090000%22 height=%220.090000%22 patternTransform=%22translate(0.021176,0.071053)%22><line x1=%220%22 y1=%220%22 x2=%220.090000%22 y2=%220.090000%22 style=%22stroke:%23500080;stroke-width:0.009000%22 /><line x1=%22-0.045000%22 y1=%220.045000%22 x2=%220.045000%22 y2=%220.135000%22 style=%22stroke:%23500080;stroke-width:0.009000%22 /><line x1=%220.045000%22 y1=%22-0.045000%22 x2=%220.135000%22 y2=%220.045000%22 style=%22stroke:%23500080;stroke-width:0.009000%22 /><line x1=%220.090000%22 y1=%220%22 x2=%220%22 y2=%220.090000%22 style=%22stroke:%23500080;stroke-width:0.009000%22 /><line x1=%220.135000%22 y1=%220.045000%22 x2=%220.045000%22 y2=%220.135000%22 style=%22stroke:%23500080;stroke-width:0.009000%22 /><line x1=%220.045000%22 y1=%22-0.045000%22 x2=%22-0.045000%22 y2=%220.045000%22 style=%22stroke:%23500080;stroke-width:0.009000%22 /></pattern><pattern id=%22pat-layer_403_1%22 patternUnits=%22userSpaceOnUse%22 width=%220.090000%22 height=%220.090000%22 patternTransform=%22translate(0.063529,0.042632)%22><line x1=%220.045000%22 y1=%220%22 x2=%220.045000%22 y2=%220.090000%22 style=%22stroke:%23500080;stroke-width:0.009000%22 /><line x1=%220%22 y1=%220.045000%22 x2=%220.090000%22 y2=%220.045000%22 style=%22stroke:%23500080;stroke-width:0.009000%22 /></pattern><pattern id=%22pat-layer_403_0%22 patternUnits=%22userSpaceOnUse%22 width=%220.054000%22 height=%220.054000%22 patternTransform=%22translate(0.050824,0.017053)%22><line x1=%220.027000%22 y1=%220%22 x2=%220.027000%22 y2=%220.054000%22 style=%22stroke:%23500080;stroke-width:0.009000%22 /><line x1=%220%22 y1=%220.027000%22 x2=%220.054000%22 y2=%220.027000%22 style=%22stroke:%23500080;stroke-width:0.009000%22 /></pattern><pattern id=%22pat-layer_311_1%22 patternUnits=%22userSpaceOnUse%22 width=%220.090000%22 height=%220.090000%22 patternTransform=%22translate(0.074118,0.018947)%22><line x1=%220%22 y1=%220%22 x2=%220.090000%22 y2=%220.090000%22 style=%22stroke:%23ac6c56;stroke-width:0.009000%22 /><line x1=%22-0.045000%22 y1=%220.045000%22 x2=%220.045000%22 y2=%220.135000%22 style=%22stroke:%23ac6c56;stroke-width:0.009000%22 /><line x1=%220.045000%22 y1=%22-0.045000%22 x2=%220.135000%22 y2=%220.045000%22 style=%22stroke:%23ac6c56;stroke-width:0.009000%22 /></pattern><pattern id=%22pat-layer_311_0%22 patternUnits=%22userSpaceOnUse%22 width=%220.054000%22 height=%220.054000%22 patternTransform=%22translate(0.003176,0.002842)%22><line x1=%220%22 y1=%220%22 x2=%220.054000%22 y2=%220.054000%22 style=%22stroke:%23ac6c56;stroke-width:0.009000%22 /><line x1=%22-0.027000%22 y1=%220.027000%22 x2=%220.027000%22 y2=%220.081000%22 style=%22stroke:%23ac6c56;stroke-width:0.009000%22 /><line x1=%220.027000%22 y1=%22-0.027000%22 x2=%220.081000%22 y2=%220.027000%22 style=%22stroke:%23ac6c56;stroke-width:0.009000%22 /></pattern><pattern id=%22pat-layer_301_1%22 patternUnits=%22userSpaceOnUse%22 width=%220.090000%22 height=%220.090000%22 patternTransform=%22translate(0.063529,0.037895)%22><line x1=%220%22 y1=%220.045000%22 x2=%220.090000%22 y2=%220.045000%22 style=%22stroke:%23800057;stroke-width:0.009000%22 /></pattern><pattern id=%22pat-layer_301_0%22 patternUnits=%22userSpaceOnUse%22 width=%220.054000%22 height=%220.054000%22 patternTransform=%22translate(0.050824,0.014211)%22><line x1=%220%22 y1=%220.027000%22 x2=%220.054000%22 y2=%220.027000%22 style=%22stroke:%23800057;stroke-width:0.009000%22 /></pattern><pattern id=%22pat-layer_305_1%22 patternUnits=%22userSpaceOnUse%22 width=%220.090000%22 height=%220.090000%22 patternTransform=%22translate(0.031765,0.066316)%22><line x1=%220.045000%22 y1=%220%22 x2=%220.045000%22 y2=%220.090000%22 style=%22stroke:%23808080;stroke-width:0.009000%22 /><line x1=%220%22 y1=%220.045000%22 x2=%220.090000%22 y2=%220.045000%22 style=%22stroke:%23808080;stroke-width:0.009000%22 /></pattern><pattern id=%22pat-layer_305_0%22 patternUnits=%22userSpaceOnUse%22 width=%220.054000%22 height=%220.054000%22 patternTransform=%22translate(0.031765,0.031263)%22><line x1=%220.027000%22 y1=%220%22 x2=%220.027000%22 y2=%220.054000%22 style=%22stroke:%23808080;stroke-width:0.009000%22 /><line x1=%220%22 y1=%220.027000%22 x2=%220.054000%22 y2=%220.027000%22 style=%22stroke:%23808080;stroke-width:0.009000%22 /></pattern><pattern id=%22pat-layer_999_0%22 patternUnits=%22userSpaceOnUse%22 width=%220.054000%22 height=%220.054000%22 patternTransform=%22translate(0.019059,0.019895)%22><line x1=%220.027000%22 y1=%220%22 x2=%220.027000%22 y2=%220.054000%22 style=%22stroke:%230000ff;stroke-width:0.009000%22 /></pattern><pattern id=%22pat-layer_81_0%22 patternUnits=%22userSpaceOnUse%22 width=%220.054000%22 height=%220.054000%22 patternTransform=%22translate(0.019059,0.048316)%22><line x1=%220.027000%22 y1=%220%22 x2=%220.027000%22 y2=%220.054000%22 style=%22stroke:%23808080;stroke-width:0.009000%22 /><line x1=%220%22 y1=%220.027000%22 x2=%220.054000%22 y2=%220.027000%22 style=%22stroke:%23808080;stroke-width:0.009000%22 /></pattern><pattern id=%22pat-layer_205_0%22 patternUnits=%22userSpaceOnUse%22 width=%220.054000%22 height=%220.054000%22 patternTransform=%22translate(0.022235,0.036947)%22><line x1=%220%22 y1=%220%22 x2=%220.054000%22 y2=%220.054000%22 style=%22stroke:%2349b203;stroke-width:0.009000%22 /><line x1=%22-0.027000%22 y1=%220.027000%22 x2=%220.027000%22 y2=%220.081000%22 style=%22stroke:%2349b203;stroke-width:0.009000%22 /><line x1=%220.027000%22 y1=%22-0.027000%22 x2=%220.081000%22 y2=%220.027000%22 style=%22stroke:%2349b203;stroke-width:0.009000%22 /><line x1=%220.054000%22 y1=%220%22 x2=%220%22 y2=%220.054000%22 style=%22stroke:%2349b203;stroke-width:0.009000%22 /><line x1=%220.081000%22 y1=%220.027000%22 x2=%220.027000%22 y2=%220.081000%22 style=%22stroke:%2349b203;stroke-width:0.009000%22 /><line x1=%220.027000%22 y1=%22-0.027000%22 x2=%22-0.027000%22 y2=%220.027000%22 style=%22stroke:%2349b203;stroke-width:0.009000%22 /></pattern><pattern id=%22pat-layer_11_0%22 patternUnits=%22userSpaceOnUse%22 width=%220.054000%22 height=%220.054000%22 patternTransform=%22translate(0.028588,0.019895)%22><line x1=%220.054000%22 y1=%220%22 x2=%220%22 y2=%220.054000%22 style=%22stroke:%230000ff;stroke-width:0.009000%22 /><line x1=%220.081000%22 y1=%220.027000%22 x2=%220.027000%22 y2=%220.081000%22 style=%22stroke:%230000ff;stroke-width:0.009000%22 /><line x1=%220.027000%22 y1=%22-0.027000%22 x2=%22-0.027000%22 y2=%220.027000%22 style=%22stroke:%230000ff;stroke-width:0.009000%22 /></pattern><pattern id=%22pat-layer_12_0%22 patternUnits=%22userSpaceOnUse%22 width=%220.054000%22 height=%220.054000%22 patternTransform=%22translate(0.050824,0.051158)%22><line x1=%220%22 y1=%220%22 x2=%220.054000%22 y2=%220.054000%22 style=%22stroke:%23a57b00;stroke-width:0.009000%22 /><line x1=%22-0.027000%22 y1=%220.027000%22 x2=%220.027000%22 y2=%220.081000%22 style=%22stroke:%23a57b00;stroke-width:0.009000%22 /><line x1=%220.027000%22 y1=%22-0.027000%22 x2=%220.081000%22 y2=%220.027000%22 style=%22stroke:%23a57b00;stroke-width:0.009000%22 /></pattern><pattern id=%22pat-layer_13_0%22 patternUnits=%22userSpaceOnUse%22 width=%220.054000%22 height=%220.054000%22 patternTransform=%22translate(0.019059,0.028421)%22><line x1=%220.054000%22 y1=%220%22 x2=%220%22 y2=%220.054000%22 style=%22stroke:%23800057;stroke-width:0.009000%22 /><line x1=%220.081000%22 y1=%220.027000%22 x2=%220.027000%22 y2=%220.081000%22 style=%22stroke:%23800057;stroke-width:0.009000%22 /><line x1=%220.027000%22 y1=%22-0.027000%22 x2=%22-0.027000%22 y2=%220.027000%22 style=%22stroke:%23800057;stroke-width:0.009000%22 /></pattern><pattern id=%22pat-layer_6_0%22 patternUnits=%22userSpaceOnUse%22 width=%220.090000%22 height=%220.090000%22 patternTransform=%22translate(0.042353,0.042632)%22><line x1=%220%22 y1=%220.045000%22 x2=%220.090000%22 y2=%220.045000%22 style=%22stroke:%23ff0000;stroke-width:0.009000%22 /></pattern><pattern id=%22pat-layer_1_10%22 patternUnits=%22userSpaceOnUse%22 width=%220.054000%22 height=%220.054000%22 patternTransform=%22translate(0.003176,0.008526)%22><line x1=%220%22 y1=%220%22 x2=%220.054000%22 y2=%220.054000%22 style=%22stroke:%23c96585;stroke-width:0.009000%22 /><line x1=%22-0.027000%22 y1=%220.027000%22 x2=%220.027000%22 y2=%220.081000%22 style=%22stroke:%23c96585;stroke-width:0.009000%22 /><line x1=%220.027000%22 y1=%22-0.027000%22 x2=%220.081000%22 y2=%220.027000%22 style=%22stroke:%23c96585;stroke-width:0.009000%22 /><line x1=%220.054000%22 y1=%220%22 x2=%220%22 y2=%220.054000%22 style=%22stroke:%23c96585;stroke-width:0.009000%22 /><line x1=%220.081000%22 y1=%220.027000%22 x2=%220.027000%22 y2=%220.081000%22 style=%22stroke:%23c96585;stroke-width:0.009000%22 /><line x1=%220.027000%22 y1=%22-0.027000%22 x2=%22-0.027000%22 y2=%220.027000%22 style=%22stroke:%23c96585;stroke-width:0.009000%22 /></pattern><pattern id=%22pat-layer_1_11%22 patternUnits=%22userSpaceOnUse%22 width=%220.090000%22 height=%220.090000%22 patternTransform=%22translate(0.074118,0.028421)%22><line x1=%220.045000%22 y1=%220%22 x2=%220.045000%22 y2=%220.090000%22 style=%22stroke:%23800000;stroke-width:0.009000%22 /><line x1=%220%22 y1=%220.045000%22 x2=%220.090000%22 y2=%220.045000%22 style=%22stroke:%23800000;stroke-width:0.009000%22 /></pattern><pattern id=%22pat-layer_200_0%22 patternUnits=%22userSpaceOnUse%22 width=%220.090000%22 height=%220.090000%22 patternTransform=%22translate(0.031765,0.071053)%22><line x1=%220%22 y1=%220%22 x2=%220.090000%22 y2=%220.090000%22 style=%22stroke:%23ff0000;stroke-width:0.009000%22 /><line x1=%22-0.045000%22 y1=%220.045000%22 x2=%220.045000%22 y2=%220.135000%22 style=%22stroke:%23ff0000;stroke-width:0.009000%22 /><line x1=%220.045000%22 y1=%22-0.045000%22 x2=%220.135000%22 y2=%220.045000%22 style=%22stroke:%23ff0000;stroke-width:0.009000%22 /><line x1=%220.090000%22 y1=%220%22 x2=%220%22 y2=%220.090000%22 style=%22stroke:%23ff0000;stroke-width:0.009000%22 /><line x1=%220.135000%22 y1=%220.045000%22 x2=%220.045000%22 y2=%220.135000%22 style=%22stroke:%23ff0000;stroke-width:0.009000%22 /><line x1=%220.045000%22 y1=%22-0.045000%22 x2=%22-0.045000%22 y2=%220.045000%22 style=%22stroke:%23ff0000;stroke-width:0.009000%22 /></pattern><pattern id=%22pat-layer_1_0%22 patternUnits=%22userSpaceOnUse%22 width=%220.054000%22 height=%220.054000%22 patternTransform=%22translate(0.022235,0.031263)%22><line x1=%220.054000%22 y1=%220%22 x2=%220%22 y2=%220.054000%22 style=%22stroke:%23c96585;stroke-width:0.009000%22 /><line x1=%220.081000%22 y1=%220.027000%22 x2=%220.027000%22 y2=%220.081000%22 style=%22stroke:%23c96585;stroke-width:0.009000%22 /><line x1=%220.027000%22 y1=%22-0.027000%22 x2=%22-0.027000%22 y2=%220.027000%22 style=%22stroke:%23c96585;stroke-width:0.009000%22 /></pattern><pattern id=%22pat-layer_2_0%22 patternUnits=%22userSpaceOnUse%22 width=%220.090000%22 height=%220.090000%22 patternTransform=%22translate(0.074118,0.014211)%22><line x1=%220%22 y1=%220%22 x2=%220.090000%22 y2=%220.090000%22 style=%22stroke:%23a46eda;stroke-width:0.009000%22 /><line x1=%22-0.045000%22 y1=%220.045000%22 x2=%220.045000%22 y2=%220.135000%22 style=%22stroke:%23a46eda;stroke-width:0.009000%22 /><line x1=%220.045000%22 y1=%22-0.045000%22 x2=%220.135000%22 y2=%220.045000%22 style=%22stroke:%23a46eda;stroke-width:0.009000%22 /></pattern><pattern id=%22pat-layer_20_0%22 patternUnits=%22userSpaceOnUse%22 width=%220.090000%22 height=%220.090000%22 patternTransform=%22translate(0.021176,0.052105)%22><line x1=%220%22 y1=%220.045000%22 x2=%220.090000%22 y2=%220.045000%22 style=%22stroke:%2353793d;stroke-width:0.009000%22 /></pattern><pattern id=%22pat-layer_22_0%22 patternUnits=%22userSpaceOnUse%22 width=%220.090000%22 height=%220.090000%22 patternTransform=%22translate(0.005294,0.066316)%22><line x1=%220%22 y1=%220%22 x2=%220.090000%22 y2=%220.090000%22 style=%22stroke:%23ec7600;stroke-width:0.009000%22 /><line x1=%22-0.045000%22 y1=%220.045000%22 x2=%220.045000%22 y2=%220.135000%22 style=%22stroke:%23ec7600;stroke-width:0.009000%22 /><line x1=%220.045000%22 y1=%22-0.045000%22 x2=%220.135000%22 y2=%220.045000%22 style=%22stroke:%23ec7600;stroke-width:0.009000%22 /><line x1=%220.090000%22 y1=%220%22 x2=%220%22 y2=%220.090000%22 style=%22stroke:%23ec7600;stroke-width:0.009000%22 /><line x1=%220.135000%22 y1=%220.045000%22 x2=%220.045000%22 y2=%220.135000%22 style=%22stroke:%23ec7600;stroke-width:0.009000%22 /><line x1=%220.045000%22 y1=%22-0.045000%22 x2=%22-0.045000%22 y2=%220.045000%22 style=%22stroke:%23ec7600;stroke-width:0.009000%22 /></pattern><pattern id=%22pat-layer_24_0%22 patternUnits=%22userSpaceOnUse%22 width=%220.090000%22 height=%220.090000%22 patternTransform=%22translate(0.079412,0.080526)%22><line x1=%220.045000%22 y1=%220%22 x2=%220.045000%22 y2=%220.090000%22 style=%22stroke:%2300b8b8;stroke-width:0.009000%22 /><line x1=%220%22 y1=%220.045000%22 x2=%220.090000%22 y2=%220.045000%22 style=%22stroke:%2300b8b8;stroke-width:0.009000%22 /></pattern><pattern id=%22pat-layer_21_0%22 patternUnits=%22userSpaceOnUse%22 width=%220.054000%22 height=%220.054000%22 patternTransform=%22translate(0.034941,0.008526)%22><line x1=%220%22 y1=%220.027000%22 x2=%220.054000%22 y2=%220.027000%22 style=%22stroke:%23736264;stroke-width:0.009000%22 /></pattern><pattern id=%22pat-layer_23_0%22 patternUnits=%22userSpaceOnUse%22 width=%220.054000%22 height=%220.054000%22 patternTransform=%22translate(0.025412,0.017053)%22><line x1=%220%22 y1=%220%22 x2=%220.054000%22 y2=%220.054000%22 style=%22stroke:%23697a00;stroke-width:0.009000%22 /><line x1=%22-0.027000%22 y1=%220.027000%22 x2=%220.027000%22 y2=%220.081000%22 style=%22stroke:%23697a00;stroke-width:0.009000%22 /><line x1=%220.027000%22 y1=%22-0.027000%22 x2=%220.081000%22 y2=%220.027000%22 style=%22stroke:%23697a00;stroke-width:0.009000%22 /><line x1=%220.054000%22 y1=%220%22 x2=%220%22 y2=%220.054000%22 style=%22stroke:%23697a00;stroke-width:0.009000%22 /><line x1=%220.081000%22 y1=%220.027000%22 x2=%220.027000%22 y2=%220.081000%22 style=%22stroke:%23697a00;stroke-width:0.009000%22 /><line x1=%220.027000%22 y1=%22-0.027000%22 x2=%22-0.027000%22 y2=%220.027000%22 style=%22stroke:%23697a00;stroke-width:0.009000%22 /></pattern><pattern id=%22pat-layer_25_0%22 patternUnits=%22userSpaceOnUse%22 width=%220.054000%22 height=%220.054000%22 patternTransform=%22translate(0.015882,0.025579)%22><line x1=%220.027000%22 y1=%220%22 x2=%220.027000%22 y2=%220.054000%22 style=%22stroke:%23008000;stroke-width:0.009000%22 /><line x1=%220%22 y1=%220.027000%22 x2=%220.054000%22 y2=%220.027000%22 style=%22stroke:%23008000;stroke-width:0.009000%22 /></pattern><pattern id=%22pat-layer_350_0%22 patternUnits=%22userSpaceOnUse%22 width=%220.090000%22 height=%220.090000%22 patternTransform=%22translate(0.010588,0.056842)%22><line x1=%220.090000%22 y1=%220%22 x2=%220%22 y2=%220.090000%22 style=%22stroke:%23697a00;stroke-width:0.009000%22 /><line x1=%220.135000%22 y1=%220.045000%22 x2=%220.045000%22 y2=%220.135000%22 style=%22stroke:%23697a00;stroke-width:0.009000%22 /><line x1=%220.045000%22 y1=%22-0.045000%22 x2=%22-0.045000%22 y2=%220.045000%22 style=%22stroke:%23697a00;stroke-width:0.009000%22 /></pattern><pattern id=%22pat-layer_203_0%22 patternUnits=%22userSpaceOnUse%22 width=%220.090000%22 height=%220.090000%22 patternTransform=%22translate(0.052941,0.047368)%22><line x1=%220.090000%22 y1=%220%22 x2=%220%22 y2=%220.090000%22 style=%22stroke:%23008000;stroke-width:0.009000%22 /><line x1=%220.135000%22 y1=%220.045000%22 x2=%220.045000%22 y2=%220.135000%22 style=%22stroke:%23008000;stroke-width:0.009000%22 /><line x1=%220.045000%22 y1=%22-0.045000%22 x2=%22-0.045000%22 y2=%220.045000%22 style=%22stroke:%23008000;stroke-width:0.009000%22 /></pattern><pattern id=%22pat-layer_40_0%22 patternUnits=%22userSpaceOnUse%22 width=%220.090000%22 height=%220.090000%22 patternTransform=%22translate(0.042353,0.014211)%22><circle cx=%220.045000%22 cy=%220.045000%22 r=%220.009000%22 style=%22stroke:none;fill:%230000ff;fill-opacity:1.0%22 /></pattern><pattern id=%22pat-layer_401_2%22 patternUnits=%22userSpaceOnUse%22 width=%220.054000%22 height=%220.054000%22 patternTransform=%22translate(0.034941,0.025579)%22><line x1=%220%22 y1=%220.027000%22 x2=%220.054000%22 y2=%220.027000%22 style=%22stroke:%236a8ad2;stroke-width:0.009000%22 /></pattern><pattern id=%22pat-layer_301_2%22 patternUnits=%22userSpaceOnUse%22 width=%220.054000%22 height=%220.054000%22 patternTransform=%22translate(0.025412,0.031263)%22><line x1=%220.027000%22 y1=%220%22 x2=%220.027000%22 y2=%220.054000%22 style=%22stroke:%23800057;stroke-width:0.009000%22 /></pattern><g id=%22C1%22 data-name=%22Grating Unit Cell%22><rect class=%22layer_1_0%22 x=%22-0.050000%22 y=%22-0.417500%22 width=%220.100000%22 height=%220.835000%22 /><rect class=%22layer_1_0%22 x=%22-0.150000%22 y=%22-0.227500%22 width=%220.300000%22 height=%220.455000%22 /><rect class=%22layer_2_0%22 x=%22-0.150000%22 y=%22-1.500000%22 width=%220.300000%22 height=%223.000000%22 /></g></defs><g transform=%22scale(1 -1)%22><g id=%22C0%22 data-name=%22Grating%22><use transform=%22translate(0.000000 0.000000)%22 href=%22%23C1%22 /><use transform=%22translate(0.300000 0.000000)%22 href=%22%23C1%22 /><use transform=%22translate(0.600000 0.000000)%22 href=%22%23C1%22 /><use transform=%22translate(0.900000 0.000000)%22 href=%22%23C1%22 /><use transform=%22translate(1.200000 0.000000)%22 href=%22%23C1%22 /><use transform=%22translate(1.500000 0.000000)%22 href=%22%23C1%22 /><use transform=%22translate(1.800000 0.000000)%22 href=%22%23C1%22 /><use transform=%22translate(2.100000 0.000000)%22 href=%22%23C1%22 /><use transform=%22translate(2.400000 0.000000)%22 href=%22%23C1%22 /><use transform=%22translate(2.700000 0.000000)%22 href=%22%23C1%22 /><use transform=%22translate(3.000000 0.000000)%22 href=%22%23C1%22 /><use transform=%22translate(3.300000 0.000000)%22 href=%22%23C1%22 /><use transform=%22translate(3.600000 0.000000)%22 href=%22%23C1%22 /><use transform=%22translate(3.900000 0.000000)%22 href=%22%23C1%22 /><use transform=%22translate(4.200000 0.000000)%22 href=%22%23C1%22 /><use transform=%22translate(4.500000 0.000000)%22 href=%22%23C1%22 /><use transform=%22translate(4.800000 0.000000)%22 href=%22%23C1%22 /><use transform=%22translate(5.100000 0.000000)%22 href=%22%23C1%22 /><use transform=%22translate(5.400000 0.000000)%22 href=%22%23C1%22 /><use transform=%22translate(5.700000 0.000000)%22 href=%22%23C1%22 /><g transform=%22translate(-0.150000 0.000500) rotate(0.000000)%22><path class=%22port%22 d=%22M 0,-1.250000 V 1.250000%22 /><use href=%22%23port-symbol%22 /></g><text class=%22label%22 text-anchor=%22start%22 dominant-baseline=%22text-after-edge%22 x=%22-0.150000%22 y=%22-0.000500%22>P0</text><g transform=%22translate(5.850000 0.000500) rotate(180.000000)%22><path class=%22port%22 d=%22M 0,-1.250000 V 1.250000%22 /><use href=%22%23port-symbol%22 /></g><text class=%22label%22 text-anchor=%22end%22 dominant-baseline=%22text-before-edge%22 x=%225.850000%22 y=%22-0.000500%22>P1</text></g></g></svg>)
Photonic Crystal Band Structure Calculation
Section titled “Photonic Crystal Band Structure Calculation”This function extracts the complex band structure of a periodic device using the Nicholson-Ross-Weir (NRW) based S-parameter retrieval method. It treats the finite grating as a homogeneous effective medium with complex propagation constant .
1. The Effective Medium Approach The ABCD transfer-matrix element is related to the scattering parameters by [2]:
Under the symmetry and reciprocity conditions typical for 1D periodic gratings:
this expression simplifies to the commonly used form:
From transmission line theory, this parameter corresponds to the propagation through a medium of length :
where is the complex propagation constant. By inverting this equation (), we can separate the real and imaginary components:
- : Corresponds to the attenuation constant (defining the Bandgap Depth).
- : Corresponds to the phase constant (defining the Dispersion/Band Structure).
2. Phase Ambiguity and Auto-Calibration The mathematical operation is multi-valued; it only returns the principal value of the phase (typically within ). However, a physical device of length accumulates many cycles of phase ().
To resolve this Branch Cut problem, the function uses an Auto-Calibration routine:
- We calculate a “reference phase” using an approximate effective index () provided by the user: .
- We find the integer number of cycles () that minimizes the difference between the retrieved phase and the reference phase.
- This reconstructs the absolute physical wavevector in the extended zone.
3. Brillouin Zone Folding Photonic crystals are traditionally analyzed in the First Brillouin Zone (). The retrieved wavevector is initially in the extended zone. We apply a “triangle wave” folding operation to map the data back into the first zone:
4. Group Index () The group index is calculated via numerical differentiation of the retrieved dispersion curve:
⚠️ Limitations and Assumptions
Section titled “⚠️ Limitations and Assumptions”1. Approximation of Finite Structures This method assumes the Bloch mode has fully established itself. It extracts the effective parameters of the finite device simulated.
2. Single-Mode Assumption (Critical) This mathematical retrieval is valid ONLY for single-mode waveguides. If the waveguide supports multiple modes (e.g., TE0 and TE1) or if there is significant coupling to radiation modes (leaky and high-loss modes), the S-parameters will represent a superposition of these modes. The analytic inversion will fail to distinguish them, resulting in a mathematically “averaged” or nonsensical dispersion curve.
3. Effective Index Guess
The accuracy of the unfolded phase calibration depends on n_eff_approx. It does not need to be perfect, but it must be close enough to identify the correct integer branch .
def calculate_bandstructure(freqs, s11, s21, L_device, a_lattice, n_eff_approx):    """    Calculates bandstructure with automatic phase calibration using effective index.
    Parameters:    -----------    freqs     : array-like        List of frequency points (e.g., in Hz or THz).    s11       : array-like (complex)        Reflection coefficients (complex S11).    s21       : array-like (complex)        Transmission coefficients (complex S21).    L_device  : float        Total length of the simulated grating (e.g., Np * a).    a_lattice : float        The lattice constant (period) of the unit cell.    n_eff_approx : float        Approximate effective index for calibration
    Returns:    --------    k_real_norm : array        The real part of the wavevector, normalized to the Brillouin Zone (k * a / pi).        This is the standard 'Band Structure' plot.    k_imag_norm : array        The imaginary part (decay), normalized (delta * a).        This shows the bandgap depth.    ng: array        Group index    """    # Calculate ABCD parameter    A = (1 - s11**2 + s21**2) / (2 * s21)
    # Extract Raw Gamma (Complex Propagation Constant * L)    gamma_L = np.arccosh(A)
    # Extract Raw Phase and Unwrap    phase_raw = np.unwrap(np.imag(gamma_L))
    # --- AUTO-CALIBRATION ROUTINE ---    # Calculate the "Expected" Phase based on n_eff    beta_approx = (2 * np.pi * freqs / td.C_0) * n_eff_approx    phase_expected = beta_approx * L_device
    # Fix Slope Direction (Sign Ambiguity)    slope_raw = np.mean(np.gradient(phase_raw))    slope_expected = np.mean(np.gradient(phase_expected))    if np.sign(slope_raw) != np.sign(slope_expected):        phase_raw = -phase_raw
    # Find the Integer 'm' (Cycle Ambiguity)    diff = phase_expected - phase_raw    m_cycles = np.round(np.mean(diff) / (2 * np.pi))
    print(        f"Auto-calibration: Added {int(m_cycles)} * 2pi cycles to match n_eff={n_eff_approx}"    )
    # Apply Correction    phase_corrected = phase_raw + (m_cycles * 2 * np.pi)
    # -------------------------------
    # Calculate k-vector (Beta)    k_vector = phase_corrected / L_device
    # Normalization for Plotting (ka / 2pi)    k_real_norm = np.abs(k_vector) * a_lattice / (2 * np.pi)    # Fold into First Brillouin Zone [0, 0.5]    k_real_norm = 0.5 - np.abs(np.mod(k_real_norm, 1) - 0.5)
    # The dimensionless decay per unit cell    k_imag_norm = np.real(gamma_L) * a_lattice / L_device
    # Calculate group index    omega = 2 * np.pi * freqs    dbeta_domega = np.abs(np.gradient(k_vector, omega))    ng = td.C_0 * dbeta_domega
    return k_real_norm, k_imag_norm, ng
Band Structure and Group Index Calculation
Section titled “Band Structure and Group Index Calculation”In this section, we simulate the S-parameters of a finite grating with multiple periods to minimize interface effects. By retrieving the complex propagation constant using the NRW inversion, we extract the photonic band structure, compare the results to both rigorous Tidy3D simulations (standard rigorous bandstructure calculation) and published data, and also compute the group index. The results are in excellent agreement.
Comparison with Reference Band Structure
We observe a slight mismatch between the reference data (red markers) and both the circuit-model and Tidy3D curves. This discrepancy is expected and likely arises from several sources:
- The tooth length is not reported in the paper and is approximated in our model, which changes the exact duty cycle and thus the band edges.
- There may be small differences in the material models (e.g., dispersion and refractive indices of Si and SiO₂, or operating temperature) and other simulation settings (mesh resolution, PML design, number of periods, boundary conditions) between our setup and the original study.
Given these uncertainties, the level of agreement in the band curvature and bandgap position supports that our circuit-based retrieval and full-wave simulations are capturing the essential physics of the published design.
# This section evaluates bandstructure for a multi-period gratingNp_0 = 10grating_0 = create_grating(Np=Np_0)
# Activate the rigorous FDTD modelgrating_0.activate_model("FDTD Model")
# Compute S-parameterss_matrix_grating_0 = grating_0.s_matrix(frequencies=freqs)
# Retrieve bandstructure using the circuit-model inversionk_band, alpha_band, ng = calculate_bandstructure(    freqs=freqs,    s11=s_matrix_grating_0[("P0@0", "P0@0")],    s21=s_matrix_grating_0[("P0@0", "P1@0")],    L_device=Np_0 * a_lattice,    a_lattice=a_lattice,    n_eff_approx=n_eff,)
# Data extracted from the paper (Fig. 1B)paper_k = np.array(    [        0.48105,        0.48778,        0.49335,        0.49979,        0.50724,        0.51220,        0.51847,        0.48113,        0.48784,        0.49237,        0.49982,        0.50757,        0.51211,        0.51885,    ])paper_freq = np.array(    [        0.18808,        0.18981,        0.19094,        0.19158,        0.19081,        0.18974,        0.18806,        0.19929,        0.19758,        0.19655,        0.19571,        0.19649,        0.19754,        0.19916,    ])
# Tidy3D "rigorous" bandstructuretidy3d_freq = np.array(    [        [0.1875239435424648, 0.19897133233967337],        [0.18928426483807095, 0.19724930008894026],        [0.19088857219385474, 0.1956672320439793],        [0.19175729862345767, 0.19480580946191053],        [0.19088857207264562, 0.19566723206852332],        [0.18928426515329203, 0.1972492999487063],        [0.1875239437470226, 0.1989713323456029],    ])tidy3d_k = np.array([0.47857, 0.48571, 0.49285, 0.5, 0.50714, 0.51428, 0.52142])
# --- Plotting ---fig, (ax1, ax2) = plt.subplots(1, 2, figsize=(10, 4))
# Dispersion Curveax1.scatter(    np.repeat(tidy3d_k, tidy3d_freq.shape[1]),    tidy3d_freq.flatten(),    color="blue",    label="Tidy3D (Rigorous)",    zorder=7,)ax1.plot(k_band, freqs * a_lattice / td.C_0, ".-", color="green", label="Circuit Model")ax1.plot(1 - k_band, freqs * a_lattice / td.C_0, ".-", color="green")ax1.plot(    paper_k,    paper_freq,    "x",    color="red",    markersize=8,    label="Reference Data",    zorder=10,)ax1.set_xlabel("Normalized Wavevector ($k a / 2\\pi$)")ax1.set_ylabel("Normalized Frequency ($f a / c$)")ax1.grid(True)ax1.legend()
# Group Index Plotax2.plot(ng, freqs * a_lattice / td.C_0, "r.-")ax1.set_ylabel("Normalized Frequency ($f a / c$)")ax2.set_xlabel("Group Index")ax2.grid(True)
plt.tight_layout()plt.show()
Uploading task 'P0@0…'Starting task 'P0@0': https://tidy3d.simulation.cloud/workbench?taskId=fdve-08e54c7d-2cf9-4cd4-bbb3-953652f0cafaDownloading data from 'P0@0'…Auto-calibration: Added 5 * 2pi cycles to match n_eff=2.521032303168735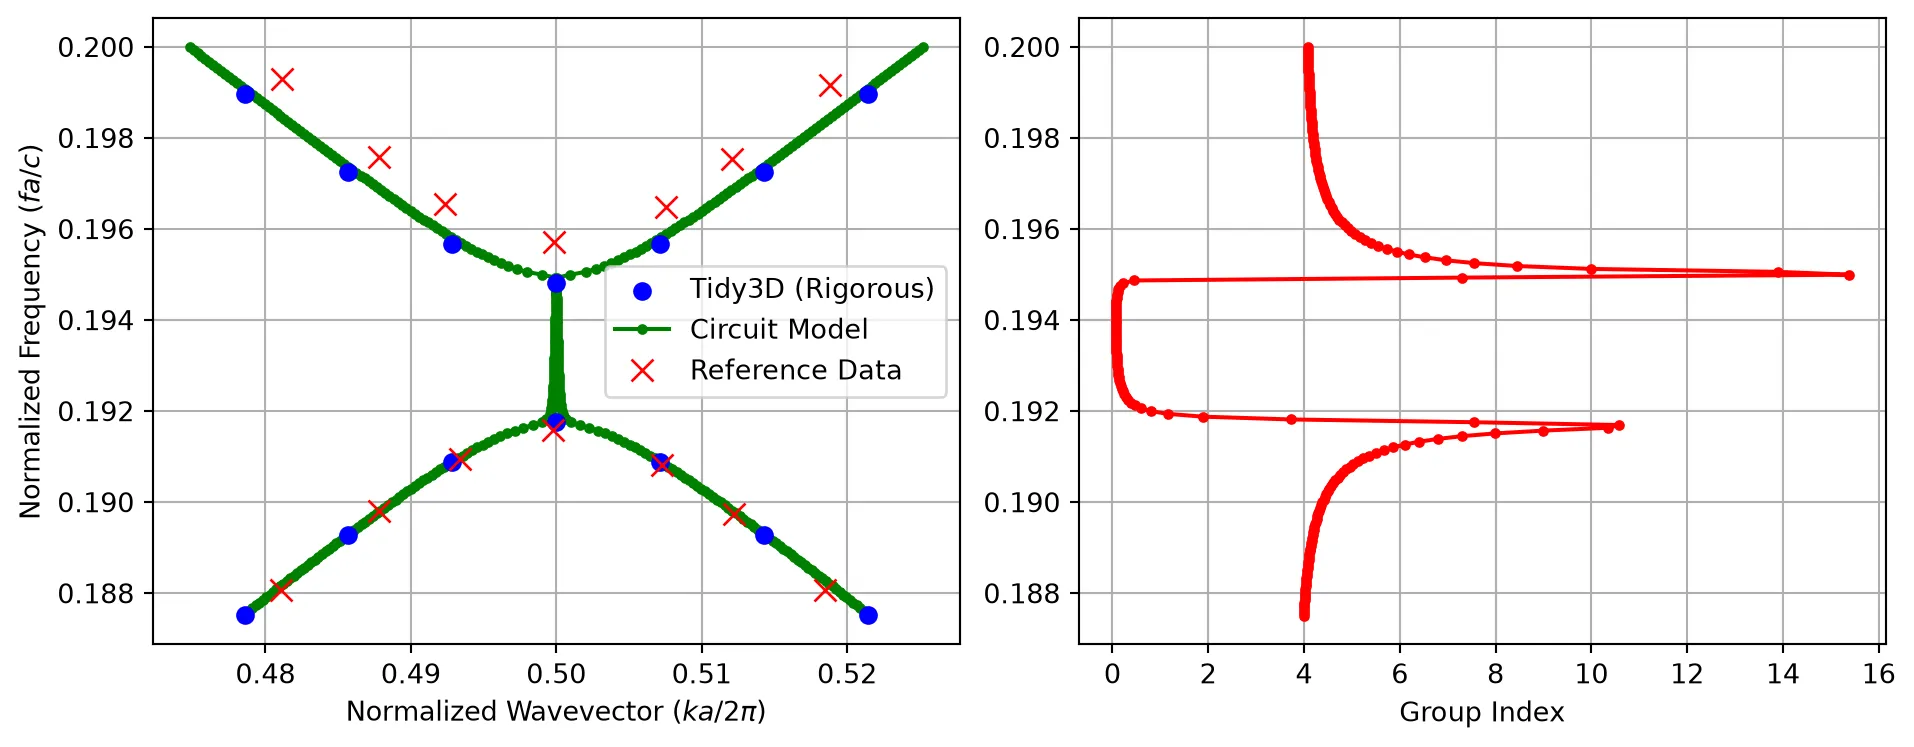
Modeling the CROW
Section titled “Modeling the CROW”Defect Cell for CROW Resonator
Section titled “Defect Cell for CROW Resonator”To model a coupled-resonator optical waveguide (CROW), we first introduce a defect unit cell into the otherwise periodic grating. We create this defect by increasing the tooth length inside a single unit cell. This creates a resonant cavity embedded in the periodic structure.
We define an effective defect period such that the overall cell length is adjusted consistently when the tooth length is increased. The core and slab rectangles are then extended to span this new period, while the transverse dimensions (core width and slab height) remain unchanged. We reuse the same rib-waveguide port specification and attach a Tidy3D model, enabling us to later compute the cavity mode and its coupling to neighboring cells when we assemble the full CROW.
# Create a component representing the defect unit celldefect = pf.Component("Defect")
# Adjust the effective period to account for the longer tootha_defect = a_lattice + (defect_length - tooth_length)
# Define the enlarged tooth region for the defecttooth = pf.Rectangle(    (-defect_length / 2, -tooth_width / 2),    (defect_length / 2, tooth_width / 2),)
# Define the core region spanning the defect periodcore = pf.Rectangle(    (-a_defect / 2, -core_width / 2),    (a_defect / 2, core_width / 2),)
# Define the slab region for the defect periodslab = pf.Rectangle(    (-a_defect / 2, -1.5),    (a_defect / 2, 1.5),)
# Add geometric elements to appropriate layersdefect.add((1, 0), tooth, core)defect.add((2, 0), slab)
# Detect and add ports based on the rib specificationdefect.add_port(defect.detect_ports([rib_spec]))
# Attach a Tidy3D model with port symmetry for the defect celldefect.add_model(pf.Tidy3DModel(port_symmetries=[("P1", "P0")]))
# Return the defect componentviewer(defect)
CROW Supercell
Section titled “CROW Supercell”We now form a supercell resonator by placing the defect unit cell between two identical gratings that act as distributed Bragg reflectors. This configuration implements a single cavity of the CROW, where the gratings provide high reflectivity and the defect cell defines the resonant frequency.
# Create a component representing the CROW supercell (cavity + mirrors)sc = pf.Component("Supercell")
# Chain the left grating mirror, the central defect cavity, and the right grating mirrorsc.add(*pf.reference_chain({"grating": grating, "defect": defect}, "grating - defect - grating"))
# Detect and add external ports at the ends of the supercellsc.add_port(sc.detect_ports([rib_spec]))
# Attach a circuit model so the supercell can be used in a CROW networksc.add_model(pf.CircuitModel())
# Return the constructed supercellviewer(sc);fill:%23221f20;font-weight:bold;font-size:0.169800px;}.terminal{fill:none;stroke:%23805080;stroke-width:0.021225;}.dashed{stroke-dasharray:0.106125,0.063675;}.port{fill:none;stroke:%23805080;stroke-width:0.042450;}.virtual-connection{fill:none;stroke:%23907090;stroke-width:0.031838;}.layer_31_0{stroke:%238c78ef;fill:url(%23pat-layer_31_0);fill-opacity:0.492;}.label_31_0{fill:%238c78ef;}.layer_33_0{stroke:%238c78ef;fill:url(%23pat-layer_33_0);fill-opacity:0.492;}.label_33_0{fill:%238c78ef;}.layer_102_0{stroke:%238c78ef;fill:url(%23pat-layer_102_0);fill-opacity:0.492;}.label_102_0{fill:%238c78ef;}.layer_110_0{stroke:%238c78ef;fill:url(%23pat-layer_110_0);fill-opacity:0.492;}.label_110_0{fill:%238c78ef;}.layer_189_0{stroke:%23000000;fill:none;}.label_189_0{fill:%23000000;}.layer_201_0{stroke:%2300ee00;fill:url(%23pat-layer_201_0);fill-opacity:0.492;}.label_201_0{fill:%2300ee00;}.layer_401_0{stroke:%236a8ad2;fill:url(%23pat-layer_401_0);fill-opacity:0.492;}.label_401_0{fill:%236a8ad2;}.layer_202_0{stroke:%23007600;fill:url(%23pat-layer_202_0);fill-opacity:0.492;}.label_202_0{fill:%23007600;}.layer_68_0{stroke:%23008000;fill:url(%23pat-layer_68_0);fill-opacity:0.492;}.label_68_0{fill:%23008000;}.layer_5_0{stroke:%236a8ad2;fill:url(%23pat-layer_5_0);fill-opacity:0.492;}.label_5_0{fill:%236a8ad2;}.layer_998_0{stroke:%23000000;fill:none;}.label_998_0{fill:%23000000;}.layer_312_1{stroke:%2300b8b8;fill:url(%23pat-layer_312_1);fill-opacity:0.492;}.label_312_1{fill:%2300b8b8;}.layer_312_0{stroke:%2300b8b8;fill:url(%23pat-layer_312_0);fill-opacity:0.492;}.label_312_0{fill:%2300b8b8;}.layer_402_0{stroke:%23ff0000;fill:url(%23pat-layer_402_0);fill-opacity:0.492;}.label_402_0{fill:%23ff0000;}.layer_401_4{stroke:%236a8ad2;fill:url(%23pat-layer_401_4);fill-opacity:0.492;}.label_401_4{fill:%236a8ad2;}.layer_389_0{stroke:%23ff00ff;fill:url(%23pat-layer_389_0);fill-opacity:0.492;}.label_389_0{fill:%23ff00ff;}.layer_402_1{stroke:%23ff0000;fill:url(%23pat-layer_402_1);fill-opacity:0.492;}.label_402_1{fill:%23ff0000;}.layer_350_1{stroke:%23697a00;fill:url(%23pat-layer_350_1);fill-opacity:0.492;}.label_350_1{fill:%23697a00;}.layer_401_1{stroke:%236a8ad2;fill:url(%23pat-layer_401_1);fill-opacity:0.492;}.label_401_1{fill:%236a8ad2;}.layer_313_2{stroke:%2301d95b;fill:url(%23pat-layer_313_2);fill-opacity:0.492;}.label_313_2{fill:%2301d95b;}.layer_313_1{stroke:%2301d95b;fill:url(%23pat-layer_313_1);fill-opacity:0.492;}.label_313_1{fill:%2301d95b;}.layer_313_0{stroke:%2301d95b;fill:url(%23pat-layer_313_0);fill-opacity:0.492;}.label_313_0{fill:%2301d95b;}.layer_400_0{stroke:%23a96868;fill:url(%23pat-layer_400_0);fill-opacity:0.492;}.label_400_0{fill:%23a96868;}.layer_312_3{stroke:%2300b8b8;fill:url(%23pat-layer_312_3);fill-opacity:0.492;}.label_312_3{fill:%2300b8b8;}.layer_389_1{stroke:%23ff00ff;fill:url(%23pat-layer_389_1);fill-opacity:0.492;}.label_389_1{fill:%23ff00ff;}.layer_401_3{stroke:%236a8ad2;fill:url(%23pat-layer_401_3);fill-opacity:0.492;}.label_401_3{fill:%236a8ad2;}.layer_403_2{stroke:%23500080;fill:url(%23pat-layer_403_2);fill-opacity:0.492;}.label_403_2{fill:%23500080;}.layer_403_3{stroke:%23500080;fill:url(%23pat-layer_403_3);fill-opacity:0.492;}.label_403_3{fill:%23500080;}.layer_403_1{stroke:%23500080;fill:url(%23pat-layer_403_1);fill-opacity:0.492;}.label_403_1{fill:%23500080;}.layer_403_0{stroke:%23500080;fill:url(%23pat-layer_403_0);fill-opacity:0.492;}.label_403_0{fill:%23500080;}.layer_311_1{stroke:%23ac6c56;fill:url(%23pat-layer_311_1);fill-opacity:0.492;}.label_311_1{fill:%23ac6c56;}.layer_311_0{stroke:%23ac6c56;fill:url(%23pat-layer_311_0);fill-opacity:0.492;}.label_311_0{fill:%23ac6c56;}.layer_301_1{stroke:%23800057;fill:url(%23pat-layer_301_1);fill-opacity:0.492;}.label_301_1{fill:%23800057;}.layer_301_0{stroke:%23800057;fill:url(%23pat-layer_301_0);fill-opacity:0.492;}.label_301_0{fill:%23800057;}.layer_305_1{stroke:%23808080;fill:url(%23pat-layer_305_1);fill-opacity:0.492;}.label_305_1{fill:%23808080;}.layer_305_0{stroke:%23808080;fill:url(%23pat-layer_305_0);fill-opacity:0.492;}.label_305_0{fill:%23808080;}.layer_999_0{stroke:%230000ff;fill:url(%23pat-layer_999_0);fill-opacity:0.492;}.label_999_0{fill:%230000ff;}.layer_81_0{stroke:%23808080;fill:url(%23pat-layer_81_0);fill-opacity:0.492;}.label_81_0{fill:%23808080;}.layer_290_0{stroke:%23a46eda;fill:none;}.label_290_0{fill:%23a46eda;}.layer_205_0{stroke:%2349b203;fill:url(%23pat-layer_205_0);fill-opacity:0.492;}.label_205_0{fill:%2349b203;}.layer_11_0{stroke:%230000ff;fill:url(%23pat-layer_11_0);fill-opacity:0.492;}.label_11_0{fill:%230000ff;}.layer_12_0{stroke:%23a57b00;fill:url(%23pat-layer_12_0);fill-opacity:0.492;}.label_12_0{fill:%23a57b00;}.layer_13_0{stroke:%23800057;fill:url(%23pat-layer_13_0);fill-opacity:0.492;}.label_13_0{fill:%23800057;}.layer_6_0{stroke:%23ff0000;fill:url(%23pat-layer_6_0);fill-opacity:0.492;}.label_6_0{fill:%23ff0000;}.layer_1_10{stroke:%23c96585;fill:url(%23pat-layer_1_10);fill-opacity:0.492;}.label_1_10{fill:%23c96585;}.layer_1_11{stroke:%23800000;fill:url(%23pat-layer_1_11);fill-opacity:0.492;}.label_1_11{fill:%23800000;}.layer_200_0{stroke:%23ff0000;fill:url(%23pat-layer_200_0);fill-opacity:0.492;}.label_200_0{fill:%23ff0000;}.layer_1_0{stroke:%23c96585;fill:url(%23pat-layer_1_0);fill-opacity:0.492;}.label_1_0{fill:%23c96585;}.layer_2_0{stroke:%23a46eda;fill:url(%23pat-layer_2_0);fill-opacity:0.492;}.label_2_0{fill:%23a46eda;}.layer_20_0{stroke:%2353793d;fill:url(%23pat-layer_20_0);fill-opacity:0.492;}.label_20_0{fill:%2353793d;}.layer_22_0{stroke:%23ec7600;fill:url(%23pat-layer_22_0);fill-opacity:0.492;}.label_22_0{fill:%23ec7600;}.layer_24_0{stroke:%2300b8b8;fill:url(%23pat-layer_24_0);fill-opacity:0.492;}.label_24_0{fill:%2300b8b8;}.layer_21_0{stroke:%23736264;fill:url(%23pat-layer_21_0);fill-opacity:0.492;}.label_21_0{fill:%23736264;}.layer_23_0{stroke:%23697a00;fill:url(%23pat-layer_23_0);fill-opacity:0.492;}.label_23_0{fill:%23697a00;}.layer_25_0{stroke:%23008000;fill:url(%23pat-layer_25_0);fill-opacity:0.492;}.label_25_0{fill:%23008000;}.layer_350_0{stroke:%23697a00;fill:url(%23pat-layer_350_0);fill-opacity:0.492;}.label_350_0{fill:%23697a00;}.layer_10_0{stroke:%23000000;fill:none;}.label_10_0{fill:%23000000;}.layer_203_0{stroke:%23008000;fill:url(%23pat-layer_203_0);fill-opacity:0.492;}.label_203_0{fill:%23008000;}.layer_40_0{stroke:%230000ff;fill:url(%23pat-layer_40_0);fill-opacity:0.492;}.label_40_0{fill:%230000ff;}.layer_401_2{stroke:%236a8ad2;fill:url(%23pat-layer_401_2);fill-opacity:0.492;}.label_401_2{fill:%236a8ad2;}.layer_301_2{stroke:%23800057;fill:url(%23pat-layer_301_2);fill-opacity:0.492;}.label_301_2{fill:%23800057;}</style><defs><path id=%22port-symbol%22 class=%22port%22 d=%22M 0,-0.084900 L 0.127350,0 0,0.084900%22 /><path id=%22ref-port-symbol%22 class=%22port%22 style=%22stroke-opacity:0.33;%22 d=%22M 0,-0.063675 C 0.084900,-0.063675 0.084900,0.063675 0,0.063675%22 /><circle id=%22port-bend-symbol%22 style=%22stroke-width:0;stroke:none;fill:%23805080;fill-opacity:1;%22 cx=%220%22 cy=%220%22 r=%220.038205%22 /><circle id=%22connection-symbol%22 style=%22stroke-width:0;stroke:none;fill:%23907090;fill-opacity:1;%22 cx=%220%22 cy=%220%22 r=%220.044573%22 /><pattern id=%22pat-layer_31_0%22 patternUnits=%22userSpaceOnUse%22 width=%220.106125%22 height=%220.106125%22 patternTransform=%22translate(0.081154,0.100539)%22><line x1=%220%22 y1=%220%22 x2=%220.106125%22 y2=%220.106125%22 style=%22stroke:%238c78ef;stroke-width:0.010613%22 /><line x1=%22-0.053063%22 y1=%220.053063%22 x2=%220.053063%22 y2=%220.159188%22 style=%22stroke:%238c78ef;stroke-width:0.010613%22 /><line x1=%220.053063%22 y1=%22-0.053063%22 x2=%220.159188%22 y2=%220.053063%22 style=%22stroke:%238c78ef;stroke-width:0.010613%22 /></pattern><pattern id=%22pat-layer_33_0%22 patternUnits=%22userSpaceOnUse%22 width=%220.106125%22 height=%220.106125%22 patternTransform=%22translate(0.062426,0.011171)%22><line x1=%220%22 y1=%220%22 x2=%220.106125%22 y2=%220.106125%22 style=%22stroke:%238c78ef;stroke-width:0.010613%22 /><line x1=%22-0.053063%22 y1=%220.053063%22 x2=%220.053063%22 y2=%220.159188%22 style=%22stroke:%238c78ef;stroke-width:0.010613%22 /><line x1=%220.053063%22 y1=%22-0.053063%22 x2=%220.159188%22 y2=%220.053063%22 style=%22stroke:%238c78ef;stroke-width:0.010613%22 /></pattern><pattern id=%22pat-layer_102_0%22 patternUnits=%22userSpaceOnUse%22 width=%220.106125%22 height=%220.106125%22 patternTransform=%22translate(0.000000,0.005586)%22><line x1=%220%22 y1=%220%22 x2=%220.106125%22 y2=%220.106125%22 style=%22stroke:%238c78ef;stroke-width:0.010613%22 /><line x1=%22-0.053063%22 y1=%220.053063%22 x2=%220.053063%22 y2=%220.159188%22 style=%22stroke:%238c78ef;stroke-width:0.010613%22 /><line x1=%220.053063%22 y1=%22-0.053063%22 x2=%220.159188%22 y2=%220.053063%22 style=%22stroke:%238c78ef;stroke-width:0.010613%22 /></pattern><pattern id=%22pat-layer_110_0%22 patternUnits=%22userSpaceOnUse%22 width=%220.106125%22 height=%220.106125%22 patternTransform=%22translate(0.031213,0.072612)%22><line x1=%220%22 y1=%220%22 x2=%220.106125%22 y2=%220.106125%22 style=%22stroke:%238c78ef;stroke-width:0.010613%22 /><line x1=%22-0.053063%22 y1=%220.053063%22 x2=%220.053063%22 y2=%220.159188%22 style=%22stroke:%238c78ef;stroke-width:0.010613%22 /><line x1=%220.053063%22 y1=%22-0.053063%22 x2=%220.159188%22 y2=%220.053063%22 style=%22stroke:%238c78ef;stroke-width:0.010613%22 /></pattern><pattern id=%22pat-layer_201_0%22 patternUnits=%22userSpaceOnUse%22 width=%220.106125%22 height=%220.106125%22 patternTransform=%22translate(0.081154,0.039099)%22><circle cx=%220.053063%22 cy=%220.053063%22 r=%220.010613%22 style=%22stroke:none;fill:%2300ee00;fill-opacity:1.0%22 /></pattern><pattern id=%22pat-layer_401_0%22 patternUnits=%22userSpaceOnUse%22 width=%220.063675%22 height=%220.063675%22 patternTransform=%22translate(0.007491,0.010054)%22><line x1=%220%22 y1=%220%22 x2=%220.063675%22 y2=%220.063675%22 style=%22stroke:%236a8ad2;stroke-width:0.010613%22 /><line x1=%22-0.031838%22 y1=%220.031838%22 x2=%220.031838%22 y2=%220.095513%22 style=%22stroke:%236a8ad2;stroke-width:0.010613%22 /><line x1=%220.031838%22 y1=%22-0.031838%22 x2=%220.095513%22 y2=%220.031838%22 style=%22stroke:%236a8ad2;stroke-width:0.010613%22 /><line x1=%220.063675%22 y1=%220%22 x2=%220%22 y2=%220.063675%22 style=%22stroke:%236a8ad2;stroke-width:0.010613%22 /><line x1=%220.095513%22 y1=%220.031838%22 x2=%220.031838%22 y2=%220.095513%22 style=%22stroke:%236a8ad2;stroke-width:0.010613%22 /><line x1=%220.031838%22 y1=%22-0.031838%22 x2=%22-0.031838%22 y2=%220.031838%22 style=%22stroke:%236a8ad2;stroke-width:0.010613%22 /></pattern><pattern id=%22pat-layer_202_0%22 patternUnits=%22userSpaceOnUse%22 width=%220.063675%22 height=%220.063675%22 patternTransform=%22translate(0.011237,0.060324)%22><circle cx=%220.031838%22 cy=%220.031838%22 r=%220.010613%22 style=%22stroke:none;fill:%23007600;fill-opacity:1.0%22 /></pattern><pattern id=%22pat-layer_68_0%22 patternUnits=%22userSpaceOnUse%22 width=%220.106125%22 height=%220.106125%22 patternTransform=%22translate(0.000000,0.039099)%22><circle cx=%220.053063%22 cy=%220.053063%22 r=%220.010613%22 style=%22stroke:none;fill:%23008000;fill-opacity:1.0%22 /></pattern><pattern id=%22pat-layer_5_0%22 patternUnits=%22userSpaceOnUse%22 width=%220.063675%22 height=%220.063675%22 patternTransform=%22translate(0.003746,0.056972)%22><line x1=%220.031838%22 y1=%220%22 x2=%220.031838%22 y2=%220.063675%22 style=%22stroke:%236a8ad2;stroke-width:0.010613%22 /></pattern><pattern id=%22pat-layer_312_1%22 patternUnits=%22userSpaceOnUse%22 width=%220.063675%22 height=%220.063675%22 patternTransform=%22translate(0.014982,0.050270)%22><line x1=%220%22 y1=%220%22 x2=%220.063675%22 y2=%220.063675%22 style=%22stroke:%2300b8b8;stroke-width:0.010613%22 /><line x1=%22-0.031838%22 y1=%220.031838%22 x2=%220.031838%22 y2=%220.095513%22 style=%22stroke:%2300b8b8;stroke-width:0.010613%22 /><line x1=%220.031838%22 y1=%22-0.031838%22 x2=%220.095513%22 y2=%220.031838%22 style=%22stroke:%2300b8b8;stroke-width:0.010613%22 /></pattern><pattern id=%22pat-layer_312_0%22 patternUnits=%22userSpaceOnUse%22 width=%220.106125%22 height=%220.106125%22 patternTransform=%22translate(0.049941,0.067026)%22><line x1=%220.053063%22 y1=%220%22 x2=%220.053063%22 y2=%220.106125%22 style=%22stroke:%2300b8b8;stroke-width:0.010613%22 /></pattern><pattern id=%22pat-layer_402_0%22 patternUnits=%22userSpaceOnUse%22 width=%220.106125%22 height=%220.106125%22 patternTransform=%22translate(0.056184,0.078197)%22><line x1=%220.053063%22 y1=%220%22 x2=%220.053063%22 y2=%220.106125%22 style=%22stroke:%23ff0000;stroke-width:0.010613%22 /><line x1=%220%22 y1=%220.053063%22 x2=%220.106125%22 y2=%220.053063%22 style=%22stroke:%23ff0000;stroke-width:0.010613%22 /></pattern><pattern id=%22pat-layer_401_4%22 patternUnits=%22userSpaceOnUse%22 width=%220.063675%22 height=%220.063675%22 patternTransform=%22translate(0.011237,0.050270)%22><line x1=%220.031838%22 y1=%220%22 x2=%220.031838%22 y2=%220.063675%22 style=%22stroke:%236a8ad2;stroke-width:0.010613%22 /></pattern><pattern id=%22pat-layer_389_0%22 patternUnits=%22userSpaceOnUse%22 width=%220.063675%22 height=%220.063675%22 patternTransform=%22translate(0.011237,0.013405)%22><line x1=%220.031838%22 y1=%220%22 x2=%220.031838%22 y2=%220.063675%22 style=%22stroke:%23ff00ff;stroke-width:0.010613%22 /><line x1=%220%22 y1=%220.031838%22 x2=%220.063675%22 y2=%220.031838%22 style=%22stroke:%23ff00ff;stroke-width:0.010613%22 /></pattern><pattern id=%22pat-layer_402_1%22 patternUnits=%22userSpaceOnUse%22 width=%220.063675%22 height=%220.063675%22 patternTransform=%22translate(0.018728,0.056972)%22><line x1=%220%22 y1=%220%22 x2=%220.063675%22 y2=%220.063675%22 style=%22stroke:%23ff0000;stroke-width:0.010613%22 /><line x1=%22-0.031838%22 y1=%220.031838%22 x2=%220.031838%22 y2=%220.095513%22 style=%22stroke:%23ff0000;stroke-width:0.010613%22 /><line x1=%220.031838%22 y1=%22-0.031838%22 x2=%220.095513%22 y2=%220.031838%22 style=%22stroke:%23ff0000;stroke-width:0.010613%22 /><line x1=%220.063675%22 y1=%220%22 x2=%220%22 y2=%220.063675%22 style=%22stroke:%23ff0000;stroke-width:0.010613%22 /><line x1=%220.095513%22 y1=%220.031838%22 x2=%220.031838%22 y2=%220.095513%22 style=%22stroke:%23ff0000;stroke-width:0.010613%22 /><line x1=%220.031838%22 y1=%22-0.031838%22 x2=%22-0.031838%22 y2=%220.031838%22 style=%22stroke:%23ff0000;stroke-width:0.010613%22 /></pattern><pattern id=%22pat-layer_350_1%22 patternUnits=%22userSpaceOnUse%22 width=%220.063675%22 height=%220.063675%22 patternTransform=%22translate(0.056184,0.050270)%22><circle cx=%220.031838%22 cy=%220.031838%22 r=%220.010613%22 style=%22stroke:none;fill:%23697a00;fill-opacity:1.0%22 /></pattern><pattern id=%22pat-layer_401_1%22 patternUnits=%22userSpaceOnUse%22 width=%220.106125%22 height=%220.106125%22 patternTransform=%22translate(0.093640,0.033513)%22><line x1=%220%22 y1=%220%22 x2=%220.106125%22 y2=%220.106125%22 style=%22stroke:%236a8ad2;stroke-width:0.010613%22 /><line x1=%22-0.053063%22 y1=%220.053063%22 x2=%220.053063%22 y2=%220.159188%22 style=%22stroke:%236a8ad2;stroke-width:0.010613%22 /><line x1=%220.053063%22 y1=%22-0.053063%22 x2=%220.159188%22 y2=%220.053063%22 style=%22stroke:%236a8ad2;stroke-width:0.010613%22 /><line x1=%220.106125%22 y1=%220%22 x2=%220%22 y2=%220.106125%22 style=%22stroke:%236a8ad2;stroke-width:0.010613%22 /><line x1=%220.159188%22 y1=%220.053063%22 x2=%220.053063%22 y2=%220.159188%22 style=%22stroke:%236a8ad2;stroke-width:0.010613%22 /><line x1=%220.053063%22 y1=%22-0.053063%22 x2=%22-0.053063%22 y2=%220.053063%22 style=%22stroke:%236a8ad2;stroke-width:0.010613%22 /></pattern><pattern id=%22pat-layer_313_2%22 patternUnits=%22userSpaceOnUse%22 width=%220.063675%22 height=%220.063675%22 patternTransform=%22translate(0.026219,0.033513)%22><line x1=%220%22 y1=%220%22 x2=%220.063675%22 y2=%220.063675%22 style=%22stroke:%2301d95b;stroke-width:0.010613%22 /><line x1=%22-0.031838%22 y1=%220.031838%22 x2=%220.031838%22 y2=%220.095513%22 style=%22stroke:%2301d95b;stroke-width:0.010613%22 /><line x1=%220.031838%22 y1=%22-0.031838%22 x2=%220.095513%22 y2=%220.031838%22 style=%22stroke:%2301d95b;stroke-width:0.010613%22 /></pattern><pattern id=%22pat-layer_313_1%22 patternUnits=%22userSpaceOnUse%22 width=%220.106125%22 height=%220.106125%22 patternTransform=%22translate(0.068669,0.039099)%22><line x1=%220.053063%22 y1=%220%22 x2=%220.053063%22 y2=%220.106125%22 style=%22stroke:%2301d95b;stroke-width:0.010613%22 /></pattern><pattern id=%22pat-layer_313_0%22 patternUnits=%22userSpaceOnUse%22 width=%220.063675%22 height=%220.063675%22 patternTransform=%22translate(0.056184,0.013405)%22><line x1=%220.031838%22 y1=%220%22 x2=%220.031838%22 y2=%220.063675%22 style=%22stroke:%2301d95b;stroke-width:0.010613%22 /></pattern><pattern id=%22pat-layer_400_0%22 patternUnits=%22userSpaceOnUse%22 width=%220.106125%22 height=%220.106125%22 patternTransform=%22translate(0.074912,0.061441)%22><line x1=%220%22 y1=%220%22 x2=%220.106125%22 y2=%220.106125%22 style=%22stroke:%23a96868;stroke-width:0.010613%22 /><line x1=%22-0.053063%22 y1=%220.053063%22 x2=%220.053063%22 y2=%220.159188%22 style=%22stroke:%23a96868;stroke-width:0.010613%22 /><line x1=%220.053063%22 y1=%22-0.053063%22 x2=%220.159188%22 y2=%220.053063%22 style=%22stroke:%23a96868;stroke-width:0.010613%22 /><line x1=%220.106125%22 y1=%220%22 x2=%220%22 y2=%220.106125%22 style=%22stroke:%23a96868;stroke-width:0.010613%22 /><line x1=%220.159188%22 y1=%220.053063%22 x2=%220.053063%22 y2=%220.159188%22 style=%22stroke:%23a96868;stroke-width:0.010613%22 /><line x1=%220.053063%22 y1=%22-0.053063%22 x2=%22-0.053063%22 y2=%220.053063%22 style=%22stroke:%23a96868;stroke-width:0.010613%22 /></pattern><pattern id=%22pat-layer_312_3%22 patternUnits=%22userSpaceOnUse%22 width=%220.063675%22 height=%220.063675%22 patternTransform=%22translate(0.048693,0.006703)%22><line x1=%220.063675%22 y1=%220%22 x2=%220%22 y2=%220.063675%22 style=%22stroke:%2300b8b8;stroke-width:0.010613%22 /><line x1=%220.095513%22 y1=%220.031838%22 x2=%220.031838%22 y2=%220.095513%22 style=%22stroke:%2300b8b8;stroke-width:0.010613%22 /><line x1=%220.031838%22 y1=%22-0.031838%22 x2=%22-0.031838%22 y2=%220.031838%22 style=%22stroke:%2300b8b8;stroke-width:0.010613%22 /></pattern><pattern id=%22pat-layer_389_1%22 patternUnits=%22userSpaceOnUse%22 width=%220.106125%22 height=%220.106125%22 patternTransform=%22translate(0.099882,0.039099)%22><line x1=%220.053063%22 y1=%220%22 x2=%220.053063%22 y2=%220.106125%22 style=%22stroke:%23ff00ff;stroke-width:0.010613%22 /><line x1=%220%22 y1=%220.053063%22 x2=%220.106125%22 y2=%220.053063%22 style=%22stroke:%23ff00ff;stroke-width:0.010613%22 /></pattern><pattern id=%22pat-layer_401_3%22 patternUnits=%22userSpaceOnUse%22 width=%220.106125%22 height=%220.106125%22 patternTransform=%22translate(0.043699,0.067026)%22><line x1=%220%22 y1=%220.053063%22 x2=%220.106125%22 y2=%220.053063%22 style=%22stroke:%236a8ad2;stroke-width:0.010613%22 /></pattern><pattern id=%22pat-layer_403_2%22 patternUnits=%22userSpaceOnUse%22 width=%220.063675%22 height=%220.063675%22 patternTransform=%22translate(0.029965,0.040216)%22><line x1=%220%22 y1=%220%22 x2=%220.063675%22 y2=%220.063675%22 style=%22stroke:%23500080;stroke-width:0.010613%22 /><line x1=%22-0.031838%22 y1=%220.031838%22 x2=%220.031838%22 y2=%220.095513%22 style=%22stroke:%23500080;stroke-width:0.010613%22 /><line x1=%220.031838%22 y1=%22-0.031838%22 x2=%220.095513%22 y2=%220.031838%22 style=%22stroke:%23500080;stroke-width:0.010613%22 /><line x1=%220.063675%22 y1=%220%22 x2=%220%22 y2=%220.063675%22 style=%22stroke:%23500080;stroke-width:0.010613%22 /><line x1=%220.095513%22 y1=%220.031838%22 x2=%220.031838%22 y2=%220.095513%22 style=%22stroke:%23500080;stroke-width:0.010613%22 /><line x1=%220.031838%22 y1=%22-0.031838%22 x2=%22-0.031838%22 y2=%220.031838%22 style=%22stroke:%23500080;stroke-width:0.010613%22 /></pattern><pattern id=%22pat-layer_403_3%22 patternUnits=%22userSpaceOnUse%22 width=%220.106125%22 height=%220.106125%22 patternTransform=%22translate(0.024971,0.083783)%22><line x1=%220%22 y1=%220%22 x2=%220.106125%22 y2=%220.106125%22 style=%22stroke:%23500080;stroke-width:0.010613%22 /><line x1=%22-0.053063%22 y1=%220.053063%22 x2=%220.053063%22 y2=%220.159188%22 style=%22stroke:%23500080;stroke-width:0.010613%22 /><line x1=%220.053063%22 y1=%22-0.053063%22 x2=%220.159188%22 y2=%220.053063%22 style=%22stroke:%23500080;stroke-width:0.010613%22 /><line x1=%220.106125%22 y1=%220%22 x2=%220%22 y2=%220.106125%22 style=%22stroke:%23500080;stroke-width:0.010613%22 /><line x1=%220.159188%22 y1=%220.053063%22 x2=%220.053063%22 y2=%220.159188%22 style=%22stroke:%23500080;stroke-width:0.010613%22 /><line x1=%220.053063%22 y1=%22-0.053063%22 x2=%22-0.053063%22 y2=%220.053063%22 style=%22stroke:%23500080;stroke-width:0.010613%22 /></pattern><pattern id=%22pat-layer_403_1%22 patternUnits=%22userSpaceOnUse%22 width=%220.106125%22 height=%220.106125%22 patternTransform=%22translate(0.074912,0.050270)%22><line x1=%220.053063%22 y1=%220%22 x2=%220.053063%22 y2=%220.106125%22 style=%22stroke:%23500080;stroke-width:0.010613%22 /><line x1=%220%22 y1=%220.053063%22 x2=%220.106125%22 y2=%220.053063%22 style=%22stroke:%23500080;stroke-width:0.010613%22 /></pattern><pattern id=%22pat-layer_403_0%22 patternUnits=%22userSpaceOnUse%22 width=%220.063675%22 height=%220.063675%22 patternTransform=%22translate(0.059929,0.020108)%22><line x1=%220.031838%22 y1=%220%22 x2=%220.031838%22 y2=%220.063675%22 style=%22stroke:%23500080;stroke-width:0.010613%22 /><line x1=%220%22 y1=%220.031838%22 x2=%220.063675%22 y2=%220.031838%22 style=%22stroke:%23500080;stroke-width:0.010613%22 /></pattern><pattern id=%22pat-layer_311_1%22 patternUnits=%22userSpaceOnUse%22 width=%220.106125%22 height=%220.106125%22 patternTransform=%22translate(0.087397,0.022342)%22><line x1=%220%22 y1=%220%22 x2=%220.106125%22 y2=%220.106125%22 style=%22stroke:%23ac6c56;stroke-width:0.010613%22 /><line x1=%22-0.053063%22 y1=%220.053063%22 x2=%220.053063%22 y2=%220.159188%22 style=%22stroke:%23ac6c56;stroke-width:0.010613%22 /><line x1=%220.053063%22 y1=%22-0.053063%22 x2=%220.159188%22 y2=%220.053063%22 style=%22stroke:%23ac6c56;stroke-width:0.010613%22 /></pattern><pattern id=%22pat-layer_311_0%22 patternUnits=%22userSpaceOnUse%22 width=%220.063675%22 height=%220.063675%22 patternTransform=%22translate(0.003746,0.003351)%22><line x1=%220%22 y1=%220%22 x2=%220.063675%22 y2=%220.063675%22 style=%22stroke:%23ac6c56;stroke-width:0.010613%22 /><line x1=%22-0.031838%22 y1=%220.031838%22 x2=%220.031838%22 y2=%220.095513%22 style=%22stroke:%23ac6c56;stroke-width:0.010613%22 /><line x1=%220.031838%22 y1=%22-0.031838%22 x2=%220.095513%22 y2=%220.031838%22 style=%22stroke:%23ac6c56;stroke-width:0.010613%22 /></pattern><pattern id=%22pat-layer_301_1%22 patternUnits=%22userSpaceOnUse%22 width=%220.106125%22 height=%220.106125%22 patternTransform=%22translate(0.074912,0.044684)%22><line x1=%220%22 y1=%220.053063%22 x2=%220.106125%22 y2=%220.053063%22 style=%22stroke:%23800057;stroke-width:0.010613%22 /></pattern><pattern id=%22pat-layer_301_0%22 patternUnits=%22userSpaceOnUse%22 width=%220.063675%22 height=%220.063675%22 patternTransform=%22translate(0.059929,0.016757)%22><line x1=%220%22 y1=%220.031838%22 x2=%220.063675%22 y2=%220.031838%22 style=%22stroke:%23800057;stroke-width:0.010613%22 /></pattern><pattern id=%22pat-layer_305_1%22 patternUnits=%22userSpaceOnUse%22 width=%220.106125%22 height=%220.106125%22 patternTransform=%22translate(0.037456,0.078197)%22><line x1=%220.053063%22 y1=%220%22 x2=%220.053063%22 y2=%220.106125%22 style=%22stroke:%23808080;stroke-width:0.010613%22 /><line x1=%220%22 y1=%220.053063%22 x2=%220.106125%22 y2=%220.053063%22 style=%22stroke:%23808080;stroke-width:0.010613%22 /></pattern><pattern id=%22pat-layer_305_0%22 patternUnits=%22userSpaceOnUse%22 width=%220.063675%22 height=%220.063675%22 patternTransform=%22translate(0.037456,0.036864)%22><line x1=%220.031838%22 y1=%220%22 x2=%220.031838%22 y2=%220.063675%22 style=%22stroke:%23808080;stroke-width:0.010613%22 /><line x1=%220%22 y1=%220.031838%22 x2=%220.063675%22 y2=%220.031838%22 style=%22stroke:%23808080;stroke-width:0.010613%22 /></pattern><pattern id=%22pat-layer_999_0%22 patternUnits=%22userSpaceOnUse%22 width=%220.063675%22 height=%220.063675%22 patternTransform=%22translate(0.022474,0.023459)%22><line x1=%220.031838%22 y1=%220%22 x2=%220.031838%22 y2=%220.063675%22 style=%22stroke:%230000ff;stroke-width:0.010613%22 /></pattern><pattern id=%22pat-layer_81_0%22 patternUnits=%22userSpaceOnUse%22 width=%220.063675%22 height=%220.063675%22 patternTransform=%22translate(0.022474,0.056972)%22><line x1=%220.031838%22 y1=%220%22 x2=%220.031838%22 y2=%220.063675%22 style=%22stroke:%23808080;stroke-width:0.010613%22 /><line x1=%220%22 y1=%220.031838%22 x2=%220.063675%22 y2=%220.031838%22 style=%22stroke:%23808080;stroke-width:0.010613%22 /></pattern><pattern id=%22pat-layer_205_0%22 patternUnits=%22userSpaceOnUse%22 width=%220.063675%22 height=%220.063675%22 patternTransform=%22translate(0.026219,0.043567)%22><line x1=%220%22 y1=%220%22 x2=%220.063675%22 y2=%220.063675%22 style=%22stroke:%2349b203;stroke-width:0.010613%22 /><line x1=%22-0.031838%22 y1=%220.031838%22 x2=%220.031838%22 y2=%220.095513%22 style=%22stroke:%2349b203;stroke-width:0.010613%22 /><line x1=%220.031838%22 y1=%22-0.031838%22 x2=%220.095513%22 y2=%220.031838%22 style=%22stroke:%2349b203;stroke-width:0.010613%22 /><line x1=%220.063675%22 y1=%220%22 x2=%220%22 y2=%220.063675%22 style=%22stroke:%2349b203;stroke-width:0.010613%22 /><line x1=%220.095513%22 y1=%220.031838%22 x2=%220.031838%22 y2=%220.095513%22 style=%22stroke:%2349b203;stroke-width:0.010613%22 /><line x1=%220.031838%22 y1=%22-0.031838%22 x2=%22-0.031838%22 y2=%220.031838%22 style=%22stroke:%2349b203;stroke-width:0.010613%22 /></pattern><pattern id=%22pat-layer_11_0%22 patternUnits=%22userSpaceOnUse%22 width=%220.063675%22 height=%220.063675%22 patternTransform=%22translate(0.033710,0.023459)%22><line x1=%220.063675%22 y1=%220%22 x2=%220%22 y2=%220.063675%22 style=%22stroke:%230000ff;stroke-width:0.010613%22 /><line x1=%220.095513%22 y1=%220.031838%22 x2=%220.031838%22 y2=%220.095513%22 style=%22stroke:%230000ff;stroke-width:0.010613%22 /><line x1=%220.031838%22 y1=%22-0.031838%22 x2=%22-0.031838%22 y2=%220.031838%22 style=%22stroke:%230000ff;stroke-width:0.010613%22 /></pattern><pattern id=%22pat-layer_12_0%22 patternUnits=%22userSpaceOnUse%22 width=%220.063675%22 height=%220.063675%22 patternTransform=%22translate(0.059929,0.060324)%22><line x1=%220%22 y1=%220%22 x2=%220.063675%22 y2=%220.063675%22 style=%22stroke:%23a57b00;stroke-width:0.010613%22 /><line x1=%22-0.031838%22 y1=%220.031838%22 x2=%220.031838%22 y2=%220.095513%22 style=%22stroke:%23a57b00;stroke-width:0.010613%22 /><line x1=%220.031838%22 y1=%22-0.031838%22 x2=%220.095513%22 y2=%220.031838%22 style=%22stroke:%23a57b00;stroke-width:0.010613%22 /></pattern><pattern id=%22pat-layer_13_0%22 patternUnits=%22userSpaceOnUse%22 width=%220.063675%22 height=%220.063675%22 patternTransform=%22translate(0.022474,0.033513)%22><line x1=%220.063675%22 y1=%220%22 x2=%220%22 y2=%220.063675%22 style=%22stroke:%23800057;stroke-width:0.010613%22 /><line x1=%220.095513%22 y1=%220.031838%22 x2=%220.031838%22 y2=%220.095513%22 style=%22stroke:%23800057;stroke-width:0.010613%22 /><line x1=%220.031838%22 y1=%22-0.031838%22 x2=%22-0.031838%22 y2=%220.031838%22 style=%22stroke:%23800057;stroke-width:0.010613%22 /></pattern><pattern id=%22pat-layer_6_0%22 patternUnits=%22userSpaceOnUse%22 width=%220.106125%22 height=%220.106125%22 patternTransform=%22translate(0.049941,0.050270)%22><line x1=%220%22 y1=%220.053063%22 x2=%220.106125%22 y2=%220.053063%22 style=%22stroke:%23ff0000;stroke-width:0.010613%22 /></pattern><pattern id=%22pat-layer_1_10%22 patternUnits=%22userSpaceOnUse%22 width=%220.063675%22 height=%220.063675%22 patternTransform=%22translate(0.003746,0.010054)%22><line x1=%220%22 y1=%220%22 x2=%220.063675%22 y2=%220.063675%22 style=%22stroke:%23c96585;stroke-width:0.010613%22 /><line x1=%22-0.031838%22 y1=%220.031838%22 x2=%220.031838%22 y2=%220.095513%22 style=%22stroke:%23c96585;stroke-width:0.010613%22 /><line x1=%220.031838%22 y1=%22-0.031838%22 x2=%220.095513%22 y2=%220.031838%22 style=%22stroke:%23c96585;stroke-width:0.010613%22 /><line x1=%220.063675%22 y1=%220%22 x2=%220%22 y2=%220.063675%22 style=%22stroke:%23c96585;stroke-width:0.010613%22 /><line x1=%220.095513%22 y1=%220.031838%22 x2=%220.031838%22 y2=%220.095513%22 style=%22stroke:%23c96585;stroke-width:0.010613%22 /><line x1=%220.031838%22 y1=%22-0.031838%22 x2=%22-0.031838%22 y2=%220.031838%22 style=%22stroke:%23c96585;stroke-width:0.010613%22 /></pattern><pattern id=%22pat-layer_1_11%22 patternUnits=%22userSpaceOnUse%22 width=%220.106125%22 height=%220.106125%22 patternTransform=%22translate(0.087397,0.033513)%22><line x1=%220.053063%22 y1=%220%22 x2=%220.053063%22 y2=%220.106125%22 style=%22stroke:%23800000;stroke-width:0.010613%22 /><line x1=%220%22 y1=%220.053063%22 x2=%220.106125%22 y2=%220.053063%22 style=%22stroke:%23800000;stroke-width:0.010613%22 /></pattern><pattern id=%22pat-layer_200_0%22 patternUnits=%22userSpaceOnUse%22 width=%220.106125%22 height=%220.106125%22 patternTransform=%22translate(0.037456,0.083783)%22><line x1=%220%22 y1=%220%22 x2=%220.106125%22 y2=%220.106125%22 style=%22stroke:%23ff0000;stroke-width:0.010613%22 /><line x1=%22-0.053063%22 y1=%220.053063%22 x2=%220.053063%22 y2=%220.159188%22 style=%22stroke:%23ff0000;stroke-width:0.010613%22 /><line x1=%220.053063%22 y1=%22-0.053063%22 x2=%220.159188%22 y2=%220.053063%22 style=%22stroke:%23ff0000;stroke-width:0.010613%22 /><line x1=%220.106125%22 y1=%220%22 x2=%220%22 y2=%220.106125%22 style=%22stroke:%23ff0000;stroke-width:0.010613%22 /><line x1=%220.159188%22 y1=%220.053063%22 x2=%220.053063%22 y2=%220.159188%22 style=%22stroke:%23ff0000;stroke-width:0.010613%22 /><line x1=%220.053063%22 y1=%22-0.053063%22 x2=%22-0.053063%22 y2=%220.053063%22 style=%22stroke:%23ff0000;stroke-width:0.010613%22 /></pattern><pattern id=%22pat-layer_1_0%22 patternUnits=%22userSpaceOnUse%22 width=%220.063675%22 height=%220.063675%22 patternTransform=%22translate(0.026219,0.036864)%22><line x1=%220.063675%22 y1=%220%22 x2=%220%22 y2=%220.063675%22 style=%22stroke:%23c96585;stroke-width:0.010613%22 /><line x1=%220.095513%22 y1=%220.031838%22 x2=%220.031838%22 y2=%220.095513%22 style=%22stroke:%23c96585;stroke-width:0.010613%22 /><line x1=%220.031838%22 y1=%22-0.031838%22 x2=%22-0.031838%22 y2=%220.031838%22 style=%22stroke:%23c96585;stroke-width:0.010613%22 /></pattern><pattern id=%22pat-layer_2_0%22 patternUnits=%22userSpaceOnUse%22 width=%220.106125%22 height=%220.106125%22 patternTransform=%22translate(0.087397,0.016757)%22><line x1=%220%22 y1=%220%22 x2=%220.106125%22 y2=%220.106125%22 style=%22stroke:%23a46eda;stroke-width:0.010613%22 /><line x1=%22-0.053063%22 y1=%220.053063%22 x2=%220.053063%22 y2=%220.159188%22 style=%22stroke:%23a46eda;stroke-width:0.010613%22 /><line x1=%220.053063%22 y1=%22-0.053063%22 x2=%220.159188%22 y2=%220.053063%22 style=%22stroke:%23a46eda;stroke-width:0.010613%22 /></pattern><pattern id=%22pat-layer_20_0%22 patternUnits=%22userSpaceOnUse%22 width=%220.106125%22 height=%220.106125%22 patternTransform=%22translate(0.024971,0.061441)%22><line x1=%220%22 y1=%220.053063%22 x2=%220.106125%22 y2=%220.053063%22 style=%22stroke:%2353793d;stroke-width:0.010613%22 /></pattern><pattern id=%22pat-layer_22_0%22 patternUnits=%22userSpaceOnUse%22 width=%220.106125%22 height=%220.106125%22 patternTransform=%22translate(0.006243,0.078197)%22><line x1=%220%22 y1=%220%22 x2=%220.106125%22 y2=%220.106125%22 style=%22stroke:%23ec7600;stroke-width:0.010613%22 /><line x1=%22-0.053063%22 y1=%220.053063%22 x2=%220.053063%22 y2=%220.159188%22 style=%22stroke:%23ec7600;stroke-width:0.010613%22 /><line x1=%220.053063%22 y1=%22-0.053063%22 x2=%220.159188%22 y2=%220.053063%22 style=%22stroke:%23ec7600;stroke-width:0.010613%22 /><line x1=%220.106125%22 y1=%220%22 x2=%220%22 y2=%220.106125%22 style=%22stroke:%23ec7600;stroke-width:0.010613%22 /><line x1=%220.159188%22 y1=%220.053063%22 x2=%220.053063%22 y2=%220.159188%22 style=%22stroke:%23ec7600;stroke-width:0.010613%22 /><line x1=%220.053063%22 y1=%22-0.053063%22 x2=%22-0.053063%22 y2=%220.053063%22 style=%22stroke:%23ec7600;stroke-width:0.010613%22 /></pattern><pattern id=%22pat-layer_24_0%22 patternUnits=%22userSpaceOnUse%22 width=%220.106125%22 height=%220.106125%22 patternTransform=%22translate(0.093640,0.094954)%22><line x1=%220.053063%22 y1=%220%22 x2=%220.053063%22 y2=%220.106125%22 style=%22stroke:%2300b8b8;stroke-width:0.010613%22 /><line x1=%220%22 y1=%220.053063%22 x2=%220.106125%22 y2=%220.053063%22 style=%22stroke:%2300b8b8;stroke-width:0.010613%22 /></pattern><pattern id=%22pat-layer_21_0%22 patternUnits=%22userSpaceOnUse%22 width=%220.063675%22 height=%220.063675%22 patternTransform=%22translate(0.041201,0.010054)%22><line x1=%220%22 y1=%220.031838%22 x2=%220.063675%22 y2=%220.031838%22 style=%22stroke:%23736264;stroke-width:0.010613%22 /></pattern><pattern id=%22pat-layer_23_0%22 patternUnits=%22userSpaceOnUse%22 width=%220.063675%22 height=%220.063675%22 patternTransform=%22translate(0.029965,0.020108)%22><line x1=%220%22 y1=%220%22 x2=%220.063675%22 y2=%220.063675%22 style=%22stroke:%23697a00;stroke-width:0.010613%22 /><line x1=%22-0.031838%22 y1=%220.031838%22 x2=%220.031838%22 y2=%220.095513%22 style=%22stroke:%23697a00;stroke-width:0.010613%22 /><line x1=%220.031838%22 y1=%22-0.031838%22 x2=%220.095513%22 y2=%220.031838%22 style=%22stroke:%23697a00;stroke-width:0.010613%22 /><line x1=%220.063675%22 y1=%220%22 x2=%220%22 y2=%220.063675%22 style=%22stroke:%23697a00;stroke-width:0.010613%22 /><line x1=%220.095513%22 y1=%220.031838%22 x2=%220.031838%22 y2=%220.095513%22 style=%22stroke:%23697a00;stroke-width:0.010613%22 /><line x1=%220.031838%22 y1=%22-0.031838%22 x2=%22-0.031838%22 y2=%220.031838%22 style=%22stroke:%23697a00;stroke-width:0.010613%22 /></pattern><pattern id=%22pat-layer_25_0%22 patternUnits=%22userSpaceOnUse%22 width=%220.063675%22 height=%220.063675%22 patternTransform=%22translate(0.018728,0.030162)%22><line x1=%220.031838%22 y1=%220%22 x2=%220.031838%22 y2=%220.063675%22 style=%22stroke:%23008000;stroke-width:0.010613%22 /><line x1=%220%22 y1=%220.031838%22 x2=%220.063675%22 y2=%220.031838%22 style=%22stroke:%23008000;stroke-width:0.010613%22 /></pattern><pattern id=%22pat-layer_350_0%22 patternUnits=%22userSpaceOnUse%22 width=%220.106125%22 height=%220.106125%22 patternTransform=%22translate(0.012485,0.067026)%22><line x1=%220.106125%22 y1=%220%22 x2=%220%22 y2=%220.106125%22 style=%22stroke:%23697a00;stroke-width:0.010613%22 /><line x1=%220.159188%22 y1=%220.053063%22 x2=%220.053063%22 y2=%220.159188%22 style=%22stroke:%23697a00;stroke-width:0.010613%22 /><line x1=%220.053063%22 y1=%22-0.053063%22 x2=%22-0.053063%22 y2=%220.053063%22 style=%22stroke:%23697a00;stroke-width:0.010613%22 /></pattern><pattern id=%22pat-layer_203_0%22 patternUnits=%22userSpaceOnUse%22 width=%220.106125%22 height=%220.106125%22 patternTransform=%22translate(0.062426,0.055855)%22><line x1=%220.106125%22 y1=%220%22 x2=%220%22 y2=%220.106125%22 style=%22stroke:%23008000;stroke-width:0.010613%22 /><line x1=%220.159188%22 y1=%220.053063%22 x2=%220.053063%22 y2=%220.159188%22 style=%22stroke:%23008000;stroke-width:0.010613%22 /><line x1=%220.053063%22 y1=%22-0.053063%22 x2=%22-0.053063%22 y2=%220.053063%22 style=%22stroke:%23008000;stroke-width:0.010613%22 /></pattern><pattern id=%22pat-layer_40_0%22 patternUnits=%22userSpaceOnUse%22 width=%220.106125%22 height=%220.106125%22 patternTransform=%22translate(0.049941,0.016757)%22><circle cx=%220.053063%22 cy=%220.053063%22 r=%220.010613%22 style=%22stroke:none;fill:%230000ff;fill-opacity:1.0%22 /></pattern><pattern id=%22pat-layer_401_2%22 patternUnits=%22userSpaceOnUse%22 width=%220.063675%22 height=%220.063675%22 patternTransform=%22translate(0.041201,0.030162)%22><line x1=%220%22 y1=%220.031838%22 x2=%220.063675%22 y2=%220.031838%22 style=%22stroke:%236a8ad2;stroke-width:0.010613%22 /></pattern><pattern id=%22pat-layer_301_2%22 patternUnits=%22userSpaceOnUse%22 width=%220.063675%22 height=%220.063675%22 patternTransform=%22translate(0.029965,0.036864)%22><line x1=%220.031838%22 y1=%220%22 x2=%220.031838%22 y2=%220.063675%22 style=%22stroke:%23800057;stroke-width:0.010613%22 /></pattern><g id=%22C1%22 data-name=%22Grating%22><use transform=%22translate(0.000000 0.000000)%22 href=%22%23C3%22 /><use transform=%22translate(0.300000 0.000000)%22 href=%22%23C3%22 /><use transform=%22translate(0.600000 0.000000)%22 href=%22%23C3%22 /><use transform=%22translate(0.900000 0.000000)%22 href=%22%23C3%22 /><use transform=%22translate(1.200000 0.000000)%22 href=%22%23C3%22 /><use transform=%22translate(1.500000 0.000000)%22 href=%22%23C3%22 /><use transform=%22translate(1.800000 0.000000)%22 href=%22%23C3%22 /><use transform=%22translate(2.100000 0.000000)%22 href=%22%23C3%22 /><use transform=%22translate(2.400000 0.000000)%22 href=%22%23C3%22 /><use transform=%22translate(2.700000 0.000000)%22 href=%22%23C3%22 /><use transform=%22translate(3.000000 0.000000)%22 href=%22%23C3%22 /><use transform=%22translate(3.300000 0.000000)%22 href=%22%23C3%22 /><use transform=%22translate(3.600000 0.000000)%22 href=%22%23C3%22 /><use transform=%22translate(3.900000 0.000000)%22 href=%22%23C3%22 /><use transform=%22translate(4.200000 0.000000)%22 href=%22%23C3%22 /><use transform=%22translate(4.500000 0.000000)%22 href=%22%23C3%22 /><use transform=%22translate(4.800000 0.000000)%22 href=%22%23C3%22 /><use transform=%22translate(5.100000 0.000000)%22 href=%22%23C3%22 /><use transform=%22translate(5.400000 0.000000)%22 href=%22%23C3%22 /><use transform=%22translate(5.700000 0.000000)%22 href=%22%23C3%22 /></g><g id=%22C2%22 data-name=%22Defect%22><rect class=%22layer_1_0%22 x=%22-0.125000%22 y=%22-0.417500%22 width=%220.250000%22 height=%220.835000%22 /><rect class=%22layer_1_0%22 x=%22-0.225000%22 y=%22-0.227500%22 width=%220.450000%22 height=%220.455000%22 /><rect class=%22layer_2_0%22 x=%22-0.225000%22 y=%22-1.500000%22 width=%220.450000%22 height=%223.000000%22 /></g><g id=%22C3%22 data-name=%22Grating Unit Cell%22><rect class=%22layer_1_0%22 x=%22-0.050000%22 y=%22-0.417500%22 width=%220.100000%22 height=%220.835000%22 /><rect class=%22layer_1_0%22 x=%22-0.150000%22 y=%22-0.227500%22 width=%220.300000%22 height=%220.455000%22 /><rect class=%22layer_2_0%22 x=%22-0.150000%22 y=%22-1.500000%22 width=%220.300000%22 height=%223.000000%22 /></g></defs><g transform=%22scale(1 -1)%22><g id=%22C0%22 data-name=%22Supercell%22><use transform=%22translate(0.000000 0.000000)%22 href=%22%23C1%22 /><use transform=%22translate(6.075000 0.000000)%22 href=%22%23C2%22 /><use transform=%22translate(6.450000 0.000000)%22 href=%22%23C1%22 /><g transform=%22translate(-0.150000 0.000500) rotate(0.000000)%22><path class=%22port%22 d=%22M 0,-1.250000 V 1.250000%22 /><use href=%22%23port-symbol%22 /></g><text class=%22label%22 text-anchor=%22start%22 dominant-baseline=%22text-after-edge%22 x=%22-0.150000%22 y=%22-0.000500%22>P0</text><g transform=%22translate(12.300000 0.000500) rotate(180.000000)%22><path class=%22port%22 d=%22M 0,-1.250000 V 1.250000%22 /><use href=%22%23port-symbol%22 /></g><text class=%22label%22 text-anchor=%22end%22 dominant-baseline=%22text-before-edge%22 x=%2212.300000%22 y=%22-0.000500%22>P1</text></g></g></svg>)
%22><use href=%22%23g-grating_coupler%22 transform=%22translate(-30.00 -30.00) scale(1.2)%22/><circle cx=%22-30.00%22 cy=%220.00%22 r=%224%22 fill=%22%2300643c%22 stroke=%22%2300643c%22 stroke-width=%221%22/><circle cx=%2230.00%22 cy=%220.00%22 r=%224%22 fill=%22%2300643c%22 stroke=%22%2300643c%22 stroke-width=%221%22/></g><text x=%220.00%22 y=%2231.80%22 font-size=%229%22 fill=%22%23232530%22 font-weight=%22400%22 text-anchor=%22middle%22 dominant-baseline=%22hanging%22 stroke=%22%23ffffff%22 stroke-width=%223.15%22 stroke-linejoin=%22round%22 paint-order=%22stroke%22>Grating_1</text><text x=%22-42.00%22 y=%220.00%22 font-size=%2210%22 fill=%22%23b8461c%22 font-weight=%22700%22 text-anchor=%22end%22 dominant-baseline=%22middle%22 stroke=%22%23ffffff%22 stroke-width=%223.50%22 stroke-linejoin=%22round%22 paint-order=%22stroke%22>P0</text><g transform=%22matrix(1 -0 0 1 192.000 0.000)%22><rect x=%22-30.00%22 y=%22-30.00%22 width=%2260.00%22 height=%2260.00%22 fill=%22%23f4f5f7%22 stroke=%22%23232530%22 stroke-width=%221%22/><circle cx=%22-30.00%22 cy=%220.00%22 r=%224%22 fill=%22%2300643c%22 stroke=%22%2300643c%22 stroke-width=%221%22/><circle cx=%2230.00%22 cy=%220.00%22 r=%224%22 fill=%22%2300643c%22 stroke=%22%2300643c%22 stroke-width=%221%22/></g><text x=%22165.25%22 y=%220.00%22 font-size=%226.5%22 fill=%22%23434756%22 font-weight=%22400%22 text-anchor=%22start%22 dominant-baseline=%22middle%22 stroke=%22%23ffffff%22 stroke-width=%222.27%22 stroke-linejoin=%22round%22 paint-order=%22stroke%22>P0</text><text x=%22218.75%22 y=%220.00%22 font-size=%226.5%22 fill=%22%23434756%22 font-weight=%22400%22 text-anchor=%22end%22 dominant-baseline=%22middle%22 stroke=%22%23ffffff%22 stroke-width=%222.27%22 stroke-linejoin=%22round%22 paint-order=%22stroke%22>P1</text><text x=%22192.00%22 y=%220.00%22 font-size=%226.5%22 fill=%22%23232530%22 font-weight=%22400%22 text-anchor=%22middle%22 dominant-baseline=%22middle%22 stroke=%22%23ffffff%22 stroke-width=%222.27%22 stroke-linejoin=%22round%22 paint-order=%22stroke%22>Defect</text><text x=%22192.00%22 y=%2231.80%22 font-size=%229%22 fill=%22%23232530%22 font-weight=%22400%22 text-anchor=%22middle%22 dominant-baseline=%22hanging%22 stroke=%22%23ffffff%22 stroke-width=%223.15%22 stroke-linejoin=%22round%22 paint-order=%22stroke%22>Defect_1</text><g transform=%22matrix(1 -0 0 1 384.000 0.000)%22><use href=%22%23g-grating_coupler%22 transform=%22translate(-30.00 -30.00) scale(1.2)%22/><circle cx=%22-30.00%22 cy=%220.00%22 r=%224%22 fill=%22%2300643c%22 stroke=%22%2300643c%22 stroke-width=%221%22/><circle cx=%2230.00%22 cy=%220.00%22 r=%224%22 fill=%22%2300643c%22 stroke=%22%2300643c%22 stroke-width=%221%22/></g><text x=%22384.00%22 y=%2231.80%22 font-size=%229%22 fill=%22%23232530%22 font-weight=%22400%22 text-anchor=%22middle%22 dominant-baseline=%22hanging%22 stroke=%22%23ffffff%22 stroke-width=%223.15%22 stroke-linejoin=%22round%22 paint-order=%22stroke%22>Grating_2</text><text x=%22426.00%22 y=%220.00%22 font-size=%2210%22 fill=%22%23b8461c%22 font-weight=%22700%22 text-anchor=%22start%22 dominant-baseline=%22middle%22 stroke=%22%23ffffff%22 stroke-width=%223.50%22 stroke-linejoin=%22round%22 paint-order=%22stroke%22>P1</text><g fill=%22none%22 stroke-width=%222%22></g></svg>)
CROW Construction and Transmission Simulation
Section titled “CROW Construction and Transmission Simulation”We now construct the full CROW by periodically repeating the supercell that contains the defect cavity and its Bragg mirrors. The effective period of this CROW is the physical length of the supercell, given by
,
where the first term accounts for the two mirror sections and the second term is the defect cell.
We then:
- Instantiate a grating-like structure whose unit cell is the supercell, repeated times.
- Activate the circuit model of this composite structure.
- Compute the S-parameters over the frequency sweep and plot the transmission in dB.
# Effective length of the supercell (two mirrors plus defect)sc_length = 2 * Np * a_lattice + a_defect
# Create the CROW by repeating the supercell as the new unit cellcrow = create_grating(Np=Nr, a_lattice=sc_length, unit_cell=sc)
# Activate the circuit model for the CROWcrow.activate_model("Circuit Model")
# Compute S-parameters of the CROW over the frequency sweeps_matrix_crow = crow.s_matrix(frequencies=freqs)
# Plot the S-matrix transmission in dB between input and output ports_ = pf.plot_s_matrix(s_matrix_crow, y="dB", input_ports=["P0"], output_ports=["P1"])
Uploading task 'P0@0…'Uploading task 'P0@0…'Starting task 'P0@0': https://tidy3d.simulation.cloud/workbench?taskId=fdve-ae9f8dc0-027f-487e-986b-bc37edf4663eStarting task 'P0@0': https://tidy3d.simulation.cloud/workbench?taskId=fdve-91582298-c95c-4096-b459-1e7a13369760Downloading data from 'P0@0'…Downloading data from 'P0@0'…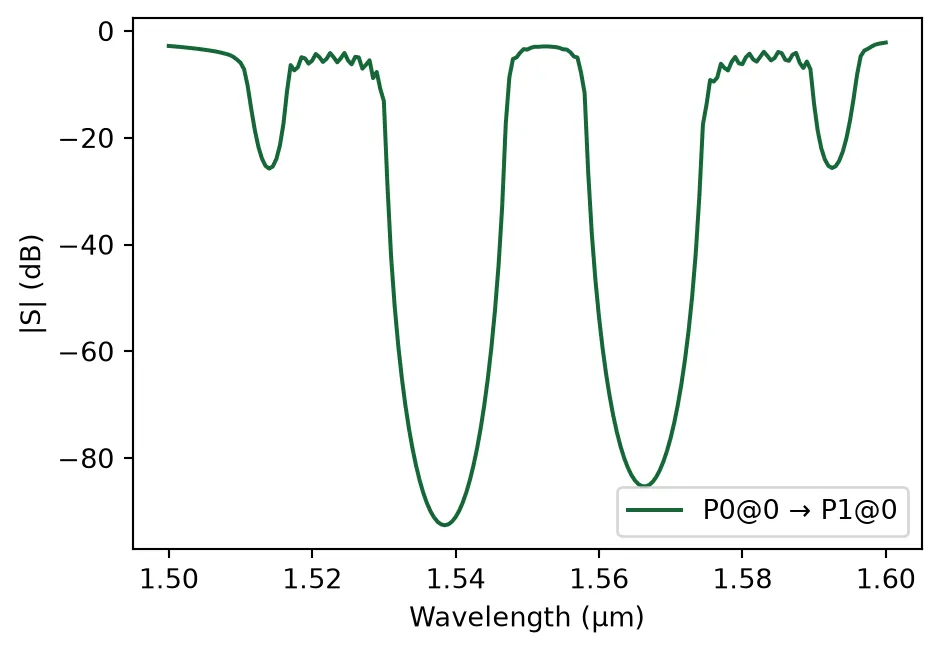
CROW Band Structure and Group Index
Section titled “CROW Band Structure and Group Index”Now, we extract the dispersion relation and group index of a single CROW supercell and compare the results against the reference data from the paper.
We treat one supercell (defect cavity plus mirrors) as the periodic unit cell and apply the same S-parameter–based retrieval used for the photonic crystal waveguide:
- We build a CROW structure with one supercell and compute its S-parameters using the circuit model.
- Using the
calculate_bandstructurefunction, we retrieve the normalized Bloch wavevector and the corresponding group index for this CROW unit cell. - We then compare the resulting band diagram (wavelength vs. normalized wavevector) with the digitized data from the paper.
Np_0 = 1crow_0 = create_grating(Np=Np_0, a_lattice=sc_length, unit_cell=sc)crow_0.activate_model("Circuit Model")s_matrix_crow_0 = crow_0.s_matrix(frequencies=freqs)
k_band, _, ng_crow = calculate_bandstructure(    freqs=freqs,    s11=s_matrix_crow_0[("P0@0", "P0@0")],    s21=s_matrix_crow_0[("P0@0", "P1@0")],    L_device=Np_0 * sc_length,    a_lattice=sc_length,    n_eff_approx=n_eff,)
# Data from the paper (Fig. 1D)paper_k = np.array(    [        0.99776,        0.80313,        0.59843,        0.39597,        0.19799,        0.00224,        0.00112,        0.19575,        0.39597,        0.60179,        0.80761,        0.99776,        0.99776,        0.80761,        0.59732,        0.39597,        0.20022,        0.00336,    ])
paper_wavelengths = np.array(    [        1.51258,        1.51491,        1.51877,        1.52249,        1.52558,        1.52699,        1.54402,        1.54522,        1.54764,        1.55114,        1.55402,        1.55537,        1.57270,        1.57411,        1.57736,        1.58169,        1.58632,        1.58880,    ])
fig, (ax1, ax2) = plt.subplots(1, 2, figsize=(12, 5))
# Plot Band Structure (Dispersion Relation)ax1.plot(k_band * 2, wavelengths, ".-", color="green", label="Circuit Model")ax1.plot(paper_k, paper_wavelengths, "x", color="red", label="Paper Data")ax1.legend()ax1.set_xlabel("Wavevector ($k L / \\pi$)")ax1.set_ylabel("Wavelength ($\\mu m$)")ax1.grid(True)
# Plot Group Indexax2.plot(ng_crow, wavelengths, "r.-")ax2.set_ylabel("Wavelength ($\\mu m$)")ax2.set_xlabel("Group Index")ax2.grid(True)
plt.tight_layout()plt.show()
Auto-calibration: Added 21 * 2pi cycles to match n_eff=2.521032303168735