

Analytic Waveguide Crossing Model

This guide covers pf.CrossingModel, which provides a compact analytic S-matrix
for a 4-port waveguide crossing. It captures:
| Feature | Parameter |
|---|---|
| Transmission (straight-through) | t |
| Cross-coupling (between arms) | x |
| Back-reflection | r |
| Dispersion (propagation phase) | propagation_length, n_eff, n_group |
| Frequency dependence | Interpolator for any of the above |
All parameters can be complex scalars or pf.Interpolator objects for
broadband characterization from measurement or FDTD simulation.
S-matrix Structure
Section titled “S-matrix Structure”For a crossing with ports numbered as shown below,
P3 (top) |P0 -------+------- P2 | P1 (bottom)the 4×4 S-matrix is
where is the straight-through transmission (P0→P2 or P1→P3), is the cross-coupling between arms (P0→P1), and is the back-reflection (P0→P0).
The common phase factor models propagation through the crossing:
where is propagation_length. Setting (the default) removes
the dispersive phase term.
import matplotlib.pyplot as pltimport numpy as npimport photonforge as pffrom photonforge.utils import C_0
pf.config.default_technology = pf.basic_technology()
C = C_0  # speed of light in µm/slam0 = 1.55  # µmf0 = C / lam0
lam = np.linspace(1.50, 1.60, 1001)freqs = C / lam
Transmission, Cross-coupling, and Reflection
Section titled “Transmission, Cross-coupling, and Reflection”Typical silicon-photonics crossing parameters at 1550 nm:
| Parameter | Symbol | Typical value |
|---|---|---|
| Insertion loss | IL | 0.2 - 0.5 dB |
| Cross-talk | XT | −30 to −35 dB |
| Return loss | RL | −40 to −50 dB |
These are power quantities; CrossingModel takes the corresponding field
amplitudes , etc.
IL_dB = 0.5   # insertion loss (dB)XT_dB = -30   # cross-talk (dB)RL_dB = -40   # return loss (dB)
# Convert to field amplitudest = np.sqrt(10 ** (-IL_dB / 10))x = np.sqrt(10 ** (XT_dB / 10))r = np.sqrt(10 ** (RL_dB / 10))print(f"Field amplitudes:  t={t:.4f}  x={x:.5f}  r={r:.5f}")
crossing = pf.CrossingModel(t=t, x=x, r=r)bb = crossing.black_box_component(port_spec="Strip")s = bb.s_matrix(freqs)
fig, ax = plt.subplots(figsize=(7, 3.5))specs = [    ("Transmission (P0→P2)", ("P0@0", "P2@0")),    ("Cross-talk (P0→P1)",   ("P0@0", "P1@0")),    ("Reflection (P0→P0)",   ("P0@0", "P0@0")),]for label, ports in specs:    T = np.abs(s[ports]) ** 2    ax.plot(lam * 1e3, 10 * np.log10(T), label=label, lw=1.5)
ax.set_xlabel("Wavelength (nm)")ax.set_ylabel("Power (dB)")ax.set_ylim(-55, 2)ax.legend(fontsize=9)ax.grid(True, alpha=0.2)fig.tight_layout()plt.show()
Field amplitudes: t=0.9441 x=0.03162 r=0.01000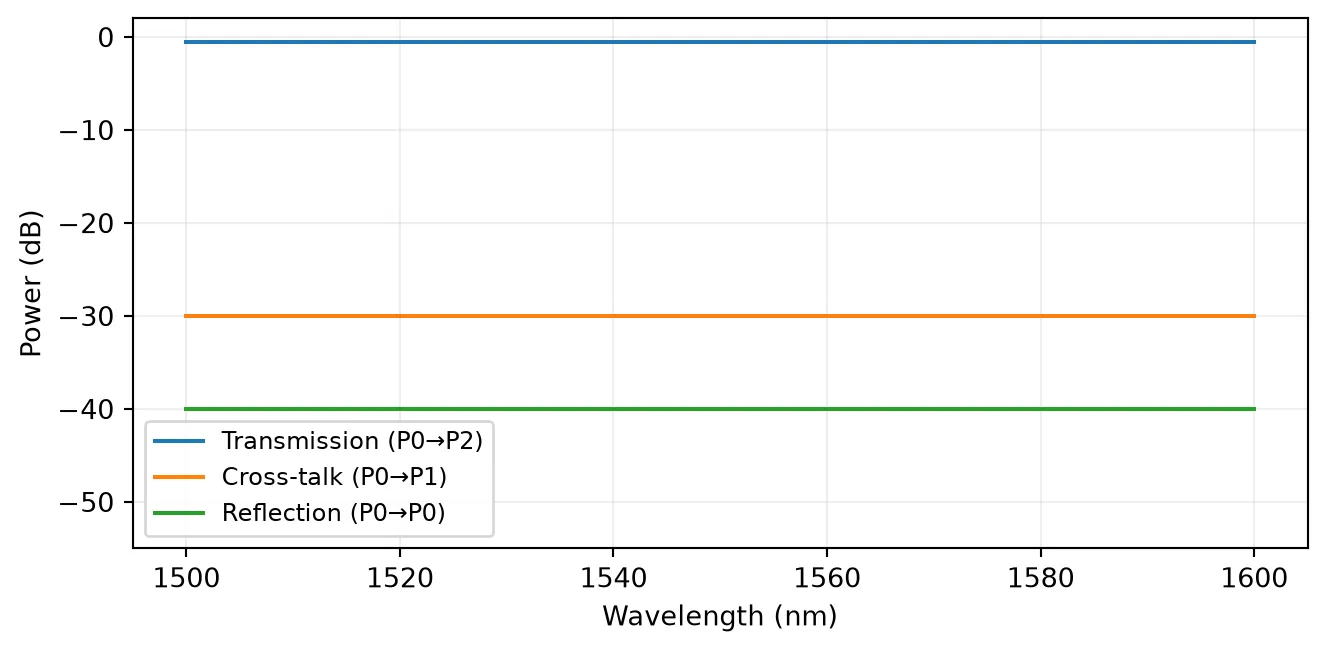
Quick alternative: pf.abstract.crossing
Section titled “Quick alternative: pf.abstract.crossing”pf.abstract.crossing wraps CrossingModel and returns a ready-to-use
pf.Component directly - no separate model instantiation or
.black_box_component() call needed. It accepts the same parameters.
comp = pf.abstract.crossing(t=t, x=x, r=r)
print("Component ports:", list(comp.ports))comp
Component ports: ['P0', 'P1', 'P2', 'P3']
Frequency-dependent Coefficients
Section titled “Frequency-dependent Coefficients”When t, x, or r are measured or simulated over a wavelength range, pass an
pf.Interpolator keyed on frequency (Hz). PhotonForge interpolates the
coefficients at each evaluation frequency.
Here we model an insertion loss that increases away from 1550 nm, as is typical for sub-wavelength-grating or multi-mode-interference crossing designs.
# Simulated IL vs wavelength (parabolic, minimum at 1550 nm)lam_data = np.linspace(1.48, 1.62, 15)IL_data = 0.5 + 2.0 * (lam_data - 1.55) ** 2 / 0.01  # dBt_data = np.sqrt(10 ** (-IL_data / 10))freqs_data = C / lam_data  # must pass frequencies, not wavelengths
t_interp = pf.Interpolator(freqs_data, t_data)crossing_fd = pf.CrossingModel(t=t_interp, x=x, r=r)bb_fd = crossing_fd.black_box_component(port_spec="Strip")s_fd = bb_fd.s_matrix(freqs)
fig, ax = plt.subplots(figsize=(7, 3))T_flat = np.abs(s[("P0@0", "P2@0")]) ** 2T_fd   = np.abs(s_fd[("P0@0", "P2@0")]) ** 2ax.plot(lam * 1e3, 10 * np.log10(T_flat), "--", label="Constant IL = 0.5 dB", lw=1.5)ax.plot(lam * 1e3, 10 * np.log10(T_fd),         label="Interpolated IL(λ)", lw=1.5)ax.scatter(lam_data * 1e3, -IL_data, s=30, zorder=5, label="Data points")ax.set_xlabel("Wavelength (nm)")ax.set_ylabel("Transmission (dB)")ax.set_ylim(-2.5, 0.2)ax.legend(fontsize=9)ax.grid(True, alpha=0.2)fig.tight_layout()plt.show()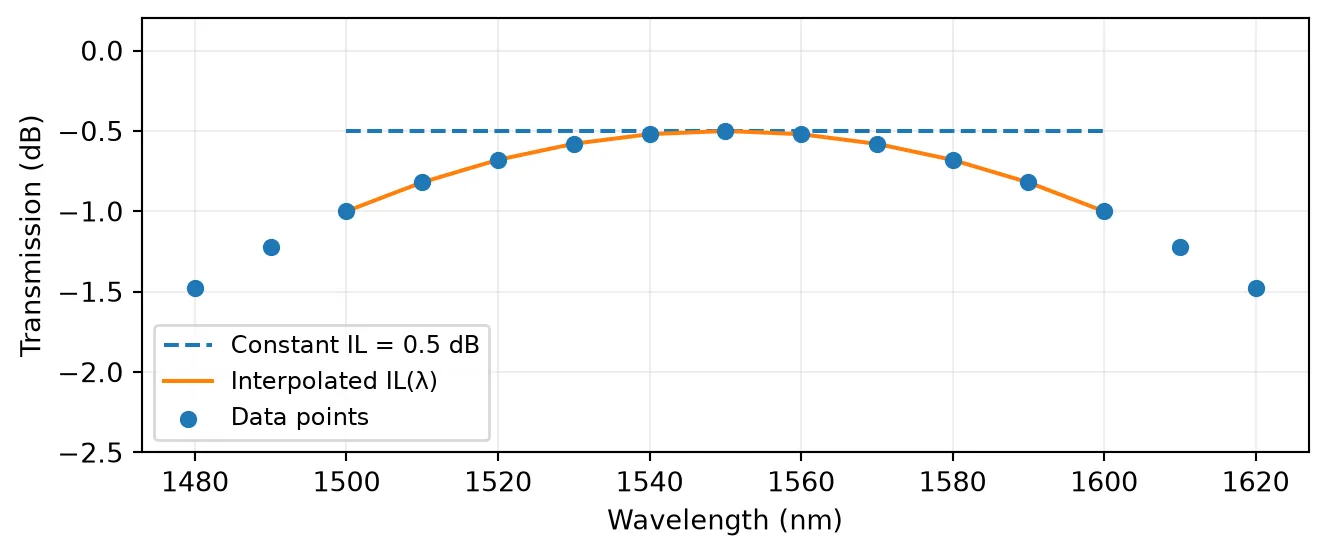
Dispersion
Section titled “Dispersion”Setting propagation_length adds a frequency-dependent phase to all
S-matrix elements. This matters when multiple crossings are cascaded in a
circuit simulation where the relative phase between parallel paths is
wavelength-sensitive.
lp = 10.0   # propagation length through the crossing, µmn_eff = 2.4n_g   = 4.2
crossing_d = pf.CrossingModel(    t=t, x=x, r=r,    propagation_length=lp,    n_eff=n_eff, n_group=n_g,    reference_frequency=f0,)bb_d = crossing_d.black_box_component(port_spec="Strip")s_d  = bb_d.s_matrix(freqs)
T21     = s[("P0@0", "P2@0")]T21_d   = s_d[("P0@0", "P2@0")]phi     = np.unwrap(np.angle(T21))phi_d   = np.unwrap(np.angle(T21_d))
fig, axes = plt.subplots(1, 2, figsize=(9, 3))
axes[0].plot(lam * 1e3, phi,   "--", label="No dispersion", lw=1.5)axes[0].plot(lam * 1e3, phi_d,       label=f"lp = {lp} µm", lw=1.5)axes[0].set_xlabel("Wavelength (nm)")axes[0].set_ylabel("Phase (rad)")axes[0].set_title("Transmission phase")axes[0].legend(fontsize=9)axes[0].grid(True, alpha=0.2)
# Group delay: tau_g = d(phi)/d(omega)omega = 2 * np.pi * freqsgd   = np.gradient(phi,   omega) * 1e12  # psgd_d = np.gradient(phi_d, omega) * 1e12  # psaxes[1].plot(lam * 1e3, gd,   "--", label="No dispersion", lw=1.5)axes[1].plot(lam * 1e3, gd_d,       label=f"lp = {lp} µm", lw=1.5)axes[1].set_xlabel("Wavelength (nm)")axes[1].set_ylabel("Group delay (ps)")axes[1].set_title("Group delay")axes[1].legend(fontsize=9)axes[1].grid(True, alpha=0.2)
fig.tight_layout()plt.show()
gd_expected = n_g * lp / C  # sprint(f"Expected group delay: {gd_expected * 1e12:.3f} ps")print(f"Computed  group delay: {gd_d[500]:.3f} ps")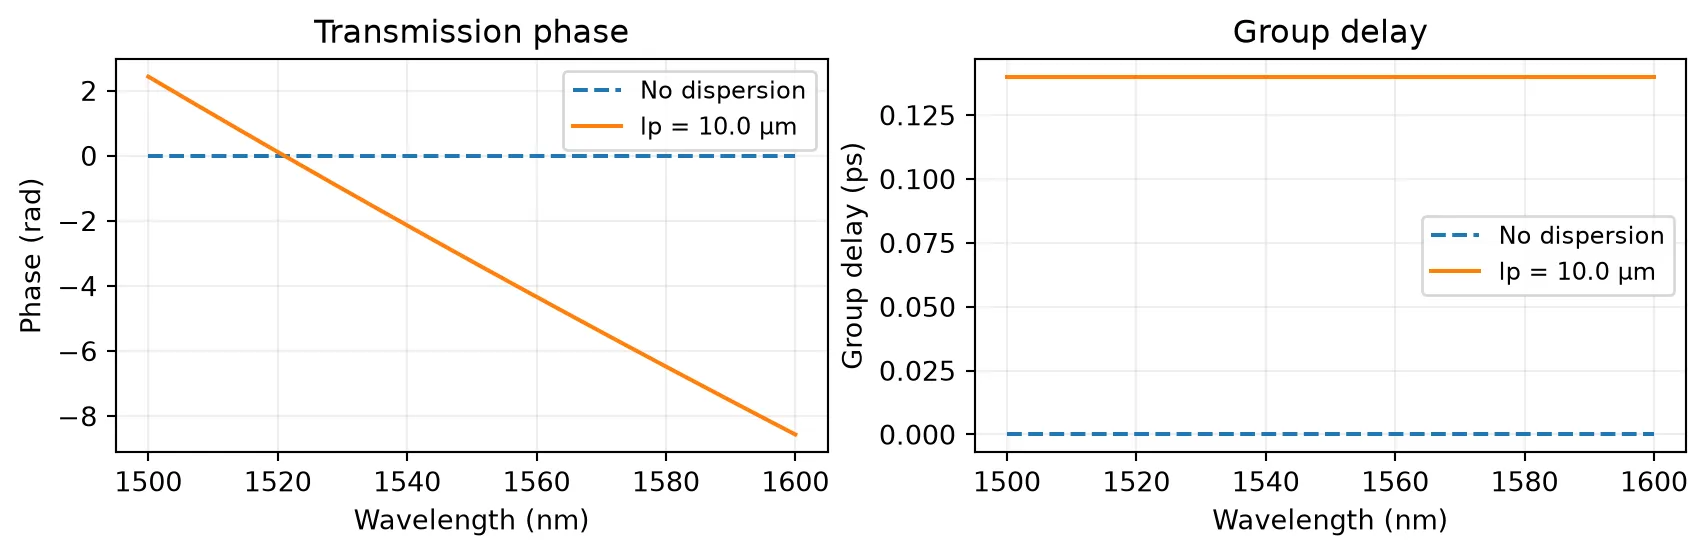
Expected group delay: 0.140 psComputed group delay: 0.140 pspf.CrossingModel API Reference
Section titled “pf.CrossingModel API Reference”| Parameter | Type | Default | Description |
|---|---|---|---|
t | complex | Interpolator | 1.0 | Straight-through field transmission |
x | complex | Interpolator | 0.0 | Cross-coupling field coefficient |
r | complex | Interpolator | 0.0 | Back-reflection field coefficient |
propagation_length | float | 0.0 | Effective path length for dispersion (µm) |
n_eff | complex | Interpolator | 0.0 | Effective index at reference frequency |
n_group | float | Interpolator | None | None (→ n_eff) | Group index |
reference_frequency | float | None | None (→ band center) | Taylor-expansion frequency (Hz) |
ports | list[str] | None | None (→ sorted port names) | Override port ordering |
All coefficients satisfy energy conservation: . Pass complex values to model amplitude and phase simultaneously.