Fabrication-Aware Simulation: Two Coupled Ring Resonator Filter
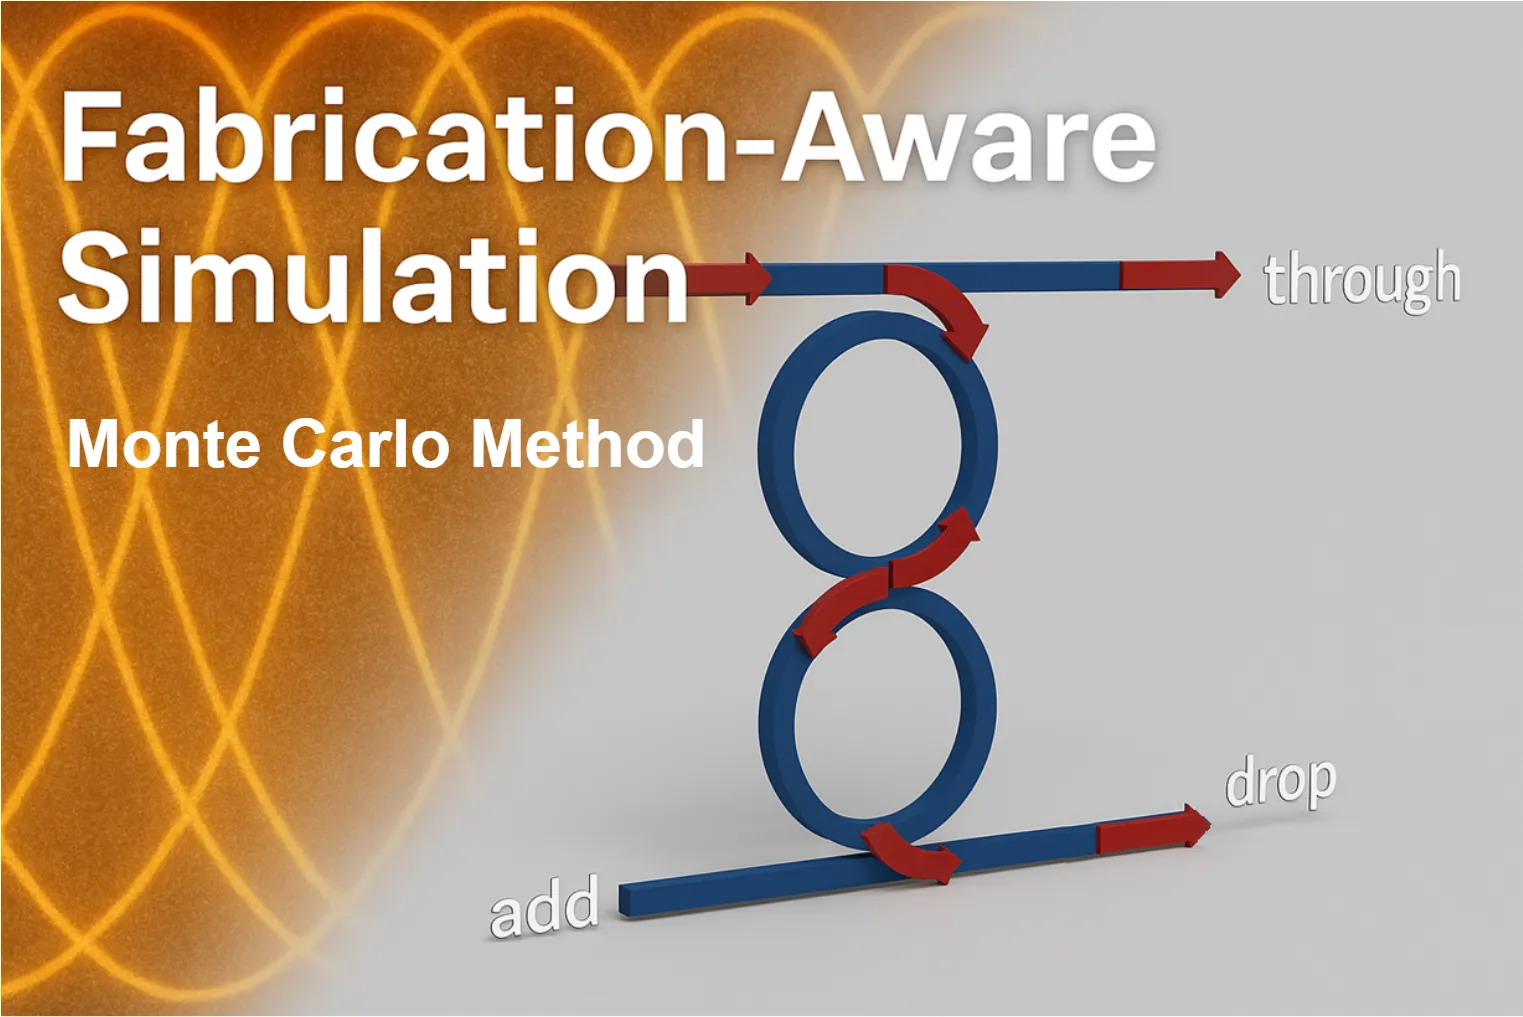
In this notebook we demonstrate how we can perform fabrication-aware simulations in PhotonForge by modeling a 2-ring coupled resonator filter and running a Monte Carlo analysis on key process-variation parameters. We focus on variations in the coupler gap, silicon wafer thickness, and sidewall angle, then visualize their impact on spectral response.
We use the couple mode theory presented in [1] for the filter design.
References
- Little, Brent E., et al. “Microring resonator channel dropping filters.” Journal of lightwave technology 1997 15 (6), 998-1005, doi: 10.1109/50.588673.
import matplotlib.pyplot as pltimport numpy as npimport pandas as pdimport photonforge as pfimport tidy3d as tdfrom scipy.signal import find_peaks
# Reduce non-critical Tidy3D logs to keep the notebook output cleantd.config.logging.level = "ERROR"
Setting Up Technology and Simulation Defaults
Section titled “Setting Up Technology and Simulation Defaults”Here we load and configure the default technology, mesh, and wavelength settings that will be used throughout the notebook.
We start from PhotonForge’s basic technology, set it as the default, and define a bending radius and port specification. We also fix a mesh refinement level and specify the simulation wavelength range around 1.55 µm — the telecom C-band region where most silicon photonic devices operate.
# Load the basic technologytech = pf.basic_technology()
# Set this as the default technology for all subsequent componentspf.config.default_technology = tech
# Extract the standard single-mode strip waveguide port specificationport_spec = tech.ports["Strip"]
# Set some default parameters for all components (e.g., bend radius)pf.config.default_kwargs = {    "radius": 5,  # bend radius in microns    "port_spec": port_spec,}
# Define the default mesh refinement levelpf.config.default_mesh_refinement = 15
# Define the wavelength range for optical simulations [µm]wavelengths = np.linspace(1.543, 1.557, 401)
Parametric 2-Ring Filter Construction
Section titled “Parametric 2-Ring Filter Construction”We define a parametric function to build a two coupled ring resonator (2-RR) filter using PhotonForge primitives. The function instantiates two types of couplers — a bus-to-ring coupler and a ring-to-ring coupler — and then stitches them with a netlist that sets up instances, interconnects ports, and exposes the device I/O.
What we parameterize
- coupling_length: the straight interaction length in the couplers, controlling the coupling coefficient.
- bus_coupling_distance: the nominal gap between the bus waveguide and each ring.
- ring_coupling_distance: the nominal gap between the two rings in the inter-ring coupler.
Netlist assembly We instantiate:
- Two bus couplers (
bus_coupler0,bus_coupler1) - One ring-to-ring coupler (
ring_coupler0)
We then connect their ports to form the 2-RR filter topology and publish four external ports.
Finally, we build the component from the netlist and create a default instance for quick visualization.
Flat-Top (Maximally-Flat) Design Condition
Section titled “Flat-Top (Maximally-Flat) Design Condition”To achieve a flat-top (maximally-flat) passband in the two-ring add–drop filter (with identical rings), we choose the coupling gaps such that the bus-to-ring and ring-to-ring coupling coefficients satisfy the synthesis relation derived in [1]:
where:
- — bus-to-ring (external) power coupling coefficient ( in our design)
- — ring-to-ring (internal) power coupling coefficient ( in our design)
This condition ensures a maximally-flat spectral response by properly balancing external and internal coupling strengths.
@pf.parametric_componentdef create_two_rr_filter(    *,    coupling_length: float = 13.5,    bus_coupling_distance: float = 0.7,    ring_coupling_distance: float = 0.81,) -> pf.Component:    """    Build a 2-ring (2RR) filter from parametric couplers and return the component.    """    # Parametric subcomponents    bus_to_ring = pf.parametric.dual_ring_coupler(        coupling_distance=bus_coupling_distance,        coupling_length=coupling_length,        model=pf.Tidy3DModel(            verbose=False,            port_symmetries=[                ("P1", "P0", "P3", "P2"),                ("P2", "P3", "P0", "P1"),                ("P3", "P2", "P1", "P0"),            ],        ),    )
    ring_to_ring = bus_to_ring.copy().update(coupling_distance=ring_coupling_distance)
    # Netlist for assembling the 2RR resonator    netlist_2RR = {        "name": "filter",        "instances": {            "bus_coupler0": bus_to_ring,            "bus_coupler1": bus_to_ring,            "ring_coupler0": ring_to_ring,        },        "connections": [            (("ring_coupler0", "P0"), ("bus_coupler0", "P1")),            (("bus_coupler1", "P3"), ("ring_coupler0", "P1")),        ],        "ports": [            ("bus_coupler0", "P0"),            ("bus_coupler1", "P2"),            ("bus_coupler0", "P2"),            ("bus_coupler1", "P0"),        ],        "models": [pf.CircuitModel()],    }
    two_rr = pf.component_from_netlist(netlist_2RR)    return two_rr
two_rr = create_two_rr_filter()two_rr;fill:%23221f20;font-weight:bold;font-size:1.417240px;}.terminal{fill:none;stroke:%23805080;stroke-width:0.177155;}.dashed{stroke-dasharray:0.885775,0.531465;}.port{fill:none;stroke:%23805080;stroke-width:0.354310;}.virtual-connection{fill:none;stroke:%23907090;stroke-width:0.265732;}.layer_5_0{stroke:%23998573;fill:url(%23pat-layer_5_0);fill-opacity:0.492;}.label_5_0{fill:%23998573;}.layer_3_0{stroke:%238851ad;fill:url(%23pat-layer_3_0);fill-opacity:0.492;}.label_3_0{fill:%238851ad;}.layer_4_0{stroke:%23535e59;fill:url(%23pat-layer_4_0);fill-opacity:0.492;}.label_4_0{fill:%23535e59;}.layer_1_0{stroke:%23858d89;fill:url(%23pat-layer_1_0);fill-opacity:0.492;}.label_1_0{fill:%23858d89;}.layer_2_0{stroke:%235b98b9;fill:url(%23pat-layer_2_0);fill-opacity:0.492;}.label_2_0{fill:%235b98b9;}</style><defs><path id=%22port-symbol%22 class=%22port%22 d=%22M 0,-0.708620 L 1.062930,0 0,0.708620%22 /><path id=%22ref-port-symbol%22 class=%22port%22 style=%22stroke-opacity:0.33;%22 d=%22M 0,-0.531465 C 0.708620,-0.531465 0.708620,0.531465 0,0.531465%22 /><circle id=%22port-bend-symbol%22 style=%22stroke-width:0;stroke:none;fill:%23805080;fill-opacity:1;%22 cx=%220%22 cy=%220%22 r=%220.318879%22 /><circle id=%22connection-symbol%22 style=%22stroke-width:0;stroke:none;fill:%23907090;fill-opacity:1;%22 cx=%220%22 cy=%220%22 r=%220.372025%22 /><pattern id=%22pat-layer_5_0%22 patternUnits=%22userSpaceOnUse%22 width=%220.885775%22 height=%220.885775%22 patternTransform=%22translate(0.052104,0.792536)%22><line x1=%220.885775%22 y1=%220%22 x2=%220%22 y2=%220.885775%22 style=%22stroke:%23998573;stroke-width:0.088577%22 /><line x1=%221.328662%22 y1=%220.442887%22 x2=%220.442887%22 y2=%221.328662%22 style=%22stroke:%23998573;stroke-width:0.088577%22 /><line x1=%220.442887%22 y1=%22-0.442887%22 x2=%22-0.442887%22 y2=%220.442887%22 style=%22stroke:%23998573;stroke-width:0.088577%22 /></pattern><pattern id=%22pat-layer_3_0%22 patternUnits=%22userSpaceOnUse%22 width=%220.531465%22 height=%220.531465%22 patternTransform=%22translate(0.125051,0.391606)%22><circle cx=%220.265732%22 cy=%220.265732%22 r=%220.088577%22 style=%22stroke:none;fill:%238851ad;fill-opacity:1.0%22 /></pattern><pattern id=%22pat-layer_4_0%22 patternUnits=%22userSpaceOnUse%22 width=%220.885775%22 height=%220.885775%22 patternTransform=%22translate(0.573149,0.279718)%22><line x1=%220.442887%22 y1=%220%22 x2=%220.442887%22 y2=%220.885775%22 style=%22stroke:%23535e59;stroke-width:0.088577%22 /><line x1=%220%22 y1=%220.442887%22 x2=%220.885775%22 y2=%220.442887%22 style=%22stroke:%23535e59;stroke-width:0.088577%22 /></pattern><pattern id=%22pat-layer_1_0%22 patternUnits=%22userSpaceOnUse%22 width=%220.885775%22 height=%220.885775%22 patternTransform=%22translate(0.364731,0.512817)%22><circle cx=%220.442887%22 cy=%220.442887%22 r=%220.088577%22 style=%22stroke:none;fill:%23858d89;fill-opacity:1.0%22 /></pattern><pattern id=%22pat-layer_2_0%22 patternUnits=%22userSpaceOnUse%22 width=%220.885775%22 height=%220.885775%22 patternTransform=%22translate(0.729462,0.139859)%22><line x1=%220%22 y1=%220%22 x2=%220.885775%22 y2=%220.885775%22 style=%22stroke:%235b98b9;stroke-width:0.088577%22 /><line x1=%22-0.442887%22 y1=%220.442887%22 x2=%220.442887%22 y2=%221.328662%22 style=%22stroke:%235b98b9;stroke-width:0.088577%22 /><line x1=%220.442887%22 y1=%22-0.442887%22 x2=%221.328662%22 y2=%220.442887%22 style=%22stroke:%235b98b9;stroke-width:0.088577%22 /></pattern><g id=%22C1%22 data-name=%22dual_ring_coupler__TIYUI4TUDUWEER4XYA33MM5OGPAK7ITX26XMNTBUQDW7CU4ELJLA%22><path class=%22layer_1_0%22 d=%22M -10.500000,-10.700000 -10.484000,-10.354000 -10.436000,-10.011000 -10.357000,-9.674000 -10.247000,-9.345000 -10.107000,-9.028000 -9.938000,-8.726000 -9.743000,-8.440000 -9.521000,-8.174000 -9.276000,-7.929000 -9.010000,-7.707000 -8.724000,-7.512000 -8.422000,-7.343000 -8.105000,-7.203000 -7.776000,-7.093000 -7.439000,-7.014000 -7.096000,-6.966000 -6.750000,-6.950000 6.750000,-6.950000 7.096000,-6.966000 7.439000,-7.014000 7.776000,-7.093000 8.105000,-7.203000 8.422000,-7.343000 8.724000,-7.512000 9.010000,-7.707000 9.276000,-7.929000 9.521000,-8.174000 9.743000,-8.440000 9.938000,-8.726000 10.107000,-9.028000 10.247000,-9.345000 10.357000,-9.674000 10.436000,-10.011000 10.484000,-10.354000 10.500000,-10.700000 13.000000,-10.700000 12.993000,-10.411000 12.973000,-10.123000 12.940000,-9.837000 12.894000,-9.552000 12.834000,-9.269000 12.761000,-8.990000 12.676000,-8.714000 12.578000,-8.442000 12.467000,-8.175000 12.345000,-7.914000 12.210000,-7.659000 12.064000,-7.410000 11.906000,-7.168000 11.738000,-6.934000 11.558000,-6.707000 11.369000,-6.489000 11.169000,-6.281000 10.961000,-6.081000 10.743000,-5.892000 10.516000,-5.712000 10.282000,-5.544000 10.040000,-5.386000 9.791000,-5.240000 9.536000,-5.105000 9.275000,-4.983000 9.008000,-4.872000 8.736000,-4.774000 8.460000,-4.689000 8.181000,-4.616000 7.898000,-4.556000 7.613000,-4.510000 7.327000,-4.477000 7.039000,-4.457000 6.750000,-4.450000 -6.750000,-4.450000 -7.039000,-4.457000 -7.327000,-4.477000 -7.613000,-4.510000 -7.898000,-4.556000 -8.181000,-4.616000 -8.460000,-4.689000 -8.736000,-4.774000 -9.008000,-4.872000 -9.275000,-4.983000 -9.536000,-5.105000 -9.791000,-5.240000 -10.040000,-5.386000 -10.282000,-5.544000 -10.516000,-5.712000 -10.743000,-5.892000 -10.961000,-6.081000 -11.169000,-6.281000 -11.369000,-6.489000 -11.558000,-6.707000 -11.738000,-6.934000 -11.906000,-7.168000 -12.064000,-7.410000 -12.210000,-7.659000 -12.345000,-7.914000 -12.467000,-8.175000 -12.578000,-8.442000 -12.676000,-8.714000 -12.761000,-8.990000 -12.834000,-9.269000 -12.894000,-9.552000 -12.940000,-9.837000 -12.973000,-10.123000 -12.993000,-10.411000 -13.000000,-10.700000 z%22 /><path class=%22layer_1_0%22 d=%22M 10.500000,0.000000 10.484000,-0.346000 10.436000,-0.689000 10.357000,-1.026000 10.247000,-1.355000 10.107000,-1.672000 9.938000,-1.974000 9.743000,-2.260000 9.521000,-2.526000 9.276000,-2.771000 9.010000,-2.993000 8.724000,-3.188000 8.422000,-3.357000 8.105000,-3.497000 7.776000,-3.607000 7.439000,-3.686000 7.096000,-3.734000 6.750000,-3.750000 -6.750000,-3.750000 -7.096000,-3.734000 -7.439000,-3.686000 -7.776000,-3.607000 -8.105000,-3.497000 -8.422000,-3.357000 -8.724000,-3.188000 -9.010000,-2.993000 -9.276000,-2.771000 -9.521000,-2.526000 -9.743000,-2.260000 -9.938000,-1.974000 -10.107000,-1.672000 -10.247000,-1.355000 -10.357000,-1.026000 -10.436000,-0.689000 -10.484000,-0.346000 -10.500000,0.000000 -13.000000,0.000000 -12.993000,-0.289000 -12.973000,-0.577000 -12.940000,-0.863000 -12.894000,-1.148000 -12.834000,-1.431000 -12.761000,-1.710000 -12.676000,-1.986000 -12.578000,-2.258000 -12.467000,-2.525000 -12.345000,-2.786000 -12.210000,-3.041000 -12.064000,-3.290000 -11.906000,-3.532000 -11.738000,-3.766000 -11.558000,-3.993000 -11.369000,-4.211000 -11.169000,-4.419000 -10.961000,-4.619000 -10.743000,-4.808000 -10.516000,-4.988000 -10.282000,-5.156000 -10.040000,-5.314000 -9.791000,-5.460000 -9.536000,-5.595000 -9.275000,-5.717000 -9.008000,-5.828000 -8.736000,-5.926000 -8.460000,-6.011000 -8.181000,-6.084000 -7.898000,-6.144000 -7.613000,-6.190000 -7.327000,-6.223000 -7.039000,-6.243000 -6.750000,-6.250000 6.750000,-6.250000 7.039000,-6.243000 7.327000,-6.223000 7.613000,-6.190000 7.898000,-6.144000 8.181000,-6.084000 8.460000,-6.011000 8.736000,-5.926000 9.008000,-5.828000 9.275000,-5.717000 9.536000,-5.595000 9.791000,-5.460000 10.040000,-5.314000 10.282000,-5.156000 10.516000,-4.988000 10.743000,-4.808000 10.961000,-4.619000 11.169000,-4.419000 11.369000,-4.211000 11.558000,-3.993000 11.738000,-3.766000 11.906000,-3.532000 12.064000,-3.290000 12.210000,-3.041000 12.345000,-2.786000 12.467000,-2.525000 12.578000,-2.258000 12.676000,-1.986000 12.761000,-1.710000 12.834000,-1.431000 12.894000,-1.148000 12.940000,-0.863000 12.973000,-0.577000 12.993000,-0.289000 13.000000,0.000000 z%22 /><path class=%22layer_2_0%22 d=%22M -11.500000,-10.700000 -11.480000,-10.262000 -11.419000,-9.827000 -11.374000,-9.612000 -11.319000,-9.400000 -11.254000,-9.190000 -11.095000,-8.781000 -10.900000,-8.389000 -10.789000,-8.199000 -10.541000,-7.837000 -10.260000,-7.500000 -10.109000,-7.341000 -9.785000,-7.046000 -9.613000,-6.909000 -9.251000,-6.661000 -8.867000,-6.448000 -8.669000,-6.355000 -8.260000,-6.196000 -8.050000,-6.131000 -7.838000,-6.076000 -7.623000,-6.031000 -7.188000,-5.970000 -6.750000,-5.950000 6.750000,-5.950000 7.188000,-5.970000 7.623000,-6.031000 7.838000,-6.076000 8.050000,-6.131000 8.260000,-6.196000 8.669000,-6.355000 9.061000,-6.550000 9.251000,-6.661000 9.613000,-6.909000 9.950000,-7.190000 10.109000,-7.341000 10.404000,-7.665000 10.541000,-7.837000 10.789000,-8.199000 11.002000,-8.583000 11.095000,-8.781000 11.254000,-9.190000 11.319000,-9.400000 11.374000,-9.612000 11.419000,-9.827000 11.480000,-10.262000 11.500000,-10.700000 12.000000,-10.700000 11.978000,-10.216000 11.950000,-9.975000 11.911000,-9.735000 11.861000,-9.498000 11.800000,-9.263000 11.728000,-9.032000 11.645000,-8.803000 11.553000,-8.579000 11.450000,-8.360000 11.337000,-8.145000 11.214000,-7.936000 10.940000,-7.536000 10.789000,-7.346000 10.630000,-7.163000 10.287000,-6.820000 10.104000,-6.661000 9.914000,-6.510000 9.514000,-6.236000 9.305000,-6.113000 9.090000,-6.000000 8.871000,-5.897000 8.647000,-5.805000 8.418000,-5.722000 8.187000,-5.650000 7.952000,-5.589000 7.715000,-5.539000 7.475000,-5.500000 7.234000,-5.472000 6.992000,-5.456000 6.750000,-5.450000 -6.750000,-5.450000 -7.234000,-5.472000 -7.475000,-5.500000 -7.715000,-5.539000 -7.952000,-5.589000 -8.187000,-5.650000 -8.418000,-5.722000 -8.647000,-5.805000 -8.871000,-5.897000 -9.090000,-6.000000 -9.305000,-6.113000 -9.514000,-6.236000 -9.914000,-6.510000 -10.104000,-6.661000 -10.287000,-6.820000 -10.630000,-7.163000 -10.789000,-7.346000 -10.940000,-7.536000 -11.214000,-7.936000 -11.337000,-8.145000 -11.450000,-8.360000 -11.553000,-8.579000 -11.645000,-8.803000 -11.728000,-9.032000 -11.800000,-9.263000 -11.861000,-9.498000 -11.911000,-9.735000 -11.950000,-9.975000 -11.978000,-10.216000 -11.994000,-10.458000 -12.000000,-10.700000 z%22 /><path class=%22layer_2_0%22 d=%22M 11.500000,0.000000 11.480000,-0.438000 11.419000,-0.873000 11.374000,-1.088000 11.319000,-1.300000 11.254000,-1.510000 11.095000,-1.919000 10.900000,-2.311000 10.789000,-2.501000 10.541000,-2.863000 10.260000,-3.200000 10.109000,-3.359000 9.785000,-3.654000 9.613000,-3.791000 9.251000,-4.039000 8.867000,-4.252000 8.669000,-4.345000 8.260000,-4.504000 8.050000,-4.569000 7.838000,-4.624000 7.623000,-4.669000 7.188000,-4.730000 6.750000,-4.750000 -6.750000,-4.750000 -7.188000,-4.730000 -7.623000,-4.669000 -7.838000,-4.624000 -8.050000,-4.569000 -8.260000,-4.504000 -8.669000,-4.345000 -9.061000,-4.150000 -9.251000,-4.039000 -9.613000,-3.791000 -9.950000,-3.510000 -10.109000,-3.359000 -10.404000,-3.035000 -10.541000,-2.863000 -10.789000,-2.501000 -11.002000,-2.117000 -11.095000,-1.919000 -11.254000,-1.510000 -11.319000,-1.300000 -11.374000,-1.088000 -11.419000,-0.873000 -11.480000,-0.438000 -11.500000,0.000000 -12.000000,0.000000 -11.978000,-0.484000 -11.950000,-0.725000 -11.911000,-0.965000 -11.861000,-1.202000 -11.800000,-1.437000 -11.728000,-1.668000 -11.645000,-1.897000 -11.553000,-2.121000 -11.450000,-2.340000 -11.337000,-2.555000 -11.214000,-2.764000 -10.940000,-3.164000 -10.789000,-3.354000 -10.630000,-3.537000 -10.287000,-3.880000 -10.104000,-4.039000 -9.914000,-4.190000 -9.514000,-4.464000 -9.305000,-4.587000 -9.090000,-4.700000 -8.871000,-4.803000 -8.647000,-4.895000 -8.418000,-4.978000 -8.187000,-5.050000 -7.952000,-5.111000 -7.715000,-5.161000 -7.475000,-5.200000 -7.234000,-5.228000 -6.992000,-5.244000 -6.750000,-5.250000 6.750000,-5.250000 7.234000,-5.228000 7.475000,-5.200000 7.715000,-5.161000 7.952000,-5.111000 8.187000,-5.050000 8.418000,-4.978000 8.647000,-4.895000 8.871000,-4.803000 9.090000,-4.700000 9.305000,-4.587000 9.514000,-4.464000 9.914000,-4.190000 10.104000,-4.039000 10.287000,-3.880000 10.630000,-3.537000 10.789000,-3.354000 10.940000,-3.164000 11.214000,-2.764000 11.337000,-2.555000 11.450000,-2.340000 11.553000,-2.121000 11.645000,-1.897000 11.728000,-1.668000 11.800000,-1.437000 11.861000,-1.202000 11.911000,-0.965000 11.950000,-0.725000 11.978000,-0.484000 11.994000,-0.242000 12.000000,0.000000 z%22 /></g><g id=%22C2%22 data-name=%22dual_ring_coupler__TD3QVLCCT6YYELFV4XWIIIYSK2KHQWRHVOJKYNZNHXPP3NCDK3CA%22><path class=%22layer_1_0%22 d=%22M -10.500000,-10.810000 -10.484000,-10.464000 -10.436000,-10.121000 -10.357000,-9.784000 -10.247000,-9.455000 -10.107000,-9.138000 -9.938000,-8.836000 -9.743000,-8.550000 -9.521000,-8.284000 -9.276000,-8.039000 -9.010000,-7.817000 -8.724000,-7.622000 -8.422000,-7.453000 -8.105000,-7.313000 -7.776000,-7.203000 -7.439000,-7.124000 -7.096000,-7.076000 -6.750000,-7.060000 6.750000,-7.060000 7.096000,-7.076000 7.439000,-7.124000 7.776000,-7.203000 8.105000,-7.313000 8.422000,-7.453000 8.724000,-7.622000 9.010000,-7.817000 9.276000,-8.039000 9.521000,-8.284000 9.743000,-8.550000 9.938000,-8.836000 10.107000,-9.138000 10.247000,-9.455000 10.357000,-9.784000 10.436000,-10.121000 10.484000,-10.464000 10.500000,-10.810000 13.000000,-10.810000 12.993000,-10.521000 12.973000,-10.233000 12.940000,-9.947000 12.894000,-9.662000 12.834000,-9.379000 12.761000,-9.100000 12.676000,-8.824000 12.578000,-8.552000 12.467000,-8.285000 12.345000,-8.024000 12.210000,-7.769000 12.064000,-7.520000 11.906000,-7.278000 11.738000,-7.044000 11.558000,-6.817000 11.369000,-6.599000 11.169000,-6.391000 10.961000,-6.191000 10.743000,-6.002000 10.516000,-5.822000 10.282000,-5.654000 10.040000,-5.496000 9.791000,-5.350000 9.536000,-5.215000 9.275000,-5.093000 9.008000,-4.982000 8.736000,-4.884000 8.460000,-4.799000 8.181000,-4.726000 7.898000,-4.666000 7.613000,-4.620000 7.327000,-4.587000 7.039000,-4.567000 6.750000,-4.560000 -6.750000,-4.560000 -7.039000,-4.567000 -7.327000,-4.587000 -7.613000,-4.620000 -7.898000,-4.666000 -8.181000,-4.726000 -8.460000,-4.799000 -8.736000,-4.884000 -9.008000,-4.982000 -9.275000,-5.093000 -9.536000,-5.215000 -9.791000,-5.350000 -10.040000,-5.496000 -10.282000,-5.654000 -10.516000,-5.822000 -10.743000,-6.002000 -10.961000,-6.191000 -11.169000,-6.391000 -11.369000,-6.599000 -11.558000,-6.817000 -11.738000,-7.044000 -11.906000,-7.278000 -12.064000,-7.520000 -12.210000,-7.769000 -12.345000,-8.024000 -12.467000,-8.285000 -12.578000,-8.552000 -12.676000,-8.824000 -12.761000,-9.100000 -12.834000,-9.379000 -12.894000,-9.662000 -12.940000,-9.947000 -12.973000,-10.233000 -12.993000,-10.521000 -13.000000,-10.810000 z%22 /><path class=%22layer_1_0%22 d=%22M 10.500000,0.000000 10.484000,-0.346000 10.436000,-0.689000 10.357000,-1.026000 10.247000,-1.355000 10.107000,-1.672000 9.938000,-1.974000 9.743000,-2.260000 9.521000,-2.526000 9.276000,-2.771000 9.010000,-2.993000 8.724000,-3.188000 8.422000,-3.357000 8.105000,-3.497000 7.776000,-3.607000 7.439000,-3.686000 7.096000,-3.734000 6.750000,-3.750000 -6.750000,-3.750000 -7.096000,-3.734000 -7.439000,-3.686000 -7.776000,-3.607000 -8.105000,-3.497000 -8.422000,-3.357000 -8.724000,-3.188000 -9.010000,-2.993000 -9.276000,-2.771000 -9.521000,-2.526000 -9.743000,-2.260000 -9.938000,-1.974000 -10.107000,-1.672000 -10.247000,-1.355000 -10.357000,-1.026000 -10.436000,-0.689000 -10.484000,-0.346000 -10.500000,0.000000 -13.000000,0.000000 -12.993000,-0.289000 -12.973000,-0.577000 -12.940000,-0.863000 -12.894000,-1.148000 -12.834000,-1.431000 -12.761000,-1.710000 -12.676000,-1.986000 -12.578000,-2.258000 -12.467000,-2.525000 -12.345000,-2.786000 -12.210000,-3.041000 -12.064000,-3.290000 -11.906000,-3.532000 -11.738000,-3.766000 -11.558000,-3.993000 -11.369000,-4.211000 -11.169000,-4.419000 -10.961000,-4.619000 -10.743000,-4.808000 -10.516000,-4.988000 -10.282000,-5.156000 -10.040000,-5.314000 -9.791000,-5.460000 -9.536000,-5.595000 -9.275000,-5.717000 -9.008000,-5.828000 -8.736000,-5.926000 -8.460000,-6.011000 -8.181000,-6.084000 -7.898000,-6.144000 -7.613000,-6.190000 -7.327000,-6.223000 -7.039000,-6.243000 -6.750000,-6.250000 6.750000,-6.250000 7.039000,-6.243000 7.327000,-6.223000 7.613000,-6.190000 7.898000,-6.144000 8.181000,-6.084000 8.460000,-6.011000 8.736000,-5.926000 9.008000,-5.828000 9.275000,-5.717000 9.536000,-5.595000 9.791000,-5.460000 10.040000,-5.314000 10.282000,-5.156000 10.516000,-4.988000 10.743000,-4.808000 10.961000,-4.619000 11.169000,-4.419000 11.369000,-4.211000 11.558000,-3.993000 11.738000,-3.766000 11.906000,-3.532000 12.064000,-3.290000 12.210000,-3.041000 12.345000,-2.786000 12.467000,-2.525000 12.578000,-2.258000 12.676000,-1.986000 12.761000,-1.710000 12.834000,-1.431000 12.894000,-1.148000 12.940000,-0.863000 12.973000,-0.577000 12.993000,-0.289000 13.000000,0.000000 z%22 /><path class=%22layer_2_0%22 d=%22M -11.500000,-10.810000 -11.480000,-10.372000 -11.419000,-9.937000 -11.374000,-9.722000 -11.319000,-9.510000 -11.254000,-9.300000 -11.095000,-8.891000 -10.900000,-8.499000 -10.789000,-8.309000 -10.541000,-7.947000 -10.260000,-7.610000 -10.109000,-7.451000 -9.785000,-7.156000 -9.613000,-7.019000 -9.251000,-6.771000 -8.867000,-6.558000 -8.669000,-6.465000 -8.260000,-6.306000 -8.050000,-6.241000 -7.838000,-6.186000 -7.623000,-6.141000 -7.188000,-6.080000 -6.750000,-6.060000 6.750000,-6.060000 7.188000,-6.080000 7.623000,-6.141000 7.838000,-6.186000 8.050000,-6.241000 8.260000,-6.306000 8.669000,-6.465000 9.061000,-6.660000 9.251000,-6.771000 9.613000,-7.019000 9.950000,-7.300000 10.109000,-7.451000 10.404000,-7.775000 10.541000,-7.947000 10.789000,-8.309000 11.002000,-8.693000 11.095000,-8.891000 11.254000,-9.300000 11.319000,-9.510000 11.374000,-9.722000 11.419000,-9.937000 11.480000,-10.372000 11.500000,-10.810000 12.000000,-10.810000 11.978000,-10.326000 11.950000,-10.085000 11.911000,-9.845000 11.861000,-9.608000 11.800000,-9.373000 11.728000,-9.142000 11.645000,-8.913000 11.553000,-8.689000 11.450000,-8.470000 11.337000,-8.255000 11.214000,-8.046000 10.940000,-7.646000 10.789000,-7.456000 10.630000,-7.273000 10.287000,-6.930000 10.104000,-6.771000 9.914000,-6.620000 9.514000,-6.346000 9.305000,-6.223000 9.090000,-6.110000 8.871000,-6.007000 8.647000,-5.915000 8.418000,-5.832000 8.187000,-5.760000 7.952000,-5.699000 7.715000,-5.649000 7.475000,-5.610000 7.234000,-5.582000 6.992000,-5.566000 6.750000,-5.560000 -6.750000,-5.560000 -7.234000,-5.582000 -7.475000,-5.610000 -7.715000,-5.649000 -7.952000,-5.699000 -8.187000,-5.760000 -8.418000,-5.832000 -8.647000,-5.915000 -8.871000,-6.007000 -9.090000,-6.110000 -9.305000,-6.223000 -9.514000,-6.346000 -9.914000,-6.620000 -10.104000,-6.771000 -10.287000,-6.930000 -10.630000,-7.273000 -10.789000,-7.456000 -10.940000,-7.646000 -11.214000,-8.046000 -11.337000,-8.255000 -11.450000,-8.470000 -11.553000,-8.689000 -11.645000,-8.913000 -11.728000,-9.142000 -11.800000,-9.373000 -11.861000,-9.608000 -11.911000,-9.845000 -11.950000,-10.085000 -11.978000,-10.326000 -11.994000,-10.568000 -12.000000,-10.810000 z%22 /><path class=%22layer_2_0%22 d=%22M 11.500000,0.000000 11.480000,-0.438000 11.419000,-0.873000 11.374000,-1.088000 11.319000,-1.300000 11.254000,-1.510000 11.095000,-1.919000 10.900000,-2.311000 10.789000,-2.501000 10.541000,-2.863000 10.260000,-3.200000 10.109000,-3.359000 9.785000,-3.654000 9.613000,-3.791000 9.251000,-4.039000 8.867000,-4.252000 8.669000,-4.345000 8.260000,-4.504000 8.050000,-4.569000 7.838000,-4.624000 7.623000,-4.669000 7.188000,-4.730000 6.750000,-4.750000 -6.750000,-4.750000 -7.188000,-4.730000 -7.623000,-4.669000 -7.838000,-4.624000 -8.050000,-4.569000 -8.260000,-4.504000 -8.669000,-4.345000 -9.061000,-4.150000 -9.251000,-4.039000 -9.613000,-3.791000 -9.950000,-3.510000 -10.109000,-3.359000 -10.404000,-3.035000 -10.541000,-2.863000 -10.789000,-2.501000 -11.002000,-2.117000 -11.095000,-1.919000 -11.254000,-1.510000 -11.319000,-1.300000 -11.374000,-1.088000 -11.419000,-0.873000 -11.480000,-0.438000 -11.500000,0.000000 -12.000000,0.000000 -11.978000,-0.484000 -11.950000,-0.725000 -11.911000,-0.965000 -11.861000,-1.202000 -11.800000,-1.437000 -11.728000,-1.668000 -11.645000,-1.897000 -11.553000,-2.121000 -11.450000,-2.340000 -11.337000,-2.555000 -11.214000,-2.764000 -10.940000,-3.164000 -10.789000,-3.354000 -10.630000,-3.537000 -10.287000,-3.880000 -10.104000,-4.039000 -9.914000,-4.190000 -9.514000,-4.464000 -9.305000,-4.587000 -9.090000,-4.700000 -8.871000,-4.803000 -8.647000,-4.895000 -8.418000,-4.978000 -8.187000,-5.050000 -7.952000,-5.111000 -7.715000,-5.161000 -7.475000,-5.200000 -7.234000,-5.228000 -6.992000,-5.244000 -6.750000,-5.250000 6.750000,-5.250000 7.234000,-5.228000 7.475000,-5.200000 7.715000,-5.161000 7.952000,-5.111000 8.187000,-5.050000 8.418000,-4.978000 8.647000,-4.895000 8.871000,-4.803000 9.090000,-4.700000 9.305000,-4.587000 9.514000,-4.464000 9.914000,-4.190000 10.104000,-4.039000 10.287000,-3.880000 10.630000,-3.537000 10.789000,-3.354000 10.940000,-3.164000 11.214000,-2.764000 11.337000,-2.555000 11.450000,-2.340000 11.553000,-2.121000 11.645000,-1.897000 11.728000,-1.668000 11.800000,-1.437000 11.861000,-1.202000 11.911000,-0.965000 11.950000,-0.725000 11.978000,-0.484000 11.994000,-0.242000 12.000000,0.000000 z%22 /></g></defs><g transform=%22scale(1 -1)%22><g id=%22C0%22 data-name=%22filter%22><use transform=%22translate(0.000000 0.000000)%22 href=%22%23C1%22 /><use transform=%22translate(0.000000 10.810000) rotate(180.000000)%22 href=%22%23C1%22 /><use transform=%22translate(0.000000 10.810000)%22 href=%22%23C2%22 /><g transform=%22translate(-11.750000 -10.700000) rotate(90.000000)%22><path class=%22port%22 d=%22M 0,-1.125000 V 1.125000%22 /><use href=%22%23port-symbol%22 /></g><text class=%22label%22 text-anchor=%22end%22 dominant-baseline=%22text-after-edge%22 x=%22-11.750000%22 y=%2210.700000%22>P0</text><g transform=%22translate(-11.750000 21.510000) rotate(270.000000)%22><path class=%22port%22 d=%22M 0,-1.125000 V 1.125000%22 /><use href=%22%23port-symbol%22 /></g><text class=%22label%22 text-anchor=%22start%22 dominant-baseline=%22text-before-edge%22 x=%22-11.750000%22 y=%22-21.510000%22>P1</text><g transform=%22translate(11.750000 -10.700000) rotate(90.000000)%22><path class=%22port%22 d=%22M 0,-1.125000 V 1.125000%22 /><use href=%22%23port-symbol%22 /></g><text class=%22label%22 text-anchor=%22end%22 dominant-baseline=%22text-after-edge%22 x=%2211.750000%22 y=%2210.700000%22>P2</text><g transform=%22translate(11.750000 21.510000) rotate(270.000000)%22><path class=%22port%22 d=%22M 0,-1.125000 V 1.125000%22 /><use href=%22%23port-symbol%22 /></g><text class=%22label%22 text-anchor=%22start%22 dominant-baseline=%22text-before-edge%22 x=%2211.750000%22 y=%22-21.510000%22>P3</text></g></g></svg>)
%22><rect x=%22-30.00%22 y=%22-30.00%22 width=%2260.00%22 height=%2260.00%22 fill=%22%23f4f5f7%22 stroke=%22%23232530%22 stroke-width=%221%22/><use href=%22%23g-dc%22 transform=%22translate(-30.00 -30.00) scale(1.2)%22/><circle cx=%22-15.00%22 cy=%2230.00%22 r=%224%22 fill=%22%2300643c%22 stroke=%22%2300643c%22 stroke-width=%221%22/><circle cx=%2215.00%22 cy=%2230.00%22 r=%224%22 fill=%22%2300643c%22 stroke=%22%2300643c%22 stroke-width=%221%22/><circle cx=%22-15.00%22 cy=%22-30.00%22 r=%224%22 fill=%22%2300643c%22 stroke=%22%2300643c%22 stroke-width=%221%22/><circle cx=%2215.00%22 cy=%22-30.00%22 r=%224%22 fill=%22%2300643c%22 stroke=%22%2300643c%22 stroke-width=%221%22/></g><text x=%220.00%22 y=%2295.80%22 font-size=%229%22 fill=%22%23232530%22 font-weight=%22400%22 text-anchor=%22middle%22 dominant-baseline=%22hanging%22 stroke=%22%23ffffff%22 stroke-width=%223.15%22 stroke-linejoin=%22round%22 paint-order=%22stroke%22>dual_ring_coupler_1</text><text x=%22-15.00%22 y=%22102.00%22 font-size=%2210%22 fill=%22%23b8461c%22 font-weight=%22700%22 text-anchor=%22middle%22 dominant-baseline=%22hanging%22 stroke=%22%23ffffff%22 stroke-width=%223.50%22 stroke-linejoin=%22round%22 paint-order=%22stroke%22>P0</text><text x=%2215.00%22 y=%22102.00%22 font-size=%2210%22 fill=%22%23b8461c%22 font-weight=%22700%22 text-anchor=%22middle%22 dominant-baseline=%22hanging%22 stroke=%22%23ffffff%22 stroke-width=%223.50%22 stroke-linejoin=%22round%22 paint-order=%22stroke%22>P2</text><g transform=%22matrix(-1 -1.22465e-16 1.22465e-16 -1 0.000 -60.000)%22><rect x=%22-30.00%22 y=%22-30.00%22 width=%2260.00%22 height=%2260.00%22 fill=%22%23f4f5f7%22 stroke=%22%23232530%22 stroke-width=%221%22/><use href=%22%23g-dc%22 transform=%22translate(-30.00 -30.00) scale(1.2)%22/><circle cx=%22-15.00%22 cy=%2230.00%22 r=%224%22 fill=%22%2300643c%22 stroke=%22%2300643c%22 stroke-width=%221%22/><circle cx=%2215.00%22 cy=%2230.00%22 r=%224%22 fill=%22%2300643c%22 stroke=%22%2300643c%22 stroke-width=%221%22/><circle cx=%22-15.00%22 cy=%22-30.00%22 r=%224%22 fill=%22%2300643c%22 stroke=%22%2300643c%22 stroke-width=%221%22/><circle cx=%2215.00%22 cy=%22-30.00%22 r=%224%22 fill=%22%2300643c%22 stroke=%22%2300643c%22 stroke-width=%221%22/></g><text x=%220.00%22 y=%22-24.20%22 font-size=%229%22 fill=%22%23232530%22 font-weight=%22400%22 text-anchor=%22middle%22 dominant-baseline=%22hanging%22 stroke=%22%23ffffff%22 stroke-width=%223.15%22 stroke-linejoin=%22round%22 paint-order=%22stroke%22>dual_ring_coupler_2</text><text x=%2215.00%22 y=%22-102.00%22 font-size=%2210%22 fill=%22%23b8461c%22 font-weight=%22700%22 text-anchor=%22middle%22 dominant-baseline=%22auto%22 stroke=%22%23ffffff%22 stroke-width=%223.50%22 stroke-linejoin=%22round%22 paint-order=%22stroke%22>P3</text><text x=%22-15.00%22 y=%22-102.00%22 font-size=%2210%22 fill=%22%23b8461c%22 font-weight=%22700%22 text-anchor=%22middle%22 dominant-baseline=%22auto%22 stroke=%22%23ffffff%22 stroke-width=%223.50%22 stroke-linejoin=%22round%22 paint-order=%22stroke%22>P1</text><g transform=%22matrix(1 -0 0 1 192.000 -60.000)%22><rect x=%22-30.00%22 y=%22-30.00%22 width=%2260.00%22 height=%2260.00%22 fill=%22%23f4f5f7%22 stroke=%22%23232530%22 stroke-width=%221%22/><use href=%22%23g-dc%22 transform=%22translate(-30.00 -30.00) scale(1.2)%22/><circle cx=%22-15.00%22 cy=%2230.00%22 r=%224%22 fill=%22%2300643c%22 stroke=%22%2300643c%22 stroke-width=%221%22/><circle cx=%2215.00%22 cy=%2230.00%22 r=%224%22 fill=%22%2300643c%22 stroke=%22%2300643c%22 stroke-width=%221%22/><circle cx=%22-15.00%22 cy=%22-30.00%22 r=%224%22 fill=%22%2300643c%22 stroke=%22%2300643c%22 stroke-width=%221%22/><circle cx=%2215.00%22 cy=%22-30.00%22 r=%224%22 fill=%22%2300643c%22 stroke=%22%2300643c%22 stroke-width=%221%22/></g><text x=%22192.00%22 y=%22-24.20%22 font-size=%229%22 fill=%22%23232530%22 font-weight=%22400%22 text-anchor=%22middle%22 dominant-baseline=%22hanging%22 stroke=%22%23ffffff%22 stroke-width=%223.15%22 stroke-linejoin=%22round%22 paint-order=%22stroke%22>dual_ring_coupler_3</text><g fill=%22none%22 stroke-width=%222%22></g></svg>)
We now compute and visualize the spectral characteristics of the designed 2-RR filter.
# Compute the scattering matrix (S-matrix) of the 2RR filter across wavelengthss_matrix_2rr = two_rr.s_matrix(frequencies=pf.C_0 / wavelengths)
# Plot the S-matrix with input from port P0, showing response in dB_ = pf.plot_s_matrix(s_matrix_2rr, input_ports=["P0"])
Uploading task 'Mode-Stripwaveguide…'Uploading task 'Mode-Stripwaveguide…'Starting task 'Mode-Stripwaveguide': https://tidy3d.simulation.cloud/workbench?taskId=mo-b12b7575-2179-4168-9528-9d1d338cb5e4Downloading data from 'Mode-Stripwaveguide'…Starting task 'Mode-Stripwaveguide': https://tidy3d.simulation.cloud/workbench?taskId=mo-c8f0fbf1-c784-4e0a-8eb8-b3b610131f30Downloading data from 'Mode-Stripwaveguide'…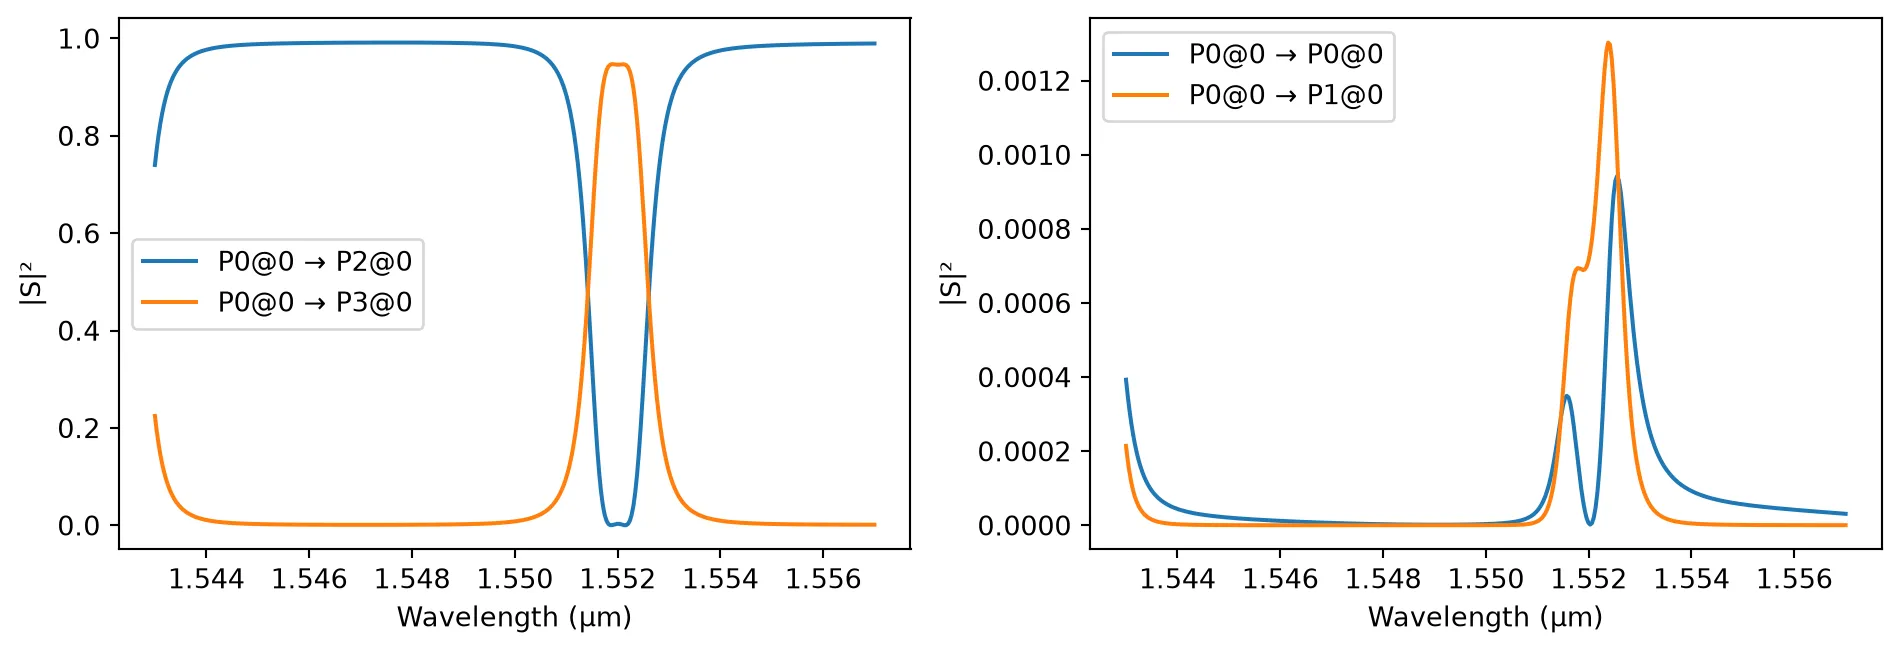
Monte Carlo Analysis
Section titled “Monte Carlo Analysis”To evaluate fabrication tolerance and yield, we perform a Monte Carlo simulation on the 2-RR filter.
Each sample randomly perturbs selected geometric and material parameters within specified distributions, emulating real-world process variations.
Parameters under variation
- core_thickness (technology): silicon layer thickness, mean 0.22 µm with a 3 nm standard deviation
- sidewall_angle (technology): etched sidewall deviation, uniformly sampled between 0° and 5°
- bus_coupling_distance (component): coupling gap between bus and ring, mean 0.7 µm with 10 nm σ
- ring_coupling_distance (component): gap between rings, mean 0.79 µm with 10 nm σ
We include both random and corner samples to span statistical variability and worst-case scenarios.
The resulting dataset contains a list of parameter realizations and their corresponding S-matrices.
# Run a Monte Carlo S-matrix analysis to capture fabrication-induced variationsvar, results = pf.monte_carlo.s_matrix( two_rr, pf.C_0 / wavelengths, ("core_thickness", "technology", {"value": 0.22, "stdev": 0.003}), ("sidewall_angle", "technology", {"value_range": [0, 5]}), ("bus_coupling_distance", two_rr, {"value": 0.7, "stdev": 0.01}), ("ring_coupling_distance", two_rr, {"value": 0.81, "stdev": 0.01}), random_samples=20, # number of random samples corner_samples=2, # corner cases (extreme combinations) random_seed=0, show_progress=True,)Starting sample 1 of 22…Uploading task 'Mode-Stripwaveguide…'Uploading task 'Mode-Stripwaveguide…'Starting sample 2 of 22…Uploading task 'Mode-Stripwaveguide…'Uploading task 'Mode-Stripwaveguide…'Starting sample 3 of 22…Uploading task 'Mode-Stripwaveguide…'Uploading task 'Mode-Stripwaveguide…'Starting sample 4 of 22…Starting task 'Mode-Stripwaveguide': https://tidy3d.simulation.cloud/workbench?taskId=mo-5102f988-67c8-4c6b-b353-9989c2956796Uploading task 'Mode-Stripwaveguide…'Uploading task 'Mode-Stripwaveguide…'Starting task 'Mode-Stripwaveguide': https://tidy3d.simulation.cloud/workbench?taskId=mo-3eb49050-be8d-4a88-9ad8-ab347e712dd2Starting task 'Mode-Stripwaveguide': https://tidy3d.simulation.cloud/workbench?taskId=mo-cbf26adb-4dcf-421f-abcf-9d494c35b7ceStarting sample 5 of 22…Starting task 'Mode-Stripwaveguide': https://tidy3d.simulation.cloud/workbench?taskId=mo-4a5ac660-f330-44f6-b8d5-983f8f282e67Starting task 'Mode-Stripwaveguide': https://tidy3d.simulation.cloud/workbench?taskId=mo-4aad1484-a714-4c24-969b-12211563bb5dUploading task 'Mode-Stripwaveguide…'Downloading data from 'Mode-Stripwaveguide'…Uploading task 'Mode-Stripwaveguide…'Starting sample 6 of 22…Downloading data from 'Mode-Stripwaveguide'…Downloading data from 'Mode-Stripwaveguide'…Downloading data from 'Mode-Stripwaveguide'…Starting task 'Mode-Stripwaveguide': https://tidy3d.simulation.cloud/workbench?taskId=mo-530ab37e-e754-4968-b197-2f151f4174e7Downloading data from 'Mode-Stripwaveguide'…Uploading task 'Mode-Stripwaveguide…'Uploading task 'Mode-Stripwaveguide…'Starting task 'Mode-Stripwaveguide': https://tidy3d.simulation.cloud/workbench?taskId=mo-7197e494-4f9d-46d6-b2be-fa763bea671eStarting sample 7 of 22…Downloading data from 'Mode-Stripwaveguide'…Uploading task 'Mode-Stripwaveguide…'Uploading task 'Mode-Stripwaveguide…'Starting task 'Mode-Stripwaveguide': https://tidy3d.simulation.cloud/workbench?taskId=mo-316c774b-b014-482d-a18d-e534ba1d5170Starting task 'Mode-Stripwaveguide': https://tidy3d.simulation.cloud/workbench?taskId=mo-0b09ba58-1d0d-4bdc-a97a-d356016f0f8eStarting sample 8 of 22…Downloading data from 'Mode-Stripwaveguide'…Uploading task 'Mode-Stripwaveguide…'Uploading task 'Mode-Stripwaveguide…'Starting sample 9 of 22…Starting task 'Mode-Stripwaveguide': https://tidy3d.simulation.cloud/workbench?taskId=mo-1738f11a-c838-4d74-8b9c-0b61e9a78b16Starting task 'Mode-Stripwaveguide': https://tidy3d.simulation.cloud/workbench?taskId=mo-505428ef-45d8-41b0-8eaa-86039bf22630Downloading data from 'Mode-Stripwaveguide'…Starting task 'Mode-Stripwaveguide': https://tidy3d.simulation.cloud/workbench?taskId=mo-f5536116-9e9e-4381-a84f-6538ba76decbUploading task 'Mode-Stripwaveguide…'Uploading task 'Mode-Stripwaveguide…'Downloading data from 'Mode-Stripwaveguide'…Starting sample 10 of 22…Starting task 'Mode-Stripwaveguide': https://tidy3d.simulation.cloud/workbench?taskId=mo-9bb52ad8-afa1-4f4d-b73d-003ccb64c54cUploading task 'Mode-Stripwaveguide…'Uploading task 'Mode-Stripwaveguide…'Starting task 'Mode-Stripwaveguide': https://tidy3d.simulation.cloud/workbench?taskId=mo-9eed98f0-bafb-4fcc-9afe-4b8009e48a51Downloading data from 'Mode-Stripwaveguide'…Downloading data from 'Mode-Stripwaveguide'…Downloading data from 'Mode-Stripwaveguide'…Starting task 'Mode-Stripwaveguide': https://tidy3d.simulation.cloud/workbench?taskId=mo-52a0d4fa-0485-4459-b133-9f483a00a160Starting sample 11 of 22…Starting task 'Mode-Stripwaveguide': https://tidy3d.simulation.cloud/workbench?taskId=mo-6a3faba3-ee06-4a05-9e27-1d5e83d0383cUploading task 'Mode-Stripwaveguide…'Downloading data from 'Mode-Stripwaveguide'…Uploading task 'Mode-Stripwaveguide…'Downloading data from 'Mode-Stripwaveguide'…Starting task 'Mode-Stripwaveguide': https://tidy3d.simulation.cloud/workbench?taskId=mo-c5e133a0-6a7d-4705-ab01-a513eacac260Starting sample 12 of 22…Downloading data from 'Mode-Stripwaveguide'…Starting task 'Mode-Stripwaveguide': https://tidy3d.simulation.cloud/workbench?taskId=mo-2653da79-c59d-4d2f-9ef8-e36a162e1331Downloading data from 'Mode-Stripwaveguide'…Uploading task 'Mode-Stripwaveguide…'Uploading task 'Mode-Stripwaveguide…'Starting task 'Mode-Stripwaveguide': https://tidy3d.simulation.cloud/workbench?taskId=mo-a0d416ab-7f01-40ee-9bbc-46cc3868d008Starting task 'Mode-Stripwaveguide': https://tidy3d.simulation.cloud/workbench?taskId=mo-354c6c6f-e2a5-4637-bd62-716b1eb64e66Downloading data from 'Mode-Stripwaveguide'…Starting sample 13 of 22…Downloading data from 'Mode-Stripwaveguide'…Starting task 'Mode-Stripwaveguide': https://tidy3d.simulation.cloud/workbench?taskId=mo-6a9ce0f8-f9ea-47e9-bdcc-a53ff044fc5bStarting task 'Mode-Stripwaveguide': https://tidy3d.simulation.cloud/workbench?taskId=mo-f273c9dc-a06d-4e06-ac2c-6a7cc07c468aDownloading data from 'Mode-Stripwaveguide'…Uploading task 'Mode-Stripwaveguide…'Uploading task 'Mode-Stripwaveguide…'Downloading data from 'Mode-Stripwaveguide'…Starting task 'Mode-Stripwaveguide': https://tidy3d.simulation.cloud/workbench?taskId=mo-d3e6475c-eb03-4dda-b239-4ffff9c411b5Starting sample 14 of 22…Starting task 'Mode-Stripwaveguide': https://tidy3d.simulation.cloud/workbench?taskId=mo-c2259f48-ef93-4ed3-b304-841e19b4d537Downloading data from 'Mode-Stripwaveguide'…Downloading data from 'Mode-Stripwaveguide'…Downloading data from 'Mode-Stripwaveguide'…Uploading task 'Mode-Stripwaveguide…'Uploading task 'Mode-Stripwaveguide…'Starting task 'Mode-Stripwaveguide': https://tidy3d.simulation.cloud/workbench?taskId=mo-dc9f8057-9880-4044-9b5d-48abcefe045bStarting task 'Mode-Stripwaveguide': https://tidy3d.simulation.cloud/workbench?taskId=mo-05c39506-726e-42c5-953f-0cc80efaff60Downloading data from 'Mode-Stripwaveguide'…Starting sample 15 of 22…Downloading data from 'Mode-Stripwaveguide'…Uploading task 'Mode-Stripwaveguide…'Uploading task 'Mode-Stripwaveguide…'Starting task 'Mode-Stripwaveguide': https://tidy3d.simulation.cloud/workbench?taskId=mo-1afdb9cc-f924-4064-8098-8a0e5035cc9eDownloading data from 'Mode-Stripwaveguide'…Starting task 'Mode-Stripwaveguide': https://tidy3d.simulation.cloud/workbench?taskId=mo-b5a8fcba-87e2-4c86-8167-cc1ee94274b6Starting sample 16 of 22…Downloading data from 'Mode-Stripwaveguide'…Uploading task 'Mode-Stripwaveguide…'Uploading task 'Mode-Stripwaveguide…'Starting sample 17 of 22…Downloading data from 'Mode-Stripwaveguide'…Uploading task 'Mode-Stripwaveguide…'Starting task 'Mode-Stripwaveguide': https://tidy3d.simulation.cloud/workbench?taskId=mo-ce693e10-b5d3-41e8-91c5-8f3ec88a5063Uploading task 'Mode-Stripwaveguide…'Starting task 'Mode-Stripwaveguide': https://tidy3d.simulation.cloud/workbench?taskId=mo-9a66d67a-a9f5-4337-87c6-a1d7516e9b85Starting sample 18 of 22…Downloading data from 'Mode-Stripwaveguide'…Downloading data from 'Mode-Stripwaveguide'…Starting task 'Mode-Stripwaveguide': https://tidy3d.simulation.cloud/workbench?taskId=mo-26103914-06e4-4f8e-aeb4-e7dd433ee5abStarting task 'Mode-Stripwaveguide': https://tidy3d.simulation.cloud/workbench?taskId=mo-1d43586e-f826-4c20-93a6-b43505ebd819Uploading task 'Mode-Stripwaveguide…'Uploading task 'Mode-Stripwaveguide…'Starting task 'Mode-Stripwaveguide': https://tidy3d.simulation.cloud/workbench?taskId=mo-b0c89d19-30eb-46d6-b67f-c498a90c17cbStarting task 'Mode-Stripwaveguide': https://tidy3d.simulation.cloud/workbench?taskId=mo-a769e1fc-4520-470f-bc2c-1044e011db3bStarting sample 19 of 22…Downloading data from 'Mode-Stripwaveguide'…Downloading data from 'Mode-Stripwaveguide'…Uploading task 'Mode-Stripwaveguide…'Uploading task 'Mode-Stripwaveguide…'Downloading data from 'Mode-Stripwaveguide'…Starting sample 20 of 22…Starting task 'Mode-Stripwaveguide': https://tidy3d.simulation.cloud/workbench?taskId=mo-79948aca-0c37-49a0-a525-c2daf9f0535eUploading task 'Mode-Stripwaveguide…'Downloading data from 'Mode-Stripwaveguide'…Uploading task 'Mode-Stripwaveguide…'Starting task 'Mode-Stripwaveguide': https://tidy3d.simulation.cloud/workbench?taskId=mo-4a4dd394-49e0-4695-abb3-89927b45da79Starting task 'Mode-Stripwaveguide': https://tidy3d.simulation.cloud/workbench?taskId=mo-b76514eb-0278-40c0-b2fe-5e6d2580cd50Starting sample 21 of 22…Starting task 'Mode-Stripwaveguide': https://tidy3d.simulation.cloud/workbench?taskId=mo-4b54f085-c973-45f6-80f8-4a547919840fDownloading data from 'Mode-Stripwaveguide'…Uploading task 'Mode-Stripwaveguide…'Uploading task 'Mode-Stripwaveguide…'Downloading data from 'Mode-Stripwaveguide'…Downloading data from 'Mode-Stripwaveguide'…Starting task 'Mode-Stripwaveguide': https://tidy3d.simulation.cloud/workbench?taskId=mo-607acdd6-4d11-4dad-a0d7-9e3e4ad9b6eaStarting sample 22 of 22…Starting task 'Mode-Stripwaveguide': https://tidy3d.simulation.cloud/workbench?taskId=mo-017fb79c-f808-4b59-87c9-f33f0ad7e73bUploading task 'Mode-Stripwaveguide…'Downloading data from 'Mode-Stripwaveguide'…Uploading task 'Mode-Stripwaveguide…'Downloading data from 'Mode-Stripwaveguide'…Starting task 'Mode-Stripwaveguide': https://tidy3d.simulation.cloud/workbench?taskId=mo-3bf4804e-bfde-465d-8ead-04cac076771fSample 1 done.Sample 2 done.Sample 3 done.Sample 4 done.Sample 5 done.Sample 6 done.Sample 7 done.Sample 8 done.Sample 9 done.Sample 10 done.Sample 11 done.Sample 12 done.Sample 13 done.Sample 14 done.Sample 15 done.Sample 17 done.Downloading data from 'Mode-Stripwaveguide'…Starting task 'Mode-Stripwaveguide': https://tidy3d.simulation.cloud/workbench?taskId=mo-09588c65-ca4a-4eba-a8c6-9cffaa20f120Sample 16 done.Sample 18 done.Downloading data from 'Mode-Stripwaveguide'…Downloading data from 'Mode-Stripwaveguide'…Starting task 'Mode-Stripwaveguide': https://tidy3d.simulation.cloud/workbench?taskId=mo-8b8c66c8-0cac-4121-ad6e-b008e3ab8618Starting task 'Mode-Stripwaveguide': https://tidy3d.simulation.cloud/workbench?taskId=mo-e0489b70-959a-4333-9709-60b520ae19c5Downloading data from 'Mode-Stripwaveguide'…Downloading data from 'Mode-Stripwaveguide'…Sample 19 done.Sample 20 done.Sample 22 done.Sample 21 done.All samples done!We now plot the transmission spectra from port P0 (input) to port P3 (drop port) for all Monte Carlo samples.
Each curve represents one possible fabricated instance of the 2-RR filter, allowing us to observe the spread in resonance wavelength and insertion loss due to process variations.
fig, ax = plt.subplots(1, 1)
for *_, s_matrix in results:    ax.plot(        s_matrix.wavelengths,        20 * np.log10(np.abs(s_matrix[("P0@0", "P3@0")])),        alpha=0.5,        color="tab:orange",    )
_ = ax.set(ylim=(-20, 0), xlabel="λ (µm)", ylabel="Transmission (dB)")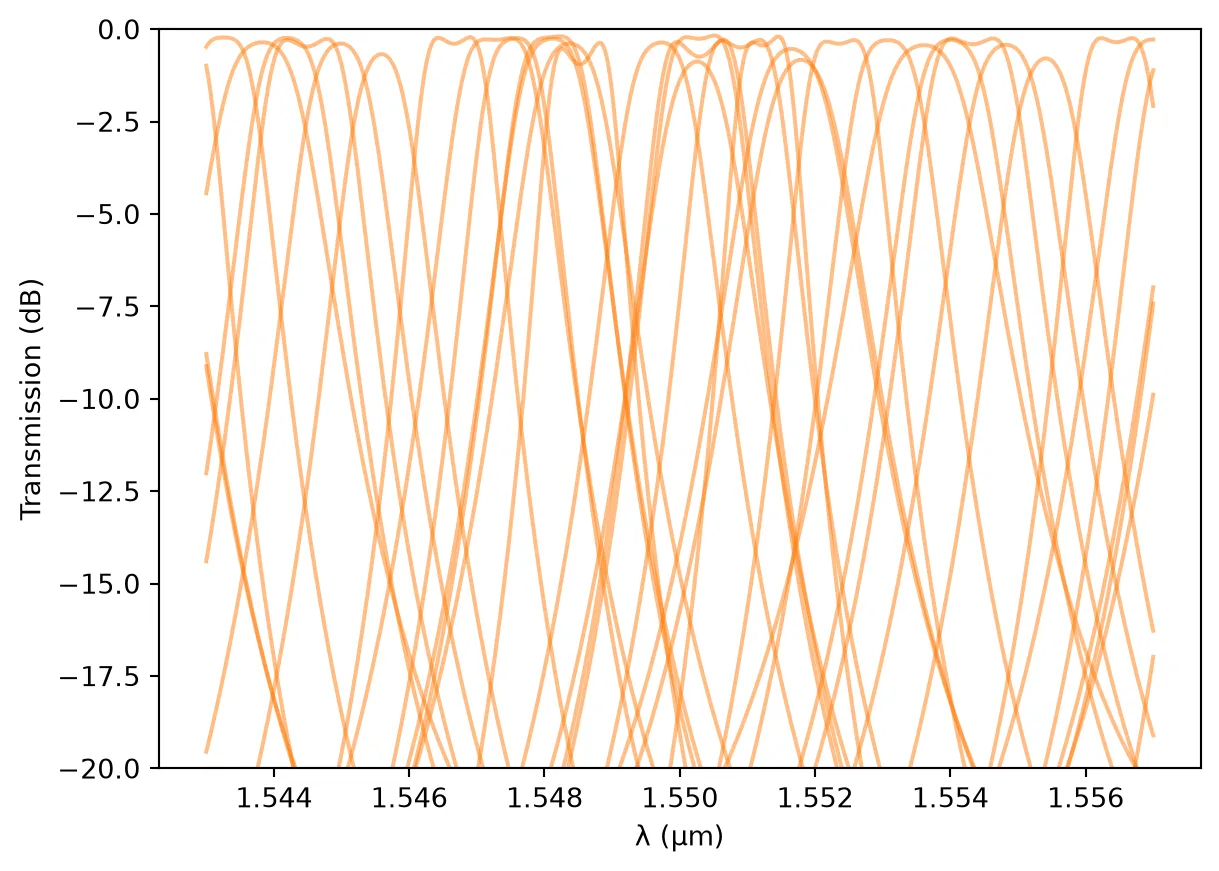
Discussion of Fabrication-Aware Results
Section titled “Discussion of Fabrication-Aware Results”The Monte Carlo simulation shows that fabrication variations can significantly impact the spectral response of the 2-RR filter:
-
Resonance wavelength drift:
The resonance positions vary substantially between samples, indicating that small deviations in silicon thickness, sidewall angle, or coupling gaps lead to noticeable phase shifts and effective index changes.
This explains why thermal tuning (via integrated heaters) is almost always required in fabricated ring filters to fine-tune or align the resonance wavelengths post-fabrication. -
Insertion loss variation:
The simulated through-port transmission fluctuates between approximately 0.3 dB and 1.0 dB, demonstrating that while loss performance changes slightly, the filter remains fairly robust to process deviations in this respect.
Overall, the analysis illustrates how PhotonForge’s fabrication-aware modeling can predict both resonance misalignment and performance spread, allowing designers to anticipate tuning requirements and optimize yield.
Correlation Analysis
Section titled “Correlation Analysis”Monte Carlo analysis allows for the extraction of correlations between a device’s response and its input variables. This section demonstrates the correlation analysis process. Critically, accurate results with four input variables require hundreds of data points. The findings presented here are, therefore, purely illustrative and not statistically significant.
Feature extraction
Section titled “Feature extraction”In this section we extract three filter features from each simulated S-matrix so we can study their correlation with fabrication variables. We target the resonance closest to a reference wavelength (default m) and compute:
- Center wavelength : the midpoint between the two 3-dB crossing wavelengths around the chosen resonance.
- Insertion loss IL (in dB): transmission value at the center wavelength.
- 3-dB bandwidth : difference between the right and left 3-dB crossing wavelengths.
def extract_filter_features(s_matrix, target_wavelength=1.55):    """    Extracts key features (insertion loss, center wavelength, bandwidth)    from an optical filter's S-matrix data.
    This function identifies the resonance dip closest to a target wavelength    and calculates its characteristics.
    Args:        s_matrix: The S-matrix object from the simulation.        target_wavelength (float): The wavelength (in µm) around which to                                   search for the primary resonance.                                   Defaults to 1.55 µm.
    Returns:        dict: A dictionary containing the calculated 'center_wavelength',              'insertion_loss' (in dB), and 'bandwidth' (in µm).              Returns None if no resonance is found.    """    wavelengths = s_matrix.wavelengths    # Calculate transmission in dB    transmission_db = 20 * np.log10(np.abs(s_matrix[("P0@0", "P3@0")]))
    # The 'prominence' parameter helps ignore minor ripples and noise.    peak_indices, _ = find_peaks(transmission_db, prominence=1)
    if peak_indices.size == 0:        print("Warning: No resonance peaks found.")        return None
    # Find the peak/resonance closest to the target wavelength    resonant_wavelengths = wavelengths[peak_indices]    closest_peak_index = peak_indices[        np.argmin(np.abs(resonant_wavelengths - target_wavelength))    ]
    # --- 1. Calculate Maximum Transmission Wavelength and Insertion Loss ---    max_wavelength = wavelengths[closest_peak_index]    insertion_loss = transmission_db[closest_peak_index]
    # --- 2. Calculate 3-dB Bandwidth ---    # The 3-dB level is 3 dB below the maximum transmission value (the IL)    three_db_level = insertion_loss - 3
    # Find where the transmission crosses the 3-dB level on both sides of the resonance    # Split the transmission data at the resonance point    left_side = transmission_db[:closest_peak_index]    right_side = transmission_db[closest_peak_index:]
    # Find the indices where the transmission is greater than the 3-dB level    left_indices_below_3db = np.where(left_side < three_db_level)[0]    right_indices_below_3db = np.where(right_side < three_db_level)[0]
    if left_indices_below_3db.size == 0 or right_indices_below_3db.size == 0:        bandwidth = np.nan  # Use NaN for cases where bandwidth can't be found    else:        # Get the points just before and after the crossing        left_cross_idx = left_indices_below_3db[-1]        right_cross_idx = right_indices_below_3db[0] + closest_peak_index
        # Interpolate to find the exact wavelength at the 3dB crossing for better accuracy        w_left = np.interp(            three_db_level,            [transmission_db[left_cross_idx], transmission_db[left_cross_idx + 1]],            [wavelengths[left_cross_idx], wavelengths[left_cross_idx + 1]],        )
        w_right = np.interp(            three_db_level,            [transmission_db[right_cross_idx - 1], transmission_db[right_cross_idx]],            [wavelengths[right_cross_idx - 1], wavelengths[right_cross_idx]],        )
        # Compute bandwidth and center wavelength from crossings        bandwidth = w_right - w_left        center_wavelength = (w_right + w_left) / 2        insertion_loss = transmission_db[(left_cross_idx + right_cross_idx) // 2]
    return {        "center_wavelength": center_wavelength,        "insertion_loss": insertion_loss,        "bandwidth": bandwidth,    }
Correlation Matrix
Section titled “Correlation Matrix”In this section we take the Monte Carlo results and visually explore how each fabrication parameter affects the main filter features.
We generate a grid of scatter plots, one for each input–output pair, annotated with the Pearson correlation coefficient (R).
Interpretation
- R ≈ +1: Strong positive correlation — as the fabrication parameter increases, the feature value increases.
- R ≈ -1: Strong negative correlation — the feature decreases as the parameter increases.
- R ≈ 0: Weak or no linear correlation.
This visualization allows us to directly identify which fabrication tolerances most strongly impact spectral behavior such as resonance shift, insertion loss, or bandwidth broadening.
Important note: The correlation results shown here are intended for demonstration only and are not statistically valid because of small number of data points.
def run_correlation_analysis(variables, simulation_results, target_wavelength=1.55):    """    Processes Monte Carlo simulation results to visualize the relationship    and correlation between each input variable and each output filter feature.
    Args:        variables (list): The list of RandomVariable objects from the simulation.        simulation_results (list): The list of result tuples from the simulation.                                     Each tuple contains the input values and the s_matrix.        target_wavelength (float): The target wavelength in micrometers.    """    data = []    variable_names = [v.name for v in variables]
    print("Processing simulation results...")    for result in simulation_results:        s_matrix = result[-1]        input_values = result[:-1]        features = extract_filter_features(            s_matrix, target_wavelength=target_wavelength        )
        if features:            run_data = {name: val for name, val in zip(variable_names, input_values)}            run_data.update(features)            data.append(run_data)
    if not data:        print("Could not extract features from any simulation run. Aborting.")        return
    print(f"Successfully processed {len(data)} data points.")    df = pd.DataFrame(data)    df["center_wavelength"] *= 1e3    df["bandwidth"] *= 1e3    df = df.rename(        columns={            "center_wavelength": "center_wavelength_nm",            "bandwidth": "bandwidth_nm",        }    )
    print("\n--- Data Head ---")    print(df.head())
    output_feature_names = ["insertion_loss", "center_wavelength_nm", "bandwidth_nm"]
    print("\n--- Generating Custom Scatter Plot Grid with Correlation Values ---")
    n_outputs = len(output_feature_names)    n_inputs = len(variable_names)
    fig, axes = plt.subplots(        n_outputs, n_inputs, figsize=(10, 8), sharex="col", sharey="row"    )
    if n_outputs == 1 or n_inputs == 1:        axes = np.array(axes).reshape(n_outputs, n_inputs)
    for i, out_feature in enumerate(output_feature_names):        for j, in_variable in enumerate(variable_names):            ax = axes[i, j]            ax.scatter(                df[in_variable],                df[out_feature],                alpha=0.6,                s=30,                edgecolor="k",                linewidth=0.5,            )            corr = df[in_variable].corr(df[out_feature])            corr_text = f"R = {corr:.2f}"            ax.text(                0.05,                0.95,                corr_text,                transform=ax.transAxes,                fontsize=12,                verticalalignment="top",                bbox=dict(boxstyle="round,pad=0.3", facecolor="wheat", alpha=0.5),            )            if j == 0:                ax.set_ylabel(out_feature, fontsize=12)            if i == n_outputs - 1:                ax.set_xlabel(in_variable, fontsize=12)
            ax.tick_params(axis="x", rotation=45)            ax.grid(True, linestyle="--", alpha=0.6)
    fig.suptitle("Output Features vs. Input Variables", fontsize=20)    plt.tight_layout(rect=[0, 0.03, 1, 0.97])    plt.show()
run_correlation_analysis(var, results)
Processing simulation results...Successfully processed 22 data points.
--- Data Head --- sidewall_angle core_thickness ring_coupling_distance \0 5.000000 0.225880 0.8296001 0.000000 0.214120 0.7904002 4.517759 0.218700 0.8176023 4.244655 0.219547 0.7926794 2.785838 0.219909 0.808466
bus_coupling_distance center_wavelength_nm insertion_loss bandwidth_nm0 0.719600 1551.269666 -0.437801 0.9606681 0.680400 1553.621434 -0.432439 1.5771322 0.699238 1549.720321 -0.360124 1.1893573 0.713226 1550.306584 -0.744145 1.4168334 0.703479 1548.111936 -0.212000 1.256127
--- Generating Custom Scatter Plot Grid with Correlation Values ---