

CW Laser
Time-domain circuit simulations in PhotonForge are built on time steppers: time-domain models that advance the signals in a photonic circuit sample by sample. Instead of the full optical field, time steppers operate on the slowly varying complex envelope around a global carrier frequency, and optical amplitudes are expressed in units of , so is the instantaneous optical power.
Every time-domain simulation starts with a source. The CWLaserTimeStepper models a continuous-wave (CW) laser that emits the complex field
By default the source is ideal, with constant power and constant phase. Two noise mechanisms can be enabled to model realistic lasers: phase noise, parametrized by the Lorentzian linewidth of the laser, and relative intensity noise (RIN), modeled as white noise on the optical power.
This guide shows how to create the laser source and run it in a time-domain simulation, how to detune it from the carrier frequency, and how to configure and validate both noise mechanisms. At the end, the laser is connected to a photodetector to show how laser noise propagates through a circuit-level simulation.
# Import plotting and numerics librariesimport matplotlib.pyplot as pltimport numpy as np
# Import PhotonForge and its abstract component libraryimport photonforge as pfimport photonforge.abstract as pfa
# Start the live viewer used to display the componentsviewer = pf.live_viewer.LiveViewer()
LiveViewer started at http://127.0.0.1:43503. Call its 'stop()' method to free the port.# Create the technology and set it as the defaulttech = pf.basic_technology()pf.config.default_technology = tech
# Define the carrier of the simulationlda0 = 1.55 # Carrier wavelength (µm)f0 = pf.C_0 / lda0 # Carrier frequency (Hz)
# Define the optical power shared by all lasers in this guidelaser_power = 1e-3 # Laser output power (W)An Ideal CW Source
Section titled “An Ideal CW Source”The easiest way to use the model is through the abstract component library: cw_laser creates a component with a schematic symbol, a single optical port, and a TerminationModel that carries the CW laser time stepper as its time-domain counterpart. The power argument sets the mean optical output power in watts.
# Create an ideal CW laser and display itlaser = pfa.cw_laser(power=laser_power)viewer(laser)
A time-domain simulation is initialized by calling setup_time_stepper on the component, passing the time step and the carrier frequency. All signal envelopes are referenced to the carrier, which is handled automatically by the time stepper. Because the laser is a source, it needs no input signal: we call step with the desired number of steps and time step. The result is a TimeSeries whose keys combine the port name and mode index, "P0@0" in this case.
As expected for an ideal source, the output amplitude is a constant , so the instantaneous power stays at 1 mW.
# Define the time grid of the simulationtime_step = 1e-12  # Simulation time step (s)num_steps = 2000  # Number of simulation stepst = np.arange(num_steps) * time_step
# Initialize the time stepper at the carrier frequencytime_stepper = laser.setup_time_stepper(time_step=time_step, carrier_frequency=f0)
# Run the simulation and read the envelope at the laser portoutput = time_stepper.step(steps=num_steps, time_step=time_step)a = output["P0@0"]
# Plot the optical power, which is the squared magnitude of the envelopefig, ax = plt.subplots(figsize=(7, 3), tight_layout=True)ax.plot(t * 1e9, np.abs(a) ** 2 * 1e3)ax.set(xlabel="Time (ns)", ylabel="Optical power (mW)", ylim=(0, 1.2))_ = ax.set_title("Ideal CW laser output")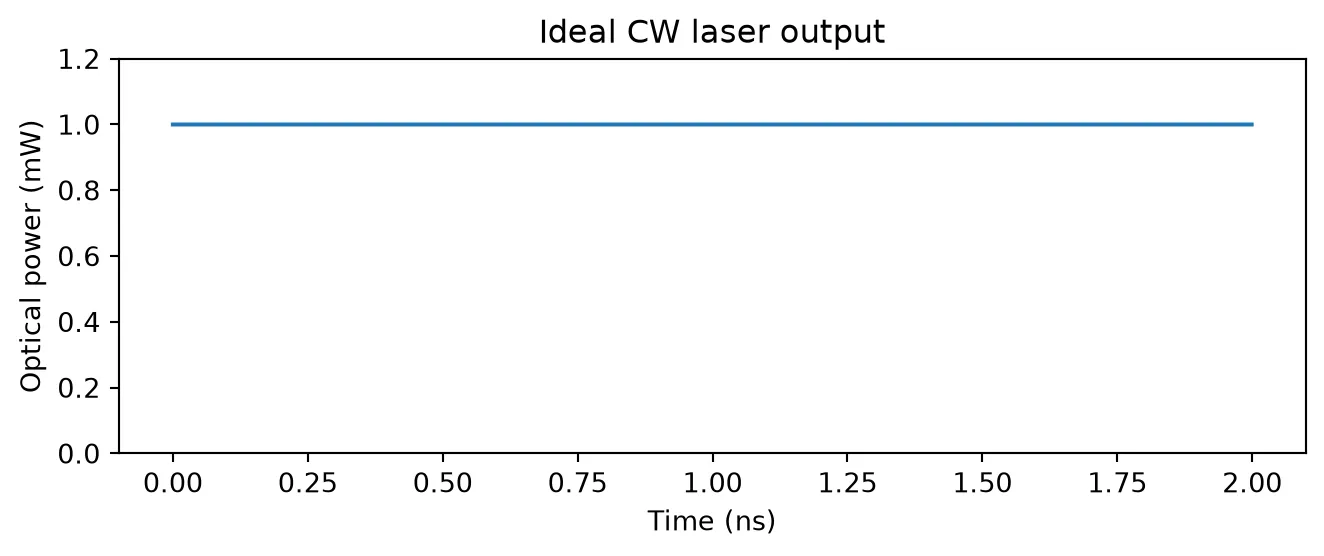
Laser Detuning
Section titled “Laser Detuning”If the frequency argument is None (the default), the laser frequency equals the carrier frequency and the envelope is constant. Setting frequency to an absolute value detuned from the carrier by makes the envelope rotate at that rate. PhotonForge uses the phasor convention for the physical field, so a laser at produces the envelope . When mapping an envelope spectrum computed with the standard FFT convention back to absolute optical frequencies, an envelope component at frequency corresponds to the optical frequency .
Below, the laser is detuned 5 GHz above the carrier: the envelope rotates with a 200 ps period and the spectrum shows a single tone at GHz.
# Create a laser detuned from the carrierdetuning = 5e9  # Laser frequency offset from the carrier (Hz)laser_detuned = pfa.cw_laser(power=laser_power, frequency=f0 + detuning)
# Define a longer time grid to resolve the spectrumnum_steps = 4000  # Number of simulation stepst = np.arange(num_steps) * time_step
# Initialize the time stepper and read the envelopetime_stepper = laser_detuned.setup_time_stepper(    time_step=time_step, carrier_frequency=f0)a = time_stepper.step(steps=num_steps, time_step=time_step)["P0@0"]
# Compute the envelope spectrumspectrum = np.abs(np.fft.fftshift(np.fft.fft(a))) / num_steps
# Convert FFT frequencies to optical offsets, flipping the sign for the e^{-j2πft} conventionfreq_offset = -np.fft.fftshift(np.fft.fftfreq(num_steps, time_step))order = np.argsort(freq_offset)
# Plot the envelope in time and its spectrumplot_steps = 500  # Number of samples shown in the time tracefig, (ax1, ax2) = plt.subplots(1, 2, figsize=(7, 3), tight_layout=True)ax1.plot(t[:plot_steps] * 1e9, np.real(a[:plot_steps]), label="Real")ax1.plot(t[:plot_steps] * 1e9, np.imag(a[:plot_steps]), label="Imaginary")ax1.set(xlabel="Time (ns)", ylabel=r"Envelope amplitude ($\sqrt{\mathrm{W}}$)")ax1.legend(loc="upper right", fontsize=8)ax2.plot(freq_offset[order] / 1e9, spectrum[order])ax2.set(xlabel="$f - f_0$ (GHz)", ylabel="Envelope spectrum", xlim=(-15, 15))
# Print the frequency of the spectral peakprint(f"Spectral peak at {freq_offset[np.argmax(spectrum)] / 1e9:.1f} GHz")
Spectral peak at 5.0 GHz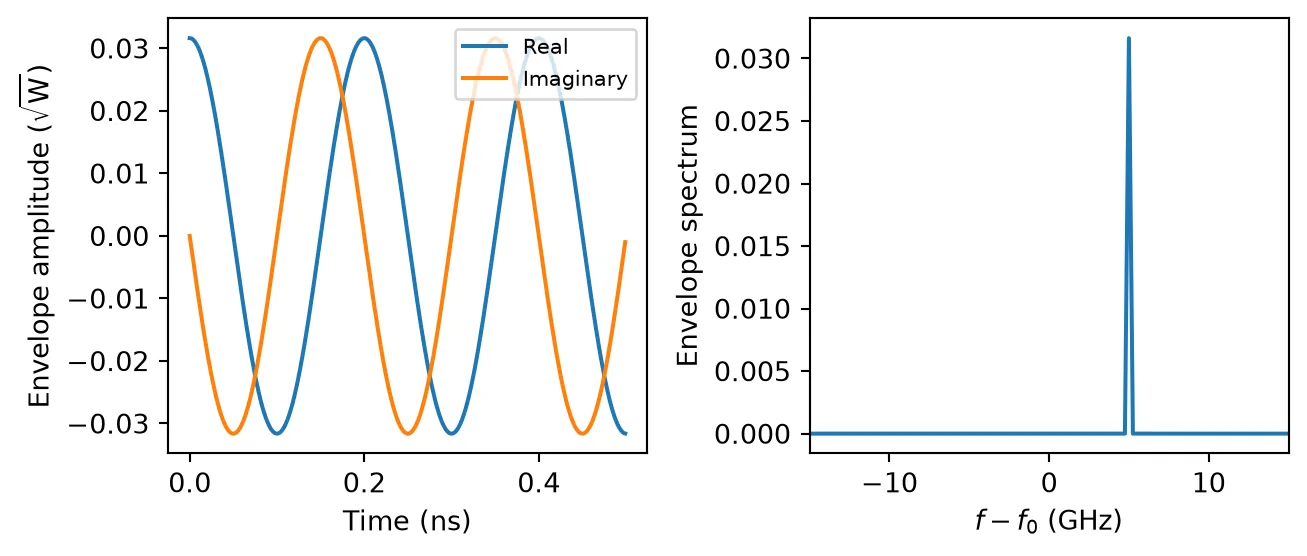
Frequency Chirp
Section titled “Frequency Chirp”Swept-frequency sources such as FMCW lidar need a laser whose frequency ramps linearly in time. Three arguments turn the CW laser into a chirped source:
chirp_bandwidth: the total frequency excursion , centered onfrequency(or on the carrier whenfrequencyisNone). Zero, the default, disables the chirp.chirp_period: the duration of one complete sweep. It must be set together withchirp_bandwidth; setting only one of the two has no effect and issues a warning.chirp_waveform:"sawtooth"(default) ramps up over the whole period and resets, while"triangle"ramps up over the first half of the period and back down over the second.
The sweep rate is for the sawtooth and for the triangle. The time stepper integrates the instantaneous frequency step by step, so the accumulated phase follows the ideal quadratic ramp. The chirp adds to the detuning, the linewidth, and the RIN, which can all be enabled at the same time.
Below, both waveforms sweep 40 GHz in 1 ns around the carrier. The instantaneous frequency is recovered from the phase increment between consecutive samples, using the sign convention of the previous section.
# Define the chirp and the time gridchirp_bandwidth = 40e9  # Total frequency excursion of the sweep (Hz)chirp_period = 1e-9  # Duration of one sweep (s)num_steps = 3000  # Number of simulation stepst = np.arange(num_steps) * time_step
# Simulate both waveforms and plot their instantaneous frequencyfig, ax = plt.subplots(figsize=(7, 3), tight_layout=True)for waveform in ("sawtooth", "triangle"):    # Create the chirped laser for this waveform    laser_chirp = pfa.cw_laser(        power=laser_power,        chirp_bandwidth=chirp_bandwidth,        chirp_period=chirp_period,        chirp_waveform=waveform,  # Shape of the frequency sweep    )
    # Run the simulation and read the envelope    time_stepper = laser_chirp.setup_time_stepper(        time_step=time_step, carrier_frequency=f0, show_progress=False    )    a = time_stepper.step(steps=num_steps, time_step=time_step, show_progress=False)[        "P0@0"    ]
    # Recover the frequency offset from the phase increment between samples    inst_freq = -np.diff(np.unwrap(np.angle(a))) / (2 * np.pi * time_step)    ax.plot(t[1:] * 1e9, inst_freq / 1e9, label=waveform)
    # Print the range covered by the sweep    print(f"{waveform}: {inst_freq.min() / 1e9:.1f} to {inst_freq.max() / 1e9:.1f} GHz")
ax.set(xlabel="Time (ns)", ylabel="$f - f_0$ (GHz)")_ = ax.legend(loc="upper right", fontsize=8)
sawtooth: -20.0 to 20.0 GHztriangle: -20.0 to 20.0 GHz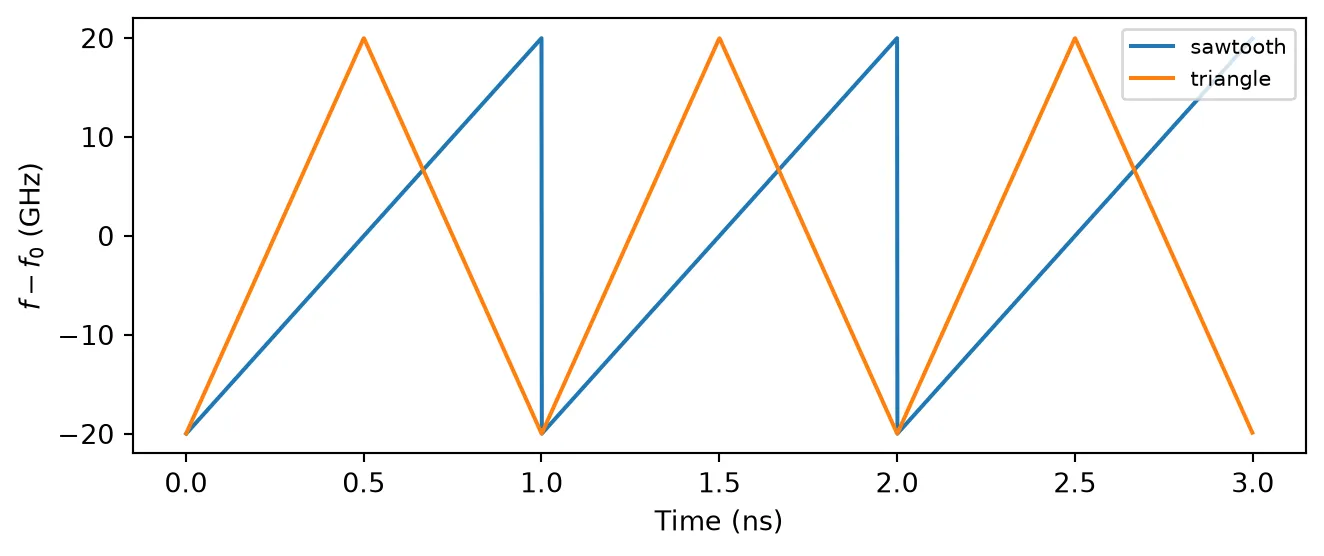
The frequency stays within of the carrier, and the triangle sweeps twice as fast as the sawtooth over each half period. The output power is unchanged, since the chirp only modulates the phase.
Phase Noise and Linewidth
Section titled “Phase Noise and Linewidth”Real lasers have a finite spectral linewidth caused by spontaneous emission phase noise. The time stepper implements it as a discrete-time Wiener process: at each step, the phase receives an independent Gaussian increment with variance
where is the linewidth argument, the full width at half maximum (FWHM) of the resulting Lorentzian field spectrum
The seed argument makes each noise realization reproducible. We use a 100 MHz linewidth to keep the simulation short (single-frequency semiconductor lasers typically range from kHz to a few MHz) and check the two signatures of this noise model: the phase performs a random walk, and the averaged power spectrum of the field envelope follows the expected Lorentzian lineshape.
# Create a laser with phase noiselinewidth = 100e6  # Lorentzian linewidth, full width at half maximum (Hz)laser_pn = pfa.cw_laser(power=laser_power, linewidth=linewidth, seed=0)
# Define a coarser time grid and split it into segments for spectrum averagingtime_step_pn = 1e-11  # Simulation time step for the noise studies (s)num_steps = 2**17  # Number of simulation stepsnum_segments = 16  # Number of segments averaged in each spectrumseg_len = num_steps // num_segmentst = np.arange(num_steps) * time_step_pn
fig, (ax1, ax2) = plt.subplots(1, 2, figsize=(7, 3), tight_layout=True)
# Accumulate the power spectrum over several noise realizationsnum_seeds = 3  # Number of random seeds simulatedspectrum = np.zeros(seg_len)for seed in range(num_seeds):    # Run the laser with this seed    laser_pn.update(seed=seed)    time_stepper = laser_pn.setup_time_stepper(        time_step=time_step_pn, carrier_frequency=f0, show_progress=False    )    a = time_stepper.step(steps=num_steps, time_step=time_step_pn, show_progress=False)[        "P0@0"    ]
    # Plot the random walk of the optical phase    ax1.plot(t * 1e6, np.unwrap(np.angle(a)), label=f"seed={seed}")
    # Add the power spectrum of every segment    for i in range(num_segments):        seg = a[i * seg_len : (i + 1) * seg_len]        spectrum += np.abs(np.fft.fftshift(np.fft.fft(seg))) ** 2
# Normalize the spectrum to its peakspectrum /= spectrum.max()
# Compute the expected Lorentzian line shape on the physical frequency axisfreq = -np.fft.fftshift(np.fft.fftfreq(seg_len, time_step_pn))lorentzian = 1 / (1 + (2 * freq / linewidth) ** 2)
# Measure the full width at half maximum of the simulated spectrumcrossings = freq[spectrum >= 0.5]fwhm = crossings.max() - crossings.min()
# Plot the simulated spectrum against the Lorentzianax1.set(xlabel="Time (µs)", ylabel="Optical phase (rad)")ax1.legend(fontsize=8)ax2.plot(freq / 1e6, spectrum, label="Simulated")ax2.plot(freq / 1e6, lorentzian, "--", label="Lorentzian")ax2.set(xlabel="$f - f_0$ (MHz)", ylabel="Normalized PSD", xlim=(-500, 500))ax2.legend(fontsize=8)
# Print the measured linewidthprint(f"Measured FWHM: {fwhm / 1e6:.0f} MHz (specified: {linewidth / 1e6:.0f} MHz)")
Measured FWHM: 85 MHz (specified: 100 MHz)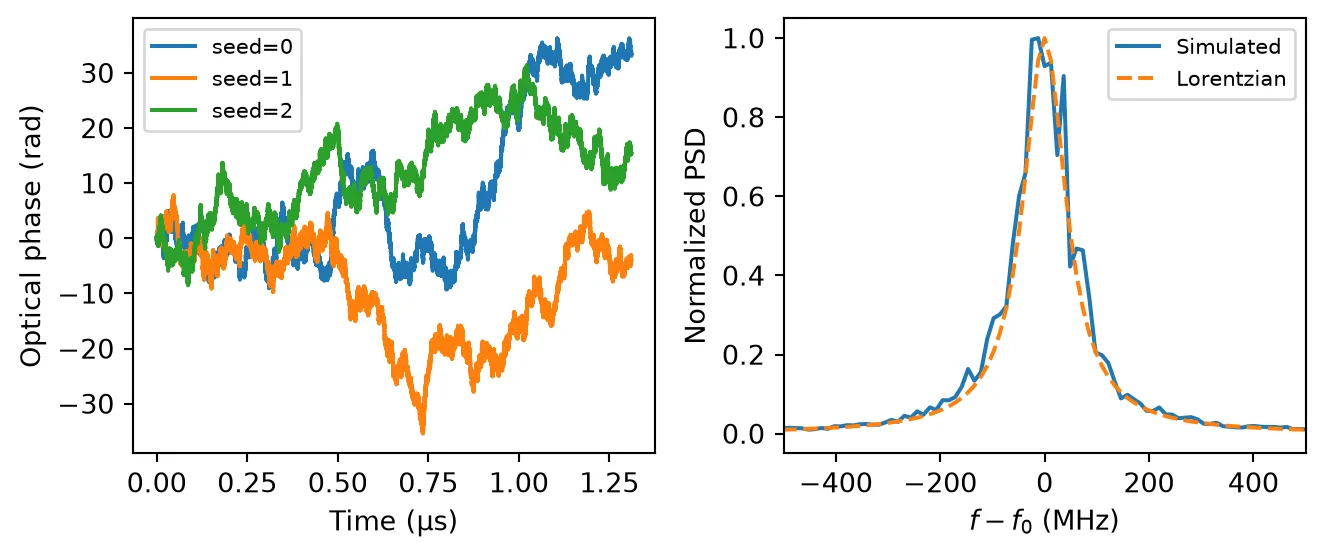
Relative Intensity Noise
Section titled “Relative Intensity Noise”Power fluctuations of a laser are characterized by the relative intensity noise power spectral density, , with units of 1/Hz and usually quoted in dB/Hz. The rel_intensity_noise argument sets a one-sided white RIN PSD: at each time step, the power receives an independent Gaussian fluctuation with variance
which corresponds to the specified PSD band-limited by the Nyquist frequency of the simulation (the power is also clamped at zero). Typical semiconductor lasers show RIN levels between -160 and -130 dB/Hz. We configure -140 dB/Hz and verify that the one-sided PSD of the simulated relative power fluctuations is white at the specified level.
# Create a laser with relative intensity noiserin_db = -140  # Relative intensity noise level (dB/Hz)laser_rin = pfa.cw_laser(    power=laser_power, rel_intensity_noise=10 ** (rin_db / 10), seed=0)
# Run the simulation and compute the optical powertime_stepper = laser_rin.setup_time_stepper(    time_step=time_step_pn, carrier_frequency=f0, show_progress=False)a = time_stepper.step(steps=num_steps, time_step=time_step_pn, show_progress=False)[    "P0@0"]power = np.abs(a) ** 2
# Average the one-sided power fluctuation spectrum over all segmentspsd = np.zeros(seg_len // 2 + 1)for i in range(num_segments):    seg = power[i * seg_len : (i + 1) * seg_len]    psd += 2 * np.abs(np.fft.rfft(seg - seg.mean())) ** 2 * time_step_pn / seg_len
# Normalize by the squared mean power to obtain the RINpsd /= num_segments * power.mean() ** 2freq = np.fft.rfftfreq(seg_len, time_step_pn)
# Plot the power trace and the RIN spectrum against the specified levelplot_steps = 2000  # Number of samples shown in the time tracefig, (ax1, ax2) = plt.subplots(1, 2, figsize=(7, 3), tight_layout=True)ax1.plot(t[:plot_steps] * 1e9, power[:plot_steps] * 1e3)ax1.set(xlabel="Time (ns)", ylabel="Optical power (mW)")ax2.semilogx(freq[1:] / 1e9, 10 * np.log10(psd[1:]), label="Simulated")ax2.axhline(rin_db, color="tab:orange", linestyle="--", label="Specified RIN")ax2.set(xlabel="Frequency (GHz)", ylabel="RIN (dB/Hz)", ylim=(rin_db - 15, rin_db + 15))ax2.legend(fontsize=8)
# Print the measured RINprint(    f"Measured RIN: {10 * np.log10(psd[1:].mean()):.1f} dB/Hz (specified: {rin_db} dB/Hz)")
Measured RIN: -140.0 dB/Hz (specified: -140 dB/Hz)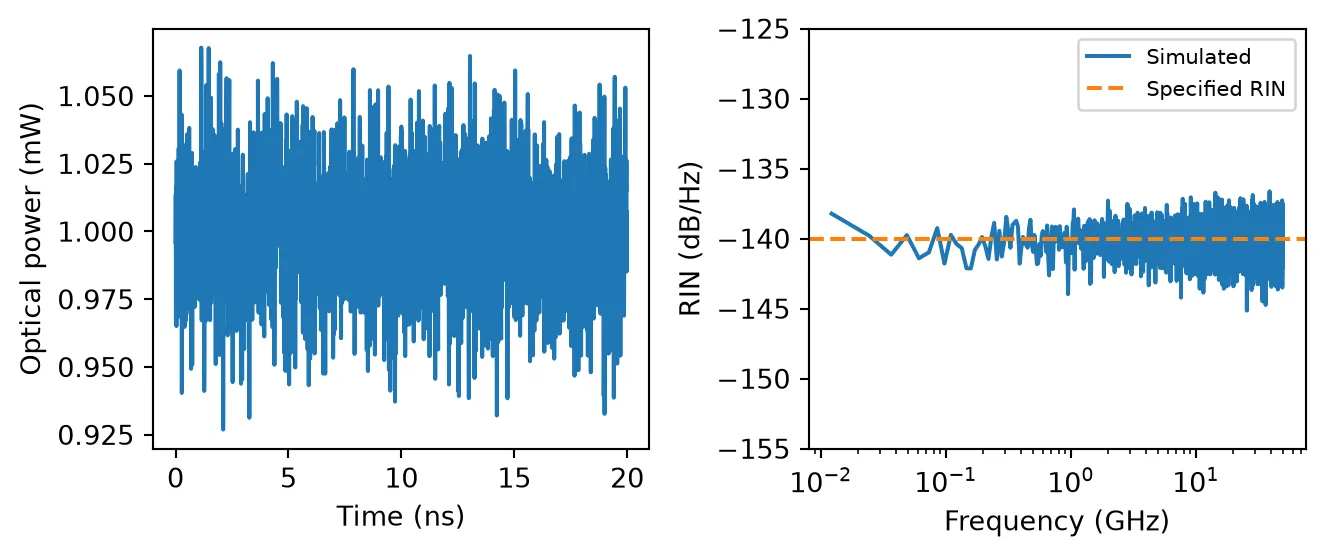
Laser Noise at a Detector
Section titled “Laser Noise at a Detector”Abstract components can be wired into circuits like any other PhotonForge component. Here we connect the laser to a photodiode with responsivity A/W and compare the detected signal with the laser RIN disabled and enabled. The photodiode outputs the voltage , where is the transimpedance gain (1 V/A by default), converted to an electrical wave amplitude at its port.
The photodiode model generates its own shot noise, with a relative PSD of , about -154 dB/Hz at the detected power in this link. This sets the noise floor of the ideal link, while the laser RIN of -140 dB/Hz sits 14 dB above it and dominates the detected noise. Since the parametric update method modifies the laser in place, the same circuit can be re-simulated with new laser parameters without rebuilding it.
# Define the photodiode and the loadresponsivity = 0.8  # Photodiode responsivity (A/W)z0 = 50.0  # Load impedance (Ω)
# Create the laser and the photodiodelaser_link = pfa.cw_laser(power=laser_power)photodiode = pfa.photodiode(responsivity=responsivity, seed=7)
# Connect the laser output to the photodiode inputlink = pf.Component("detection_link")laser_ref = link.add_reference(laser_link)photodiode_ref = link.add_reference(photodiode)photodiode_ref.connect("P0", laser_ref["P0"])
# Expose the electrical output and attach the circuit modellink.add_port(photodiode_ref["E0"])link.add_model(pf.CircuitModel(), "Circuit")
# Simulate the link without and with laser RINvoltages = {}for label, rin in [("Ideal laser", 0), ("Laser with RIN", 10 ** (rin_db / 10))]:    # Update the laser noise and run the circuit    laser_link.update(rel_intensity_noise=rin, seed=3)    time_stepper = link.setup_time_stepper(        time_step=time_step_pn, carrier_frequency=f0, show_progress=False    )    output = time_stepper.step(        steps=num_steps, time_step=time_step_pn, show_progress=False    )
    # Convert the port amplitude to the voltage across the load    voltages[label] = np.real(output["E0@0"]) * np.sqrt(z0)
# Compute the shot noise floor of the detected photocurrentq_e = 1.602176634e-19  # Elementary charge (C)shot_db = 10 * np.log10(2 * q_e / (responsivity * laser_power))
fig, (ax1, ax2) = plt.subplots(1, 2, figsize=(7, 3), tight_layout=True)for label, v in voltages.items():    # Plot the detected voltage trace    ax1.plot(t[:plot_steps] * 1e9, v[:plot_steps] * 1e3, label=label, alpha=0.8)
    # Average the noise spectrum over all segments    psd = np.zeros(seg_len // 2 + 1)    for i in range(num_segments):        seg = v[i * seg_len : (i + 1) * seg_len]        psd += 2 * np.abs(np.fft.rfft(seg - seg.mean())) ** 2 * time_step_pn / seg_len
    # Normalize by the squared mean voltage and plot in dB    psd /= num_segments * v.mean() ** 2    ax2.semilogx(freq[1:] / 1e9, 10 * np.log10(psd[1:]), label=label, alpha=0.8)
    # Print the mean detected noise level    print(f"{label}: detected noise PSD {10 * np.log10(psd[1:].mean()):.1f} dB/Hz")
# Mark the laser RIN and the shot noise floorax1.set(xlabel="Time (ns)", ylabel="Detected voltage (mV)")ax1.legend(fontsize=8)ax2.axhline(rin_db, color="k", linestyle="--", linewidth=1, label="Laser RIN")ax2.axhline(shot_db, color="k", linestyle=":", linewidth=1, label="Shot noise floor")ax2.set(    xlabel="Frequency (GHz)", ylabel="Relative noise PSD (dB/Hz)", ylim=(-160, -130))_ = ax2.legend(fontsize=8, loc="upper left")
Ideal laser: detected noise PSD -154.0 dB/HzLaser with RIN: detected noise PSD -139.8 dB/Hz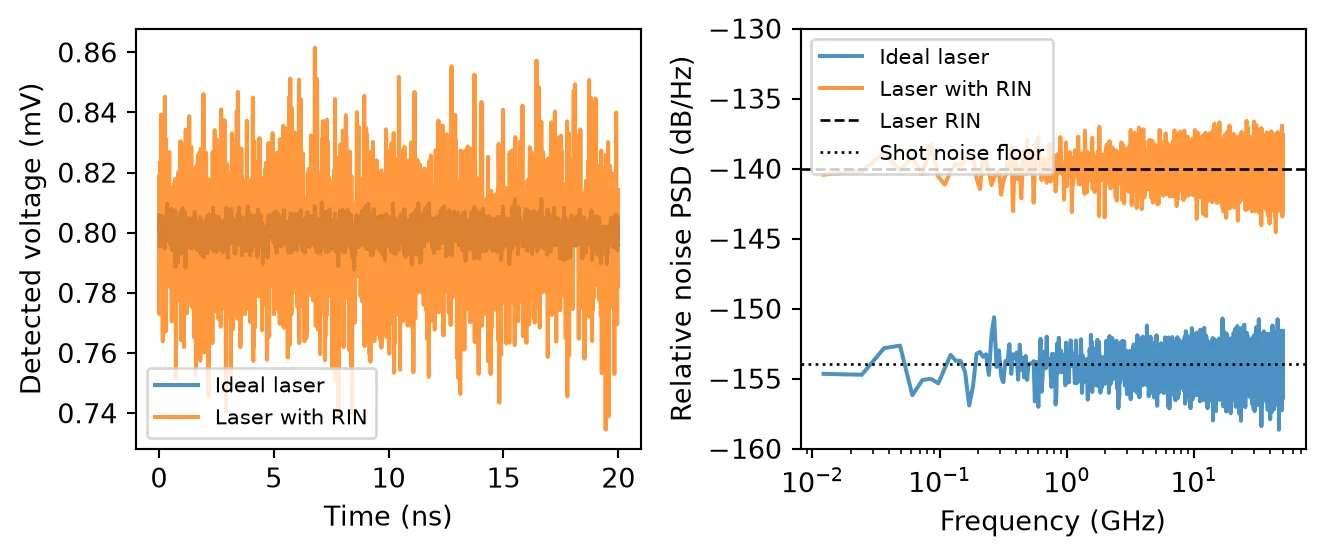
The detected noise matches the expected levels: the ideal-laser link is limited by the photodiode shot noise near -154 dB/Hz, and enabling the laser RIN raises the detected noise to the configured -140 dB/Hz.
Summary
Section titled “Summary”- The CW laser is the basic optical source for time-domain simulations: create it with
pfa.cw_laser, initialize withsetup_time_stepper(time step and carrier frequency), and run withstep. - Optical envelope amplitudes are in , so is the instantaneous power; the mean power is set by
power. frequencysets the absolute laser frequency: detuning from the carrier by rotates the envelope as .chirp_bandwidth,chirp_period, andchirp_waveformsweep the laser frequency linearly for swept-source applications.linewidthadds Wiener phase noise producing a Lorentzian line with the specified FWHM, andrel_intensity_noiseadds a white one-sided RIN PSD;seedmakes noise realizations reproducible.- Sources combine with modulators, waveguides, and detectors from the abstract module for circuit-level studies. For a directly modulated laser with rate-equation dynamics, see DMLaserTimeStepper, and to add optical noise to any existing signal, see OpticalNoiseTimeStepper.