

Analytic Waveguide Model
The AnalyticWaveguideModel provides a compact, physically meaningful description of 2-port waveguide components — straight waveguides, bends, and electro-optic (EO) phase shifters. It captures:
| Feature | Parameters |
|---|---|
| Propagation | , |
| Dispersion | (chromatic dispersion), (dispersion slope) |
| Loss | (propagation loss per unit length), (extra loss, e.g. bend loss) |
| Temperature sensitivity | , |
| Electro-optic modulation | , , |
For each mode, the transmission between ports at frequency is:
where is the waveguide length, is a Taylor-expanded propagation constant around , and is the electro-optic phase shift.
This notebook walks through the model parameter by parameter, building intuition with black_box_component before showing how to fit it to FDTD results on a real waveguide.
import matplotlib.pyplot as pltimport numpy as npimport photonforge as pfimport tidy3d as tdlossy_si = td.Medium.from_nk(n=3.475, k=1.4e-5, freq=pf.C_0 / 1.55)tech = pf.basic_technology(core_medium=lossy_si, strip_width=0.5)pf.config.default_technology = tech
wavelengths = np.linspace(1.5, 1.6, 101)freqs = pf.C_0 / wavelengthsBasic Waveguide: Effective Index and Group Index
Section titled “Basic Waveguide: Effective Index and Group Index”The simplest use of AnalyticWaveguideModel requires only n_eff. We use black_box_component to quickly create a test component without defining a physical layout.
The propagation constant is expanded as a Taylor series around the reference frequency :
where and . When n_group is not specified it defaults to n_eff, making the waveguide non-dispersive.
model_basic = pf.AnalyticWaveguideModel(    n_eff=2.4,    n_group=4.2,    length=100,)
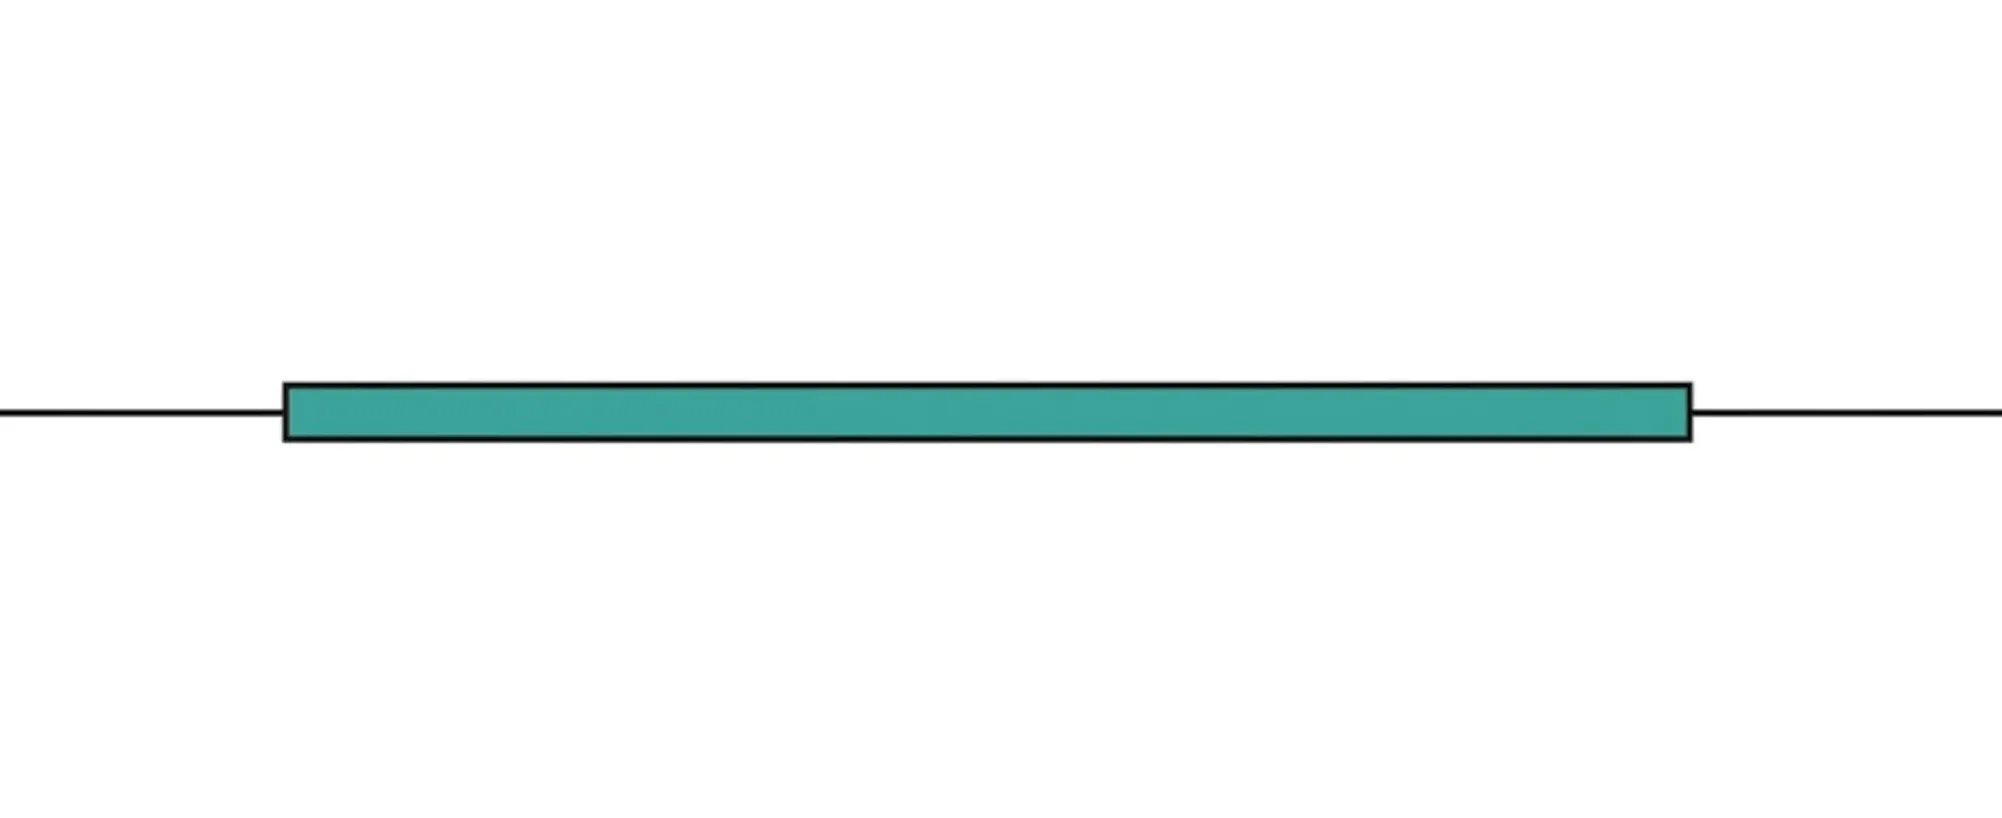
bb_basic = model_basic.black_box_component(port_spec="Strip")bb_basic
The S matrix of this lossless, dispersion-free waveguide has unit magnitude and a linearly varying phase:
s_basic = bb_basic.s_matrix(freqs)pf.plot_s_matrix(s_basic)plt.suptitle("Lossless waveguide — Magnitude", y=1.02)plt.show()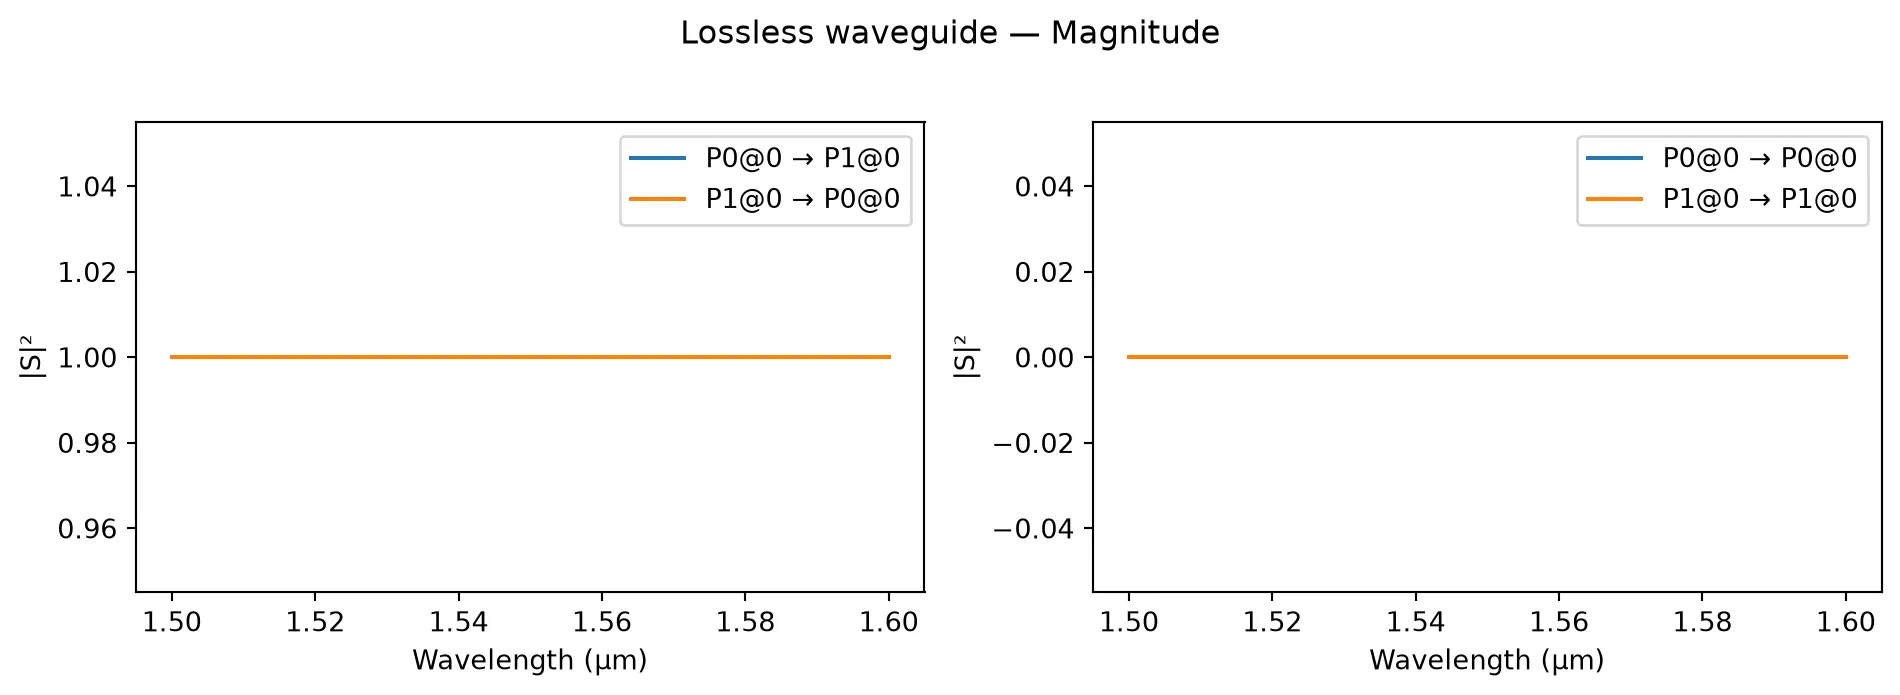
pf.plot_s_matrix(s_basic, y="phase")plt.suptitle("Lossless waveguide — Phase", y=1.02)plt.show()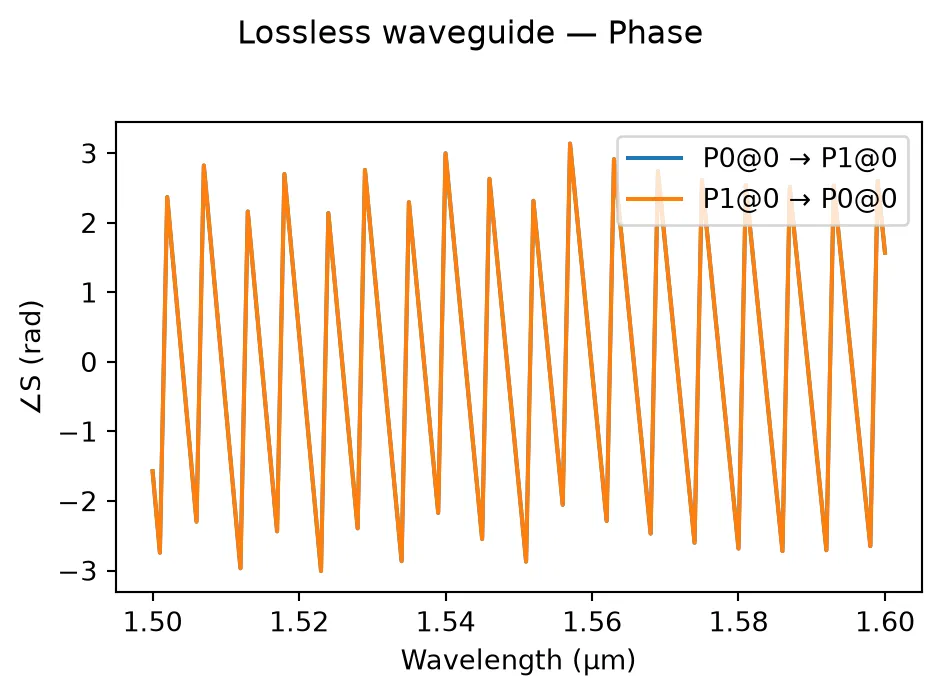
Effect of group index on phase slope
Section titled “Effect of group index on phase slope”The group index controls how rapidly the phase changes with frequency. A larger group index means a steeper phase slope. Below we compare three different group indices while keeping fixed.
port_names = sorted(s_basic.ports)s_key = (f"{port_names[0]}@0", f"{port_names[1]}@0")
fig, ax = plt.subplots(figsize=(7, 4))for ng in [2.4, 4.2, 5.0]:    m = pf.AnalyticWaveguideModel(n_eff=2.4, n_group=ng, length=100)    bb = m.black_box_component(port_spec="Strip")    s = bb.s_matrix(freqs)    pn = sorted(s.ports)    key = (f"{pn[0]}@0", f"{pn[1]}@0")    ax.plot(wavelengths, np.unwrap(np.angle(s[key])), label=f"$n_{{group}} = {ng}$")
ax.set_xlabel("Wavelength (µm)")ax.set_ylabel("Phase (rad)")ax.set_title("Through-port phase for different group indices ($\\ell = 100$ µm)")ax.legend()fig.tight_layout()plt.show()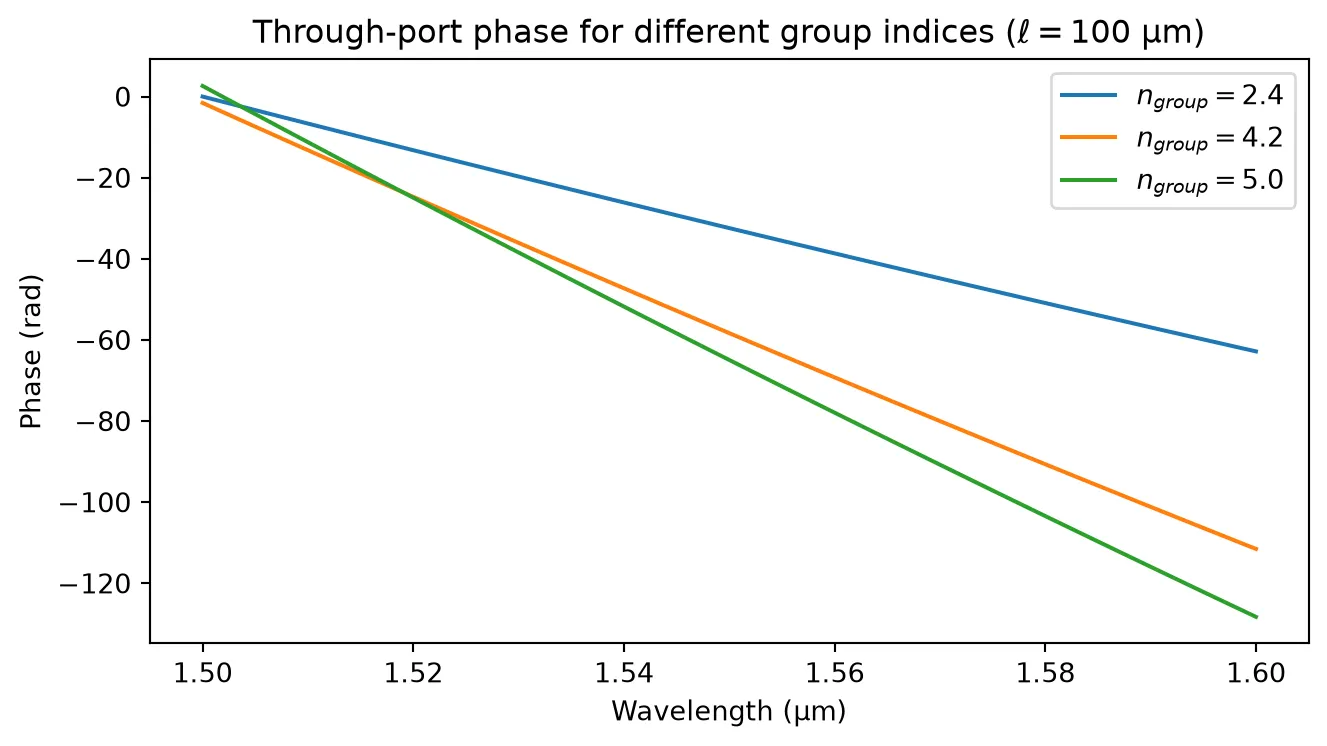
Chromatic Dispersion
Section titled “Chromatic Dispersion”Real waveguides exhibit chromatic dispersion: the group velocity varies with wavelength. The model captures this through the dispersion coefficient and the dispersion slope :
Let’s compare a non-dispersive waveguide with two dispersive ones.
f0 = pf.C_0 / 1.55
fig, axes = plt.subplots(1, 2, figsize=(12, 4))
dispersions = [0, 2e-14, 4e-14]labels = ["$D = 0$", "$D = 2 \\times 10^{-14}$", "$D = 4 \\times 10^{-14}$"]
for D, label in zip(dispersions, labels):    m = pf.AnalyticWaveguideModel(        n_eff=2.4,        n_group=4.2,        length=1000,        dispersion=D,        reference_frequency=f0,    )    bb = m.black_box_component(port_spec="Strip")    s = bb.s_matrix(freqs)    pn = sorted(s.ports)    key = (f"{pn[0]}@0", f"{pn[1]}@0")    phase = np.unwrap(np.angle(s[key]))
    axes[0].plot(wavelengths, np.abs(s[key]) ** 2, label=label)    axes[1].plot(wavelengths, phase - phase[len(phase) // 2], label=label)
axes[0].set_xlabel("Wavelength (µm)")axes[0].set_ylabel("$|S_{12}|^2$")axes[0].set_title("Power (unchanged by dispersion)")axes[0].legend()
axes[1].set_xlabel("Wavelength (µm)")axes[1].set_ylabel("Phase − phase at centre (rad)")axes[1].set_title("Phase curvature from dispersion ($\\ell = 1000$ µm)")axes[1].legend()
fig.tight_layout()plt.show()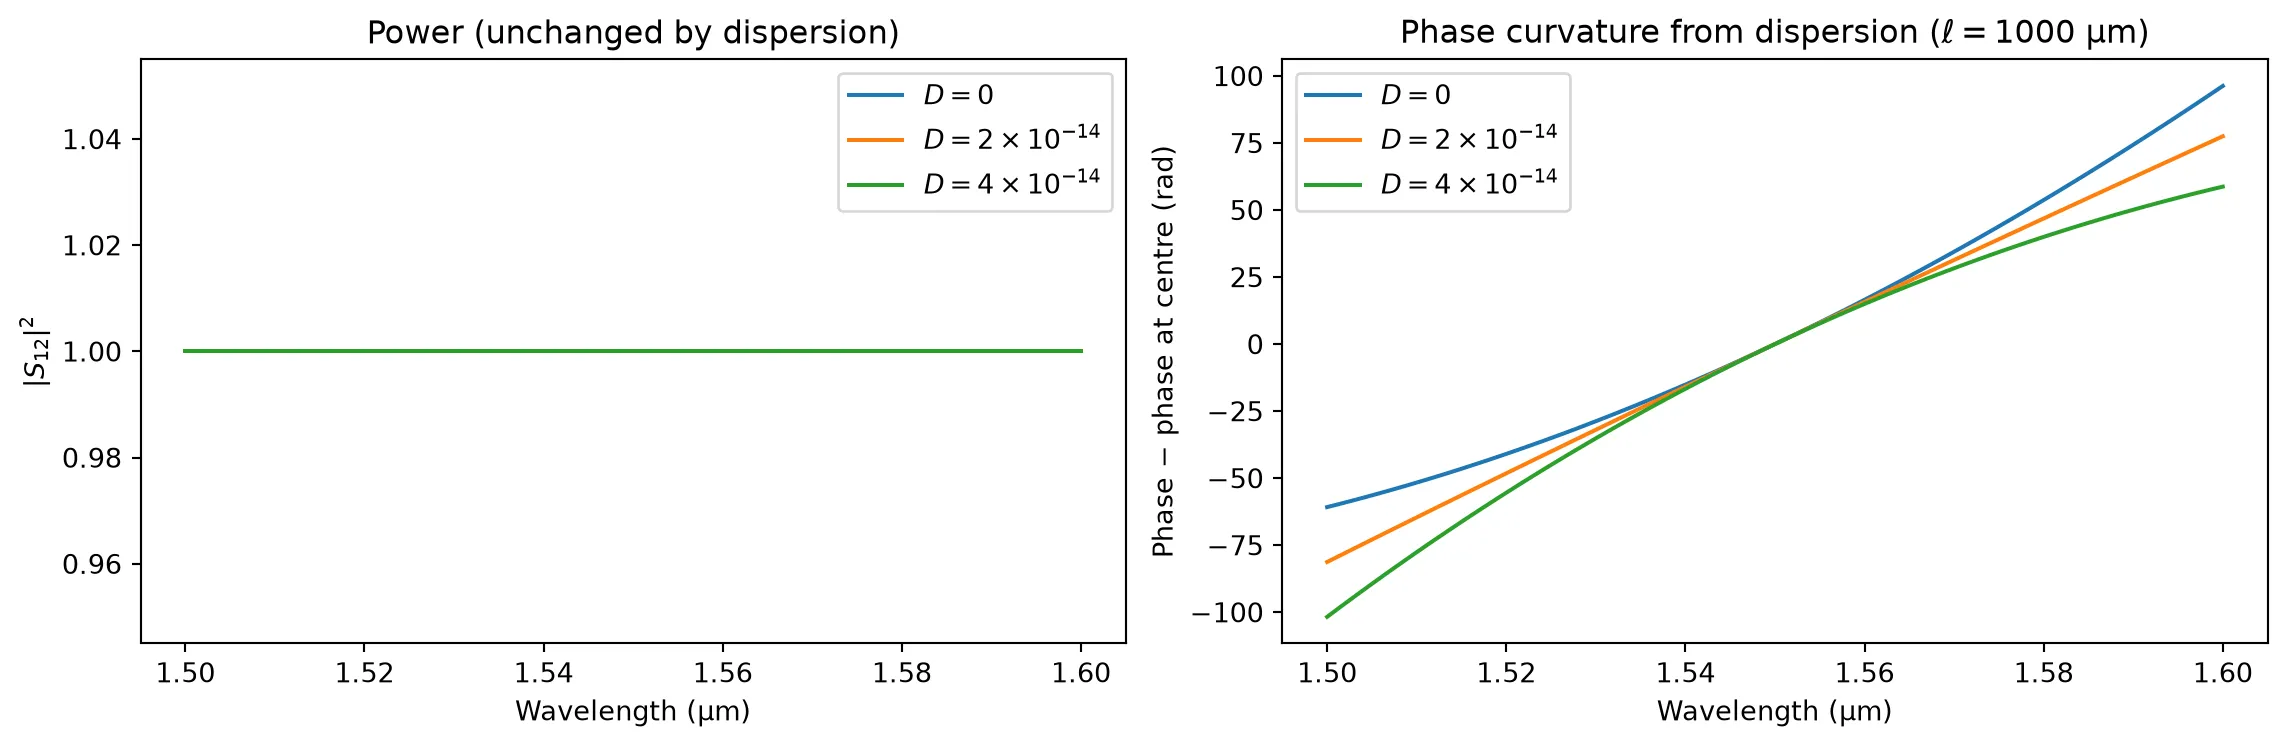
Dispersion does not change the transmitted power — it only curves the phase response. This matters in systems where precise phase relationships are needed (e.g. ring resonators, MZIs operating over a broad bandwidth).
Loss: Propagation Loss and Extra Loss
Section titled “Loss: Propagation Loss and Extra Loss”The total loss in dB is:
- Propagation loss (dB/µm): scales linearly with waveguide length — typical for scattering and absorption losses.
- Extra loss (dB): a length-independent penalty, useful for modelling bend loss, mode-mismatch loss at junctions, etc.
Below we sweep waveguide length and compare the three cases.
f_center = np.array([pf.C_0 / 1.55])lengths = np.linspace(10, 500, 5)
cases = [    {"propagation_loss": 0.0,   "extra_loss": 0.0, "label": "Lossless"},    {"propagation_loss": 2e-3,  "extra_loss": 0.0, "label": "$L_p = 2$ dB/mm"},    {"propagation_loss": 2e-3,  "extra_loss": 0.5, "label": "$L_p = 2$ dB/mm, $L_0 = 0.5$ dB"},]
fig, ax = plt.subplots(figsize=(7, 4))for case in cases:    insertion_loss = []    for length in lengths:        m = pf.AnalyticWaveguideModel(            n_eff=2.4,            n_group=4.2,            length=length,            propagation_loss=case["propagation_loss"],            extra_loss=case["extra_loss"],        )        bb = m.black_box_component(port_spec="Strip")        s = bb.s_matrix(f_center)        pn = sorted(s.ports)        key = (f"{pn[0]}@0", f"{pn[1]}@0")        insertion_loss.append(-20 * np.log10(np.abs(s[key][0])))    ax.plot(lengths, insertion_loss, label=case["label"])
ax.set_xlabel("Waveguide length (µm)")ax.set_ylabel("Insertion loss (dB)")ax.set_title("Loss vs. length at $\\lambda = 1.55$ µm")ax.legend()fig.tight_layout()plt.show()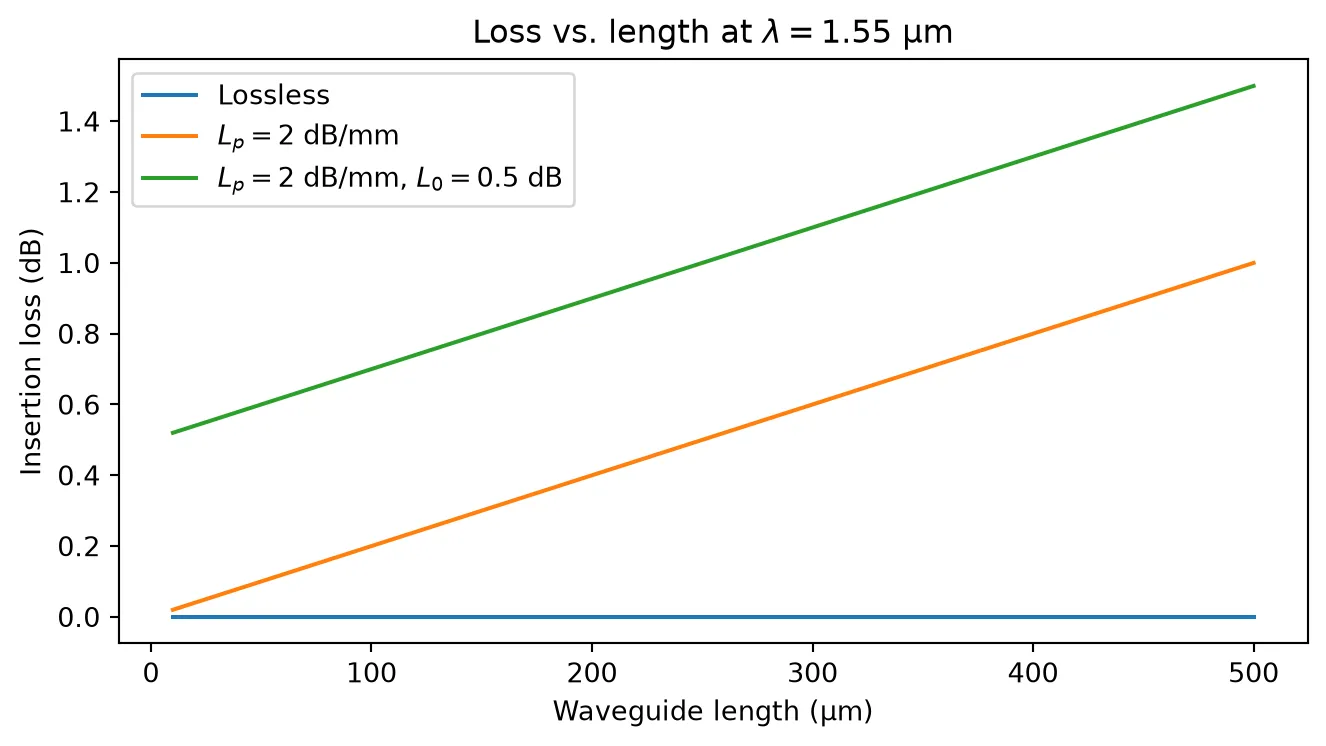
Temperature Sensitivity
Section titled “Temperature Sensitivity”The model accounts for temperature-dependent shifts in the effective index and propagation loss:
We will use the thermo-optic coefficient for bulk silicon () as a rough approximation. Below we sweep temperature and observe the resulting phase shift.
T_ref = 293.0temperatures = np.linspace(293, 353, 5)
fig, axes = plt.subplots(1, 2, figsize=(12, 4))
for T in temperatures:    m = pf.AnalyticWaveguideModel(        n_eff=2.4,        n_group=4.2,        length=200,        dn_dT=1.8e-4,        temperature=T,        reference_temperature=T_ref,        reference_frequency=f0,    )    bb = m.black_box_component(port_spec="Strip")    s = bb.s_matrix(freqs)    pn = sorted(s.ports)    key = (f"{pn[0]}@0", f"{pn[1]}@0")    axes[0].plot(wavelengths, np.abs(s[key]) ** 2, label=f"T = {T:.0f} K")    axes[1].plot(wavelengths, np.unwrap(np.angle(s[key])), label=f"T = {T:.0f} K")
axes[0].set_xlabel("Wavelength (µm)")axes[0].set_ylabel("$|S_{12}|^2$")axes[0].set_title("Power (unchanged)")axes[0].legend()
axes[1].set_xlabel("Wavelength (µm)")axes[1].set_ylabel("Phase (rad)")axes[1].set_title("Phase shift with temperature ($\\ell = 200$ µm)")axes[1].legend()
fig.tight_layout()plt.show()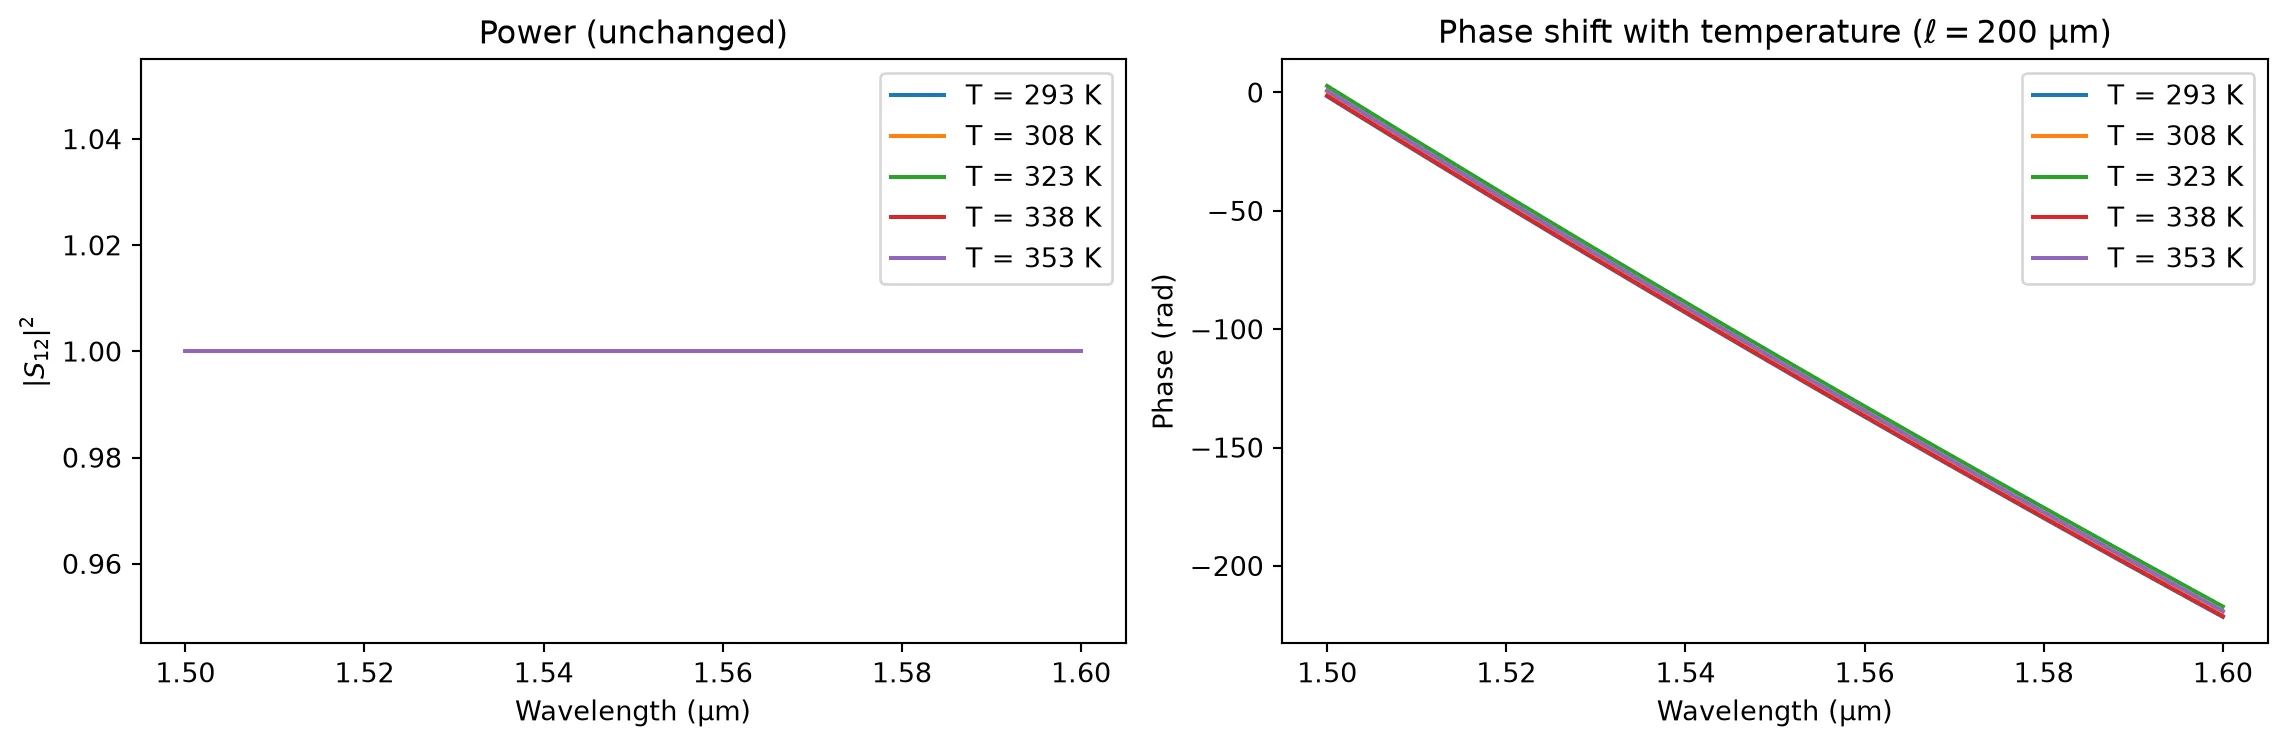
The power remains unchanged because dn_dT is real-valued here; a complex dn_dT would also shift the loss.
Electro-Optic Phase Shifter
Section titled “Electro-Optic Phase Shifter”The model supports EO modulation through three parameters:
- : The voltage–length product (V·µm) required for a phase shift. The EO phase is .
- : Linear voltage-dependent propagation loss (dB/µm/V).
- : Quadratic voltage-dependent propagation loss (dB/µm/V²).
When v_piL is set, the black_box_component automatically uses an EO phase-shifter thumbnail. Below we sweep the applied voltage and observe both phase shift and voltage-dependent loss.
length_eo = 500  # µmv_piL = 10000  # V·µm → V_pi = 20 V for this lengthv_pi = v_piL / length_eo
voltages = np.linspace(0, 2 * v_pi, 11)
phase_shift = []insertion_loss_v = []
for V in voltages:    m = pf.AnalyticWaveguideModel(        n_eff=2.4,        n_group=4.2,        length=length_eo,        propagation_loss=1e-3,        v_piL=v_piL,        dloss_dv=5e-5,        voltage=V,        reference_frequency=f0,    )    bb = m.black_box_component(port_spec="Strip")    s = bb.s_matrix(f_center)    pn = sorted(s.ports)    key = (f"{pn[0]}@0", f"{pn[1]}@0")    phase_shift.append(np.angle(s[key][0]))    insertion_loss_v.append(-20 * np.log10(np.abs(s[key][0])))
phase_shift = np.unwrap(np.array(phase_shift))phase_shift -= phase_shift[0]insertion_loss_v = np.array(insertion_loss_v)
fig, axes = plt.subplots(1, 2, figsize=(12, 4))
ax = axes[0]ax.plot(voltages, phase_shift / np.pi)ax.axhline(1, color="C1", linestyle="--", alpha=0.6, label="$\\pi$ phase shift")ax.axvline(v_pi, color="C2", linestyle=":", alpha=0.6, label=f"$V_\\pi = {v_pi:.0f}$ V")ax.set_xlabel("Voltage (V)")ax.set_ylabel("Phase shift ($\\pi$ rad)")ax.set_title(f"EO phase shift ($\\ell = {length_eo}$ µm, $V_{{\\pi L}} = {v_piL}$ V·µm)")ax.legend()
ax = axes[1]ax.plot(voltages, insertion_loss_v)ax.set_xlabel("Voltage (V)")ax.set_ylabel("Insertion loss (dB)")ax.set_title("Voltage-dependent loss (dL/dV = $5 \\times 10^{-5}$ dB/µm/V)")
fig.tight_layout()plt.show()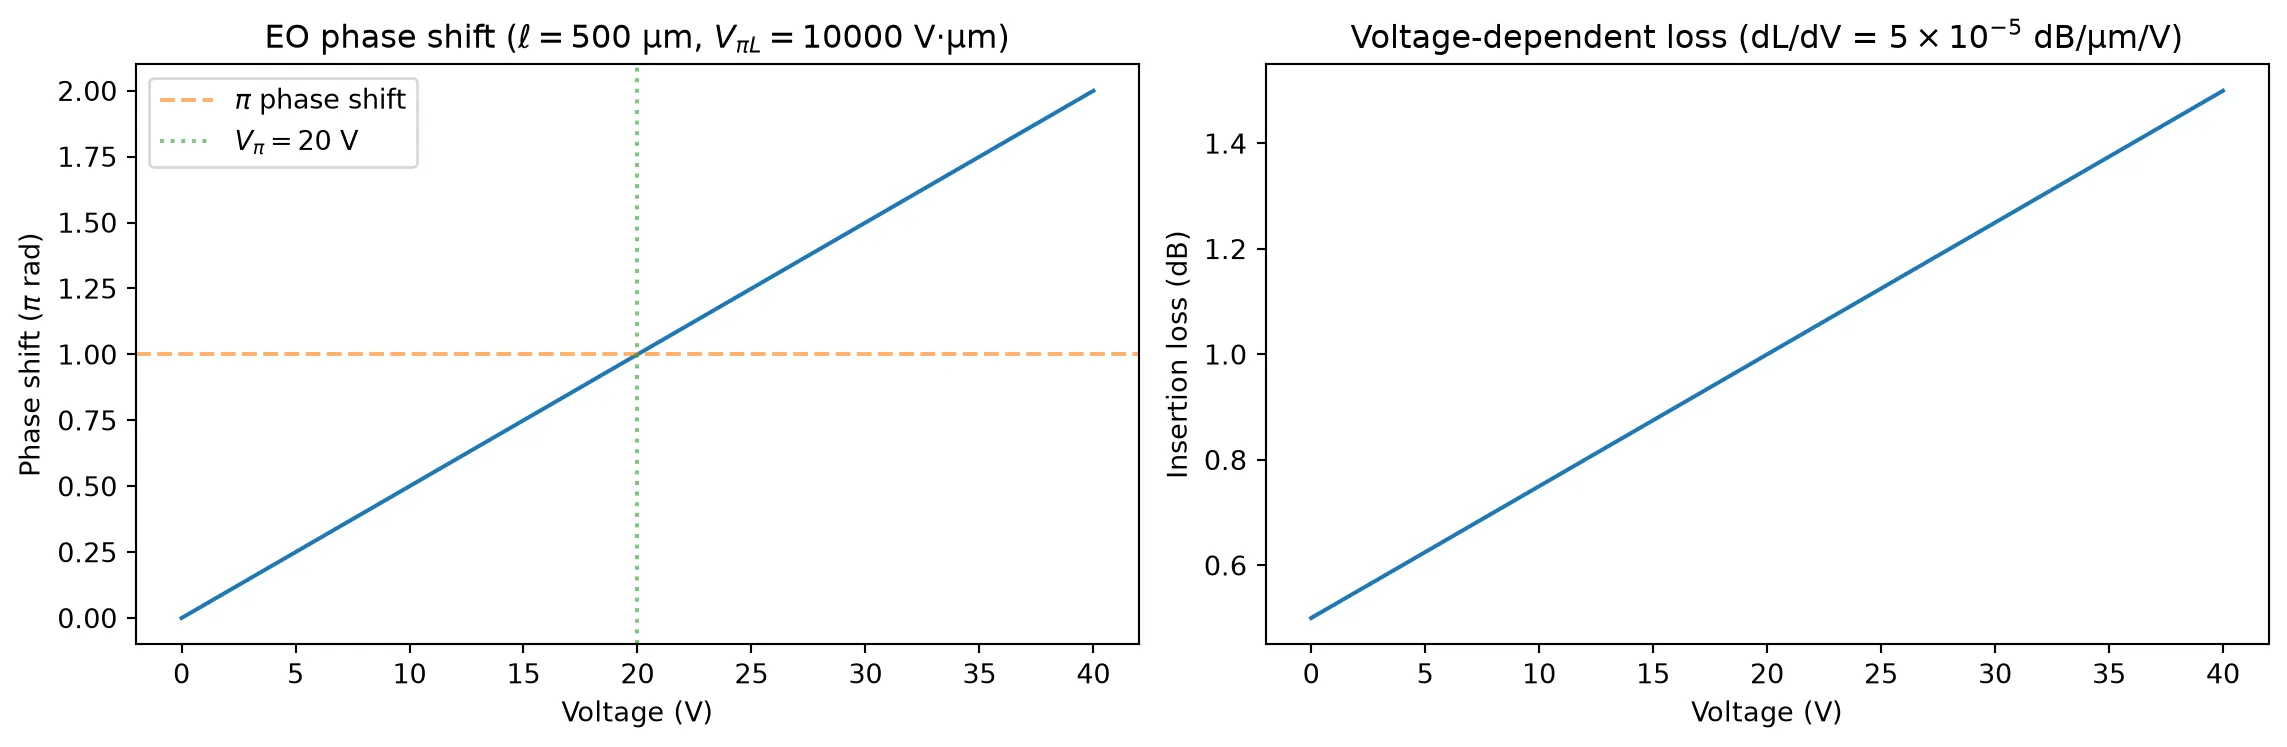
The phase increases linearly with voltage, reaching at . The insertion loss also increases with voltage due to the carrier-induced absorption captured by dloss_dv.
Spectral view at different bias voltages
Section titled “Spectral view at different bias voltages”The voltage parameter can be passed to s_matrix via model_kwargs to override the model default, which is convenient for voltage sweeps without re-creating the model.
model_eo = pf.AnalyticWaveguideModel(    n_eff=2.4,    n_group=4.2,    length=length_eo,    propagation_loss=1e-3,    v_piL=v_piL,    dloss_dv=5e-5,    reference_frequency=f0,)bb_eo = model_eo.black_box_component(port_spec="Strip")
fig, axes = plt.subplots(1, 2, figsize=(12, 4))for V in [0, v_pi / 2, v_pi]:    s = bb_eo.s_matrix(freqs, model_kwargs={"voltage": V})    pn = sorted(s.ports)    key = (f"{pn[0]}@0", f"{pn[1]}@0")    axes[0].plot(wavelengths, np.abs(s[key]) ** 2, label=f"V = {V:.1f} V")    axes[1].plot(wavelengths, np.unwrap(np.angle(s[key])), label=f"V = {V:.1f} V")
axes[0].set_xlabel("Wavelength (µm)")axes[0].set_ylabel("$|S_{12}|^2$")axes[0].set_title("Power at different bias voltages")axes[0].legend()
axes[1].set_xlabel("Wavelength (µm)")axes[1].set_ylabel("Phase (rad)")axes[1].set_title("Phase at different bias voltages")axes[1].legend()
fig.tight_layout()plt.show()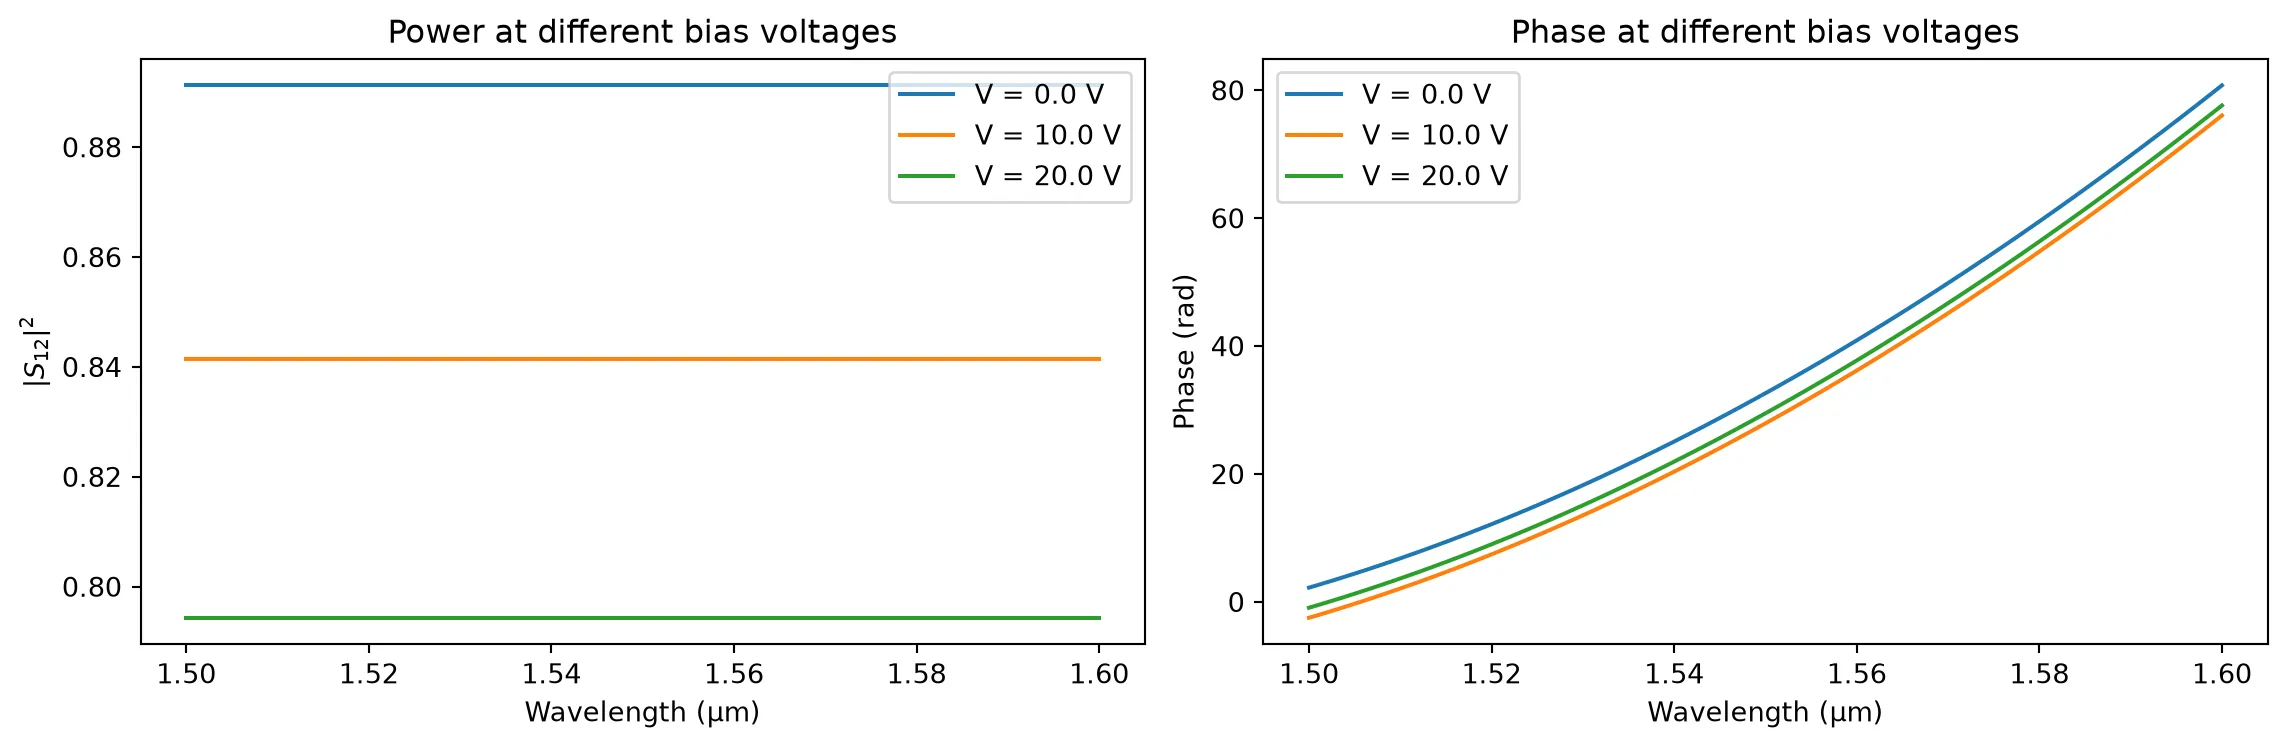
Abstract Component Shortcut
Section titled “Abstract Component Shortcut”For simple use cases where the effective and group indices are known scalars (no mode solver needed), pfa.straight provides a one-line alternative:
Note: When frequency-dependent n_eff/n_group from a mode solver is required (as shown in this guide using
pf.Interpolator),AnalyticWaveguideModel+Interpolatorremains the right choice —pfa.straightonly accepts scalar values.
import photonforge.abstract as pfa
# One-line waveguide with scalar n_eff/n_groupwg = pfa.straight(length=10, n_eff=2.4, n_group=4.0, propagation_loss=0.0)wg