

Time-Domain Simulation of a Mach–Zehnder Modulator (Toy Model)
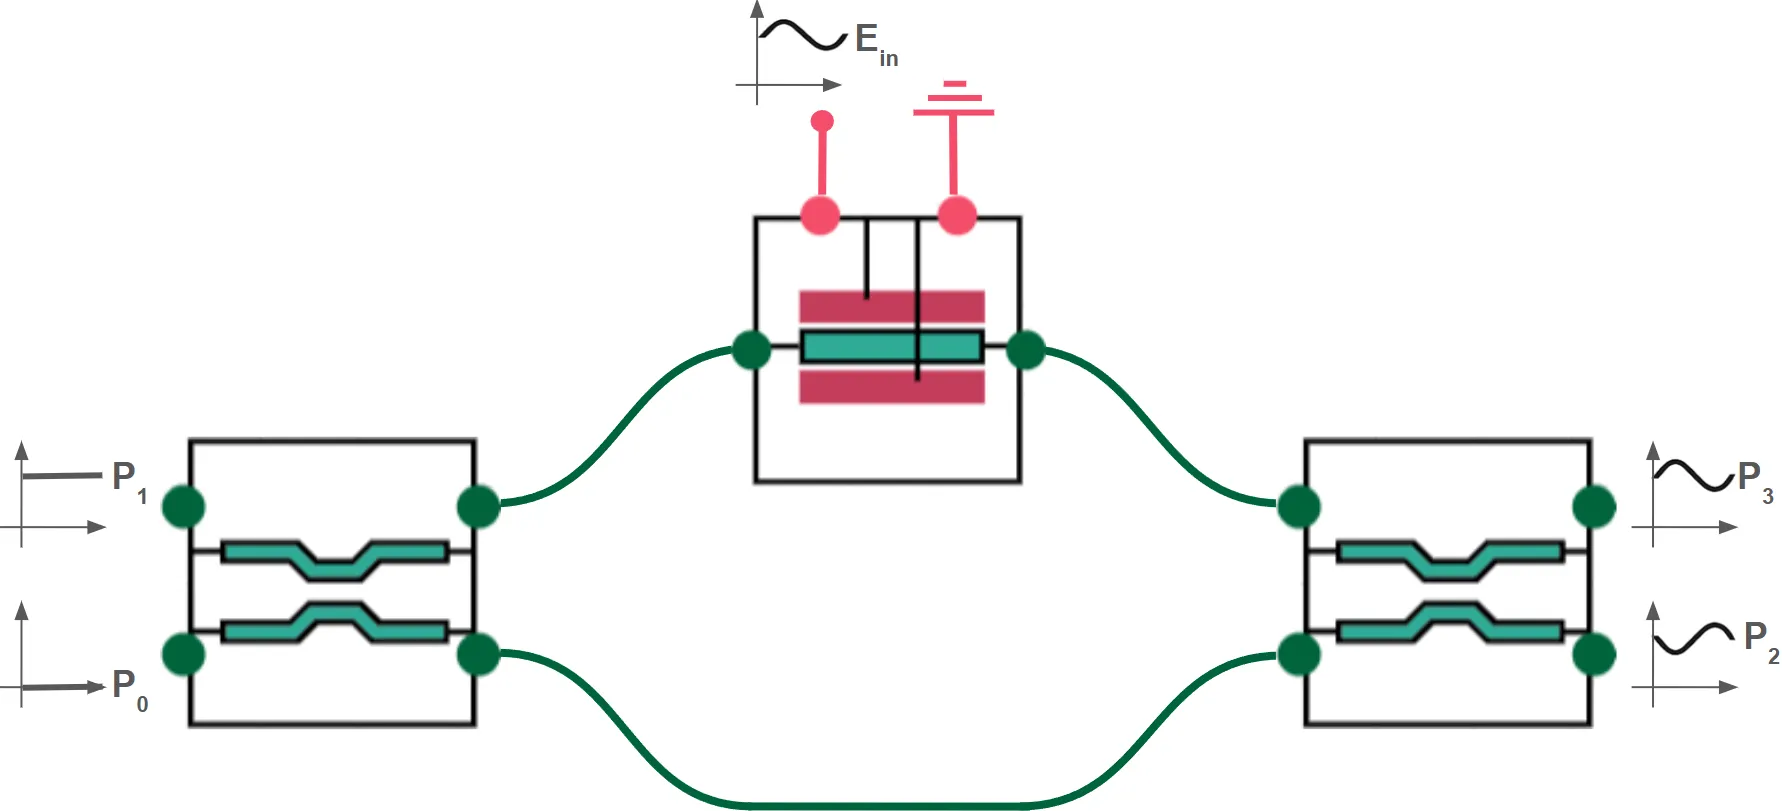
The Mach–Zehnder Modulator (MZM) is a key component in modern optical communication systems, enabling high‑speed modulation of a continuous‑wave (CW) laser signal using an applied electrical drive. It operates by splitting the incoming light into two arms, introducing a controllable phase shift in one arm—typically via a waveguide modulator—and then recombining the signals in an output coupler. The resulting interference pattern modulates the output intensity in response to the drive signal.
In this notebook, we use the TimeStepper object to simulate the time‑domain response of an MZM. In a PhotonForge time‑domain simulation, components that are inherently described in the frequency domain (e.g., S‑matrix models for couplers) are automatically converted to equivalent time‑domain representations using a poles‑and‑residues fitting approach. These fitted models are then used alongside any custom time‑domain models—such as our electro‑optic phase shifter—to accurately propagate both optical and electrical signals through the circuit over time.
This example demonstrates how to:
- Implement a custom time‑domain model in PhotonForge.
- Integrate it into a larger photonic circuit containing both frequency‑domain and time‑domain models.
- Run a full waveform‑level simulation of an MZM, capturing its dynamic modulation behavior.
Note: The time domain model in this example is very simple (a toy model), for a more practical model see this example.
import numpy as npimport photonforge as pfimport photonforge.abstract as pfafrom matplotlib import pyplot as pltConfiguration and Virtual Port Specifications
Section titled “Configuration and Virtual Port Specifications”We set up PhotonForge to use a basic technology stack and define virtual ports for both optical and electrical signals. Virtual ports are abstract connection points used to wire components together without requiring physical layout geometry. They carry signal type information (e.g., optical or electrical) and mode indices for simulation, enabling us to build and simulate circuits at the schematic level.
Here, because our building blocks are schematic components (no layout shapes or physical port locations), we use virtual electrical and optical ports to connect them. When we later assemble the MZM, these virtual ports let us route signals and form the circuit graph that PhotonForge simulates in the time domain.
# Set the default technology to the basic PhotonForge technologypf.config.default_technology = pf.basic_technology()
# Define an optical virtual port specification for future optical connectionsopt_vir = pf.virtual_port_spec(classification="optical")
# Define an electrical virtual port specification for future electrical connectionselec_vir = pf.virtual_port_spec(classification="electrical")
Directional Coupler
Section titled “Directional Coupler”Next, we construct a basic rectangular directional coupler and attach the built-in DirectionalCouplerModel to it. This model is fundamentally an S‑matrix model intended for frequency‑domain simulations. When running a time‑domain simulation, PhotonForge automatically converts this frequency‑domain model into an equivalent time‑domain representation using a poles‑and‑residues fitting approach. This fitted model is then used internally to propagate signals in the time domain, ensuring consistency between frequency‑ and time‑domain results without requiring the user to manually perform the conversion.
directional_coupler = pfa.directional_coupler()directional_coupler
Bidirectional Optical Phase Shifter – Time-Domain Model
Section titled “Bidirectional Optical Phase Shifter – Time-Domain Model”In a real Mach–Zehnder Modulator arm, the waveguide section containing the electrodes supports light propagation in both directions. This means that when we model an electro‑optic (EO) phase shifter for circuit‑level simulation, we must account for the fact that any light entering from either side will experience a voltage‑controlled phase shift (assuming a lumped phase shifter).
We achieve this by defining a custom time‑domain model:
- Physical Phase Modulation Function
The helper functioneo_modelimplements the phase modulation physics: where is the applied voltage and is the half‑wave voltage of the phase shifter.
This form directly follows from the Pockels effect in EO materials.
def eo_model(A, V, Vpi=2): """Apply EO phase modulation to complex amplitude A given voltage V and half-wave voltage Vpi.""" return A * np.exp(1j * np.pi * V / Vpi)-
EOTimeStepper
Our customEOTimeStepperapplies the same modulation function to the optical amplitude traveling in each direction (both forward and backward ports). This ensures the model behaves correctly regardless of which side the light enters from—critical for accurate bidirectional circuit simulations.During setup, we store the
keysrequired by the TimeStepper to index into input and output arrays. They are derived from the component ports and can be created as an attribute or a property.The step_single method also receives an
update_stateflag. This indicates whether the time-stepper should update any internal state variables at the current step. In models with memory (for example, those including delay lines, filters, or carrier dynamics),update_stateis essential to ensure the simulation advances correctly. In our case, the EO phase shifter is stateless—its output depends only on the instantaneous input voltage—so we can safely ignore this parameter.
# Define a time-stepper that applies bidirectional EO phase modulationclass EOTimeStepper(pf.TimeStepper):    """    TimeStepper that applies a voltage-controlled phase shift to both directions    of propagation in a waveguide segment.    """
    def setup_state(self, *, component, time_step, carrier_frequency, **kwargs):        """Initialize internal state for the time stepper."""        optical_ports = component.select_ports("optical")        if len(optical_ports) != 2:            raise RuntimeError("EOTimeStepper expects components with 2 optical ports")
        op0, op1 = sorted(optical_ports)
        electrical_ports = component.select_ports("electrical")        if len(electrical_ports) != 1:            raise RuntimeError("EOTimeStepper expects components with 1 electrical port")
        el0 = next(iter(electrical_ports))
        # I/O signal names are like S matrix keys: they include port names and mode index        self.keys = (f"{el0}@0", f"{op0}@0", f"{op1}@0")
    def step_single(        self, inputs, outputs, time_index: int, update_state: bool, shutdown: bool    ):        """        Perform a single step of bidirectional phase modulation.
        Parameters        ----------        inputs : np.ndarray            Array of complex inputs in the order given by ``port_names``.        outputs: np.ndarray            Pre-allocated array to write complex outputs in the order given by ``port_names``.        time_index : int            Time series index for the current input.        update_state : bool            If True, commit internal state updates for this time step.            This stepper has no internal state, so we safely ignore it.        shutdown : bool            Whether this is the last call to the single stepping function.
        Returns        -------        dict            Updated amplitudes for both optical ports.        """        # Electrical input voltage        Vin = inputs[0]
        # Forward and backward propagating optical amplitudes        A0 = inputs[1]        A1 = inputs[2]
        # Apply modulation to each propagation direction        A1_new = eo_model(A0, Vin)        A0_new = eo_model(A1, Vin)
        # Return updated amplitudes for both ports. No output on the electrical port.        outputs[1] = A0_new        outputs[2] = A1_new
pf.register_time_stepper_class(EOTimeStepper)
Phase Shifter Component
Section titled “Phase Shifter Component”We now create a component instance representing the electro-optic phase shifter that will form one arm of our Mach–Zehnder Modulator.
PhotonForge requires each time-stepper to be attached to a model, so we embed our custom EOTimeStepper inside an AnalyticWaveguideModel. In this example, the waveguide model acts purely as a hosting wrapper:
its optical parameters (n_eff and length) are not used by the phase-shifter logic and have no physical meaning in this context. All of the optical behavior—namely the voltage-controlled phase modulation—is governed entirely by the EOTimeStepper.
# Create an analytic waveguide model solely as a container for the time-steppermodel = pf.AnalyticWaveguideModel(n_eff=2, length=1)  # parameters arbitrary;
# Attach our custom EO time-stepper, which defines the actual phase-shifting behaviormodel.time_stepper = EOTimeStepper()
# Convert the model to a black-box schematic component with an optical virtual porteops = model.black_box_component(opt_vir)
# Add a virtual electrical port to drive the phase modulationeops.add_port(pf.Port((0.5, 0.5), -90, spec=elec_vir))eops
Mach–Zehnder Modulator Assembly
Section titled “Mach–Zehnder Modulator Assembly”We now integrate the previously defined components to construct the full MZM. External ports are collected from the two couplers and the modulator’s electrical control port, making it possible to inject optical signals and apply modulation voltage. A CircuitModel is added so that PhotonForge can simulate the device as a network of interconnected subcomponents in the time domain. This completes the layout and connectivity for our MZM, ready for time-domain simulation with optical and electrical inputs.
# Create the Mach–Zehnder Modulator componentmzm = pf.Component("MZM")
# Add the first directional couplerdc_ref1 = mzm.add_reference(directional_coupler)
# Add the second directional coupler and position it to the rightdc_ref2 = mzm.add_reference(directional_coupler).translate((11, 0))
# Add the EO waveguide modulator in the upper arm between the couplerseo_ref = mzm.add_reference(eops).translate((9, 1))
# Add all relevant external ports: 2 from first DC, 2 from second DC, 1 from EO modulatormzm.add_port(    [dc_ref1["P0"], dc_ref1["P1"], dc_ref2["P2"], dc_ref2["P3"], eo_ref["E0"]], "Port ")
# Connect upper arm: first DC output (P3) → EO modulator input (P0)mzm.add_virtual_connection(dc_ref1, "P3", eo_ref, "P0")
# Connect upper arm: EO modulator output (P1) → second DC input (P1)mzm.add_virtual_connection(eo_ref, "P1", dc_ref2, "P1")
# Connect lower arm directly: first DC output (P2) → second DC input (P0)mzm.add_virtual_connection(dc_ref1, "P2", dc_ref2, "P0")
# Add a circuit model to simulate the MZM as an interconnected networkmzm.add_model(pf.CircuitModel(), "Circuit")
# Display the assembled MZMmzm;fill:%23221f20;font-weight:bold;font-size:0.472480px;}.terminal{fill:none;stroke:%23805080;stroke-width:0.059060;}.dashed{stroke-dasharray:0.295300,0.177180;}.port{fill:none;stroke:%23805080;stroke-width:0.118120;}.virtual-connection{fill:none;stroke:%23907090;stroke-width:0.088590;}.layer_5_0{stroke:%23998573;fill:url(%23pat-layer_5_0);fill-opacity:0.492;}.label_5_0{fill:%23998573;}.layer_3_0{stroke:%238851ad;fill:url(%23pat-layer_3_0);fill-opacity:0.492;}.label_3_0{fill:%238851ad;}.layer_4_0{stroke:%23535e59;fill:url(%23pat-layer_4_0);fill-opacity:0.492;}.label_4_0{fill:%23535e59;}.layer_1_0{stroke:%23858d89;fill:url(%23pat-layer_1_0);fill-opacity:0.492;}.label_1_0{fill:%23858d89;}.layer_2_0{stroke:%235b98b9;fill:url(%23pat-layer_2_0);fill-opacity:0.492;}.label_2_0{fill:%235b98b9;}</style><defs><path id=%22port-symbol%22 class=%22port%22 d=%22M 0,-0.236240 L 0.354360,0 0,0.236240%22 /><path id=%22ref-port-symbol%22 class=%22port%22 style=%22stroke-opacity:0.33;%22 d=%22M 0,-0.177180 C 0.236240,-0.177180 0.236240,0.177180 0,0.177180%22 /><circle id=%22port-bend-symbol%22 style=%22stroke-width:0;stroke:none;fill:%23805080;fill-opacity:1;%22 cx=%220%22 cy=%220%22 r=%220.106308%22 /><circle id=%22connection-symbol%22 style=%22stroke-width:0;stroke:none;fill:%23907090;fill-opacity:1;%22 cx=%220%22 cy=%220%22 r=%220.124026%22 /><pattern id=%22pat-layer_5_0%22 patternUnits=%22userSpaceOnUse%22 width=%220.295300%22 height=%220.295300%22 patternTransform=%22translate(0.017371,0.264216)%22><line x1=%220.295300%22 y1=%220%22 x2=%220%22 y2=%220.295300%22 style=%22stroke:%23998573;stroke-width:0.029530%22 /><line x1=%220.442950%22 y1=%220.147650%22 x2=%220.147650%22 y2=%220.442950%22 style=%22stroke:%23998573;stroke-width:0.029530%22 /><line x1=%220.147650%22 y1=%22-0.147650%22 x2=%22-0.147650%22 y2=%220.147650%22 style=%22stroke:%23998573;stroke-width:0.029530%22 /></pattern><pattern id=%22pat-layer_3_0%22 patternUnits=%22userSpaceOnUse%22 width=%220.177180%22 height=%220.177180%22 patternTransform=%22translate(0.041689,0.130554)%22><circle cx=%220.088590%22 cy=%220.088590%22 r=%220.029530%22 style=%22stroke:none;fill:%238851ad;fill-opacity:1.0%22 /></pattern><pattern id=%22pat-layer_4_0%22 patternUnits=%22userSpaceOnUse%22 width=%220.295300%22 height=%220.295300%22 patternTransform=%22translate(0.191076,0.093253)%22><line x1=%220.147650%22 y1=%220%22 x2=%220.147650%22 y2=%220.295300%22 style=%22stroke:%23535e59;stroke-width:0.029530%22 /><line x1=%220%22 y1=%220.147650%22 x2=%220.295300%22 y2=%220.147650%22 style=%22stroke:%23535e59;stroke-width:0.029530%22 /></pattern><pattern id=%22pat-layer_1_0%22 patternUnits=%22userSpaceOnUse%22 width=%220.295300%22 height=%220.295300%22 patternTransform=%22translate(0.121594,0.170963)%22><circle cx=%220.147650%22 cy=%220.147650%22 r=%220.029530%22 style=%22stroke:none;fill:%23858d89;fill-opacity:1.0%22 /></pattern><pattern id=%22pat-layer_2_0%22 patternUnits=%22userSpaceOnUse%22 width=%220.295300%22 height=%220.295300%22 patternTransform=%22translate(0.243188,0.046626)%22><line x1=%220%22 y1=%220%22 x2=%220.295300%22 y2=%220.295300%22 style=%22stroke:%235b98b9;stroke-width:0.029530%22 /><line x1=%22-0.147650%22 y1=%220.147650%22 x2=%220.147650%22 y2=%220.442950%22 style=%22stroke:%235b98b9;stroke-width:0.029530%22 /><line x1=%220.147650%22 y1=%22-0.147650%22 x2=%220.442950%22 y2=%220.147650%22 style=%22stroke:%235b98b9;stroke-width:0.029530%22 /></pattern><g id=%22C1%22 data-name=%22Directional Coupler%22><path class=%22layer_0_32767%22 d=%22M 0.000000,9.600000 0.000000,7.715000 0.000000,7.465000 0.000000,4.935000 0.000000,4.685000 0.000000,0.000000 11.120000,0.000000 11.120000,4.685000 11.120000,4.935000 11.120000,7.465000 11.120000,7.715000 11.120000,9.600000 z M 11.000000,7.715000 9.520000,7.715000 9.520000,8.000000 6.820000,8.000000 6.180000,7.350000 4.980000,7.350000 4.320000,8.000000 1.620000,8.000000 1.620000,7.715000 0.120000,7.715000 0.120000,9.480000 11.000000,9.480000 z M 11.000000,4.935000 9.520000,4.935000 9.520000,5.220000 7.180000,5.220000 6.520000,5.880000 4.620000,5.880000 3.980000,5.220000 1.600000,5.220000 1.600000,4.935000 0.120000,4.935000 0.120000,7.465000 1.620000,7.465000 1.620000,7.180000 3.980000,7.180000 4.620000,6.520000 6.520000,6.520000 7.180000,7.180000 9.520000,7.180000 9.520000,7.465000 11.000000,7.465000 z M 11.000000,0.120000 0.120000,0.120000 0.120000,4.685000 1.600000,4.685000 1.600000,4.420000 1.620000,4.400000 4.320000,4.400000 5.000000,5.080000 6.150000,5.080000 6.820000,4.400000 9.520000,4.400000 9.520000,4.685000 11.000000,4.685000 z%22 /><path class=%22layer_0_32767%22 d=%22M 1.612000,2.205000 1.132000,2.205000 1.132000,1.165000 1.612000,1.165000 1.812000,1.365000 1.812000,2.005000 z M 1.652000,1.445000 1.532000,1.325000 1.292000,1.325000 1.292000,2.045000 1.532000,2.045000 1.652000,1.925000 z%22 /><path class=%22layer_0_32767%22 d=%22M 2.036000,1.725000 2.036000,1.165000 2.196000,1.165000 2.196000,1.725000 z%22 /><path class=%22layer_0_32767%22 d=%22M 2.036000,2.045000 2.036000,1.885000 2.196000,1.885000 2.196000,2.045000 z%22 /><path class=%22layer_0_32767%22 d=%22M 3.060000,1.645000 3.060000,1.746000 2.921000,1.885000 2.641000,1.885000 2.580000,1.826000 2.521000,1.885000 2.420000,1.885000 2.420000,1.165000 2.580000,1.165000 2.580000,1.645000 2.660000,1.725000 2.820000,1.725000 2.900000,1.645000 z%22 /><path class=%22layer_0_32767%22 d=%22M 3.284000,1.325000 3.284000,1.165000 3.444000,1.165000 3.444000,1.325000 z%22 /><path class=%22layer_0_32767%22 d=%22M 5.204000,1.426000 5.065000,1.426000 4.964000,1.325000 4.804000,1.325000 4.724000,1.405000 4.724000,1.645000 4.804000,1.725000 4.964000,1.725000 5.065000,1.626000 5.204000,1.626000 5.204000,1.706000 5.025000,1.885000 4.745000,1.885000 4.564000,1.706000 4.564000,1.346000 4.745000,1.165000 5.025000,1.165000 5.204000,1.346000 z%22 /><path class=%22layer_0_32767%22 d=%22M 5.889000,1.885000 5.609000,1.885000 5.428000,1.706000 5.428000,1.346000 5.609000,1.165000 5.889000,1.165000 6.068000,1.346000 6.068000,1.706000 z M 5.908000,1.405000 5.828000,1.325000 5.668000,1.325000 5.588000,1.405000 5.588000,1.645000 5.668000,1.725000 5.828000,1.725000 5.908000,1.645000 z%22 /><path class=%22layer_0_32767%22 d=%22M 6.852000,1.165000 6.852000,1.885000 6.692000,1.885000 6.692000,1.405000 6.612000,1.325000 6.532000,1.325000 6.452000,1.405000 6.452000,1.885000 6.292000,1.885000 6.292000,1.346000 6.473000,1.165000 6.633000,1.165000 6.692000,1.226000 6.753000,1.165000 z%22 /><path class=%22layer_0_32767%22 d=%22M 7.537000,1.885000 7.076000,1.885000 7.076000,0.845000 7.236000,0.845000 7.236000,1.165000 7.537000,1.165000 7.716000,1.346000 7.716000,1.706000 z M 7.556000,1.405000 7.476000,1.325000 7.236000,1.325000 7.236000,1.725000 7.476000,1.725000 7.556000,1.645000 z%22 /><path class=%22layer_0_32767%22 d=%22M 8.260000,1.325000 8.100000,1.325000 8.100000,2.205000 7.940000,2.205000 7.940000,1.285000 8.060000,1.165000 8.260000,1.165000 z%22 /><path class=%22layer_0_32767%22 d=%22M 9.004000,1.885000 8.604000,1.885000 8.484000,1.765000 8.484000,1.285000 8.604000,1.165000 9.084000,1.165000 9.084000,1.325000 8.644000,1.325000 8.644000,1.445000 9.004000,1.445000 9.124000,1.565000 9.124000,1.765000 z M 8.964000,1.605000 8.644000,1.605000 8.644000,1.725000 8.964000,1.725000 z%22 /><path class=%22layer_0_32767%22 d=%22M 9.988000,1.645000 9.988000,1.746000 9.849000,1.885000 9.569000,1.885000 9.508000,1.826000 9.449000,1.885000 9.348000,1.885000 9.348000,1.165000 9.508000,1.165000 9.508000,1.645000 9.588000,1.725000 9.748000,1.725000 9.828000,1.645000 z%22 /></g><g id=%22C2%22 data-name=%22BBAnalyticWaveguide%22><path class=%22layer_0_32767%22 d=%22M 0.000000,7.300000 0.000000,5.175000 0.000000,4.925000 0.000000,0.000000 10.050000,0.000000 10.050000,4.925000 10.050000,5.175000 10.050000,7.300000 z M 9.930000,5.175000 8.450000,5.175000 8.450000,5.700000 1.600000,5.700000 1.600000,5.175000 0.120000,5.175000 0.120000,7.180000 9.930000,7.180000 z M 9.930000,0.120000 0.120000,0.120000 0.120000,4.925000 1.600000,4.925000 1.600000,4.400000 8.450000,4.400000 8.450000,4.925000 9.930000,4.925000 z%22 /><path class=%22layer_0_32767%22 d=%22M 1.409000,1.165000 1.590000,1.165000 1.889000,1.466000 2.190000,1.165000 2.369000,1.165000 2.369000,2.205000 2.209000,2.205000 2.209000,1.485000 2.129000,1.485000 1.889000,1.725000 1.649000,1.485000 1.569000,1.485000 1.569000,2.205000 1.409000,2.205000 z%22 /><path class=%22layer_0_32767%22 d=%22M 3.153000,1.885000 2.673000,1.885000 2.593000,1.805000 2.593000,1.725000 3.073000,1.725000 3.073000,1.605000 2.713000,1.605000 2.593000,1.485000 2.593000,1.285000 2.713000,1.165000 3.233000,1.165000 3.233000,1.805000 z M 3.073000,1.325000 2.753000,1.325000 2.753000,1.445000 3.073000,1.445000 z%22 /><path class=%22layer_0_32767%22 d=%22M 4.017000,1.805000 4.017000,1.885000 3.857000,1.885000 3.777000,1.325000 3.697000,1.325000 3.617000,1.885000 3.457000,1.885000 3.457000,1.805000 3.558000,1.165000 3.918000,1.165000 z%22 /><path class=%22layer_0_32767%22 d=%22M 4.761000,1.885000 4.361000,1.885000 4.241000,1.765000 4.241000,1.285000 4.361000,1.165000 4.841000,1.165000 4.841000,1.325000 4.401000,1.325000 4.401000,1.445000 4.761000,1.445000 4.881000,1.565000 4.881000,1.765000 z M 4.721000,1.605000 4.401000,1.605000 4.401000,1.725000 4.721000,1.725000 z%22 /><path class=%22layer_0_32767%22 d=%22M 5.286000,1.885000 5.105000,1.706000 5.105000,1.346000 5.286000,1.165000 5.585000,1.165000 5.585000,1.005000 5.265000,1.005000 5.265000,0.845000 5.625000,0.845000 5.745000,0.965000 5.745000,1.885000 z M 5.585000,1.325000 5.345000,1.325000 5.265000,1.405000 5.265000,1.645000 5.345000,1.725000 5.585000,1.725000 z%22 /><path class=%22layer_0_32767%22 d=%22M 6.529000,1.165000 6.529000,1.885000 6.369000,1.885000 6.369000,1.405000 6.289000,1.325000 6.209000,1.325000 6.129000,1.405000 6.129000,1.885000 5.969000,1.885000 5.969000,1.346000 6.150000,1.165000 6.310000,1.165000 6.369000,1.226000 6.430000,1.165000 z%22 /><path class=%22layer_0_32767%22 d=%22M 6.753000,1.725000 6.753000,1.165000 6.913000,1.165000 6.913000,1.725000 z%22 /><path class=%22layer_0_32767%22 d=%22M 6.753000,2.045000 6.753000,1.885000 6.913000,1.885000 6.913000,2.045000 z%22 /><path class=%22layer_0_32767%22 d=%22M 7.617000,2.205000 7.617000,1.845000 7.318000,1.845000 7.137000,1.666000 7.137000,1.346000 7.318000,1.165000 7.777000,1.165000 7.777000,2.205000 z M 7.617000,1.325000 7.377000,1.325000 7.297000,1.405000 7.297000,1.605000 7.377000,1.685000 7.617000,1.685000 z%22 /><path class=%22layer_0_32767%22 d=%22M 8.521000,1.885000 8.121000,1.885000 8.001000,1.765000 8.001000,1.285000 8.121000,1.165000 8.601000,1.165000 8.601000,1.325000 8.161000,1.325000 8.161000,1.445000 8.521000,1.445000 8.641000,1.565000 8.641000,1.765000 z M 8.481000,1.605000 8.161000,1.605000 8.161000,1.725000 8.481000,1.725000 z%22 /></g></defs><g transform=%22scale(1 -1)%22><g id=%22C0%22 data-name=%22MZM%22><use transform=%22translate(0.000000 0.000000)%22 href=%22%23C1%22 /><use transform=%22translate(11.000000 0.000000)%22 href=%22%23C1%22 /><use transform=%22translate(9.000000 1.000000)%22 href=%22%23C2%22 /><g transform=%22translate(0.000000 4.810000) rotate(0.000000)%22><path class=%22port%22 d=%22M 0,-0.500000 V 0.500000%22 /><use href=%22%23port-symbol%22 /></g><text class=%22label%22 text-anchor=%22start%22 dominant-baseline=%22text-after-edge%22 x=%220.000000%22 y=%22-4.810000%22>Port 0</text><g transform=%22translate(0.000000 7.590000) rotate(0.000000)%22><path class=%22port%22 d=%22M 0,-0.500000 V 0.500000%22 /><use href=%22%23port-symbol%22 /></g><text class=%22label%22 text-anchor=%22start%22 dominant-baseline=%22text-after-edge%22 x=%220.000000%22 y=%22-7.590000%22>Port 1</text><g transform=%22translate(22.120000 4.810000) rotate(180.000000)%22><path class=%22port%22 d=%22M 0,-0.500000 V 0.500000%22 /><use href=%22%23port-symbol%22 /></g><text class=%22label%22 text-anchor=%22end%22 dominant-baseline=%22text-before-edge%22 x=%2222.120000%22 y=%22-4.810000%22>Port 2</text><g transform=%22translate(22.120000 7.590000) rotate(180.000000)%22><path class=%22port%22 d=%22M 0,-0.500000 V 0.500000%22 /><use href=%22%23port-symbol%22 /></g><text class=%22label%22 text-anchor=%22end%22 dominant-baseline=%22text-before-edge%22 x=%2222.120000%22 y=%22-7.590000%22>Port 3</text><g transform=%22translate(9.500000 1.500000) rotate(-90.000000)%22><path class=%22port%22 d=%22M 0,-0.500000 V 0.500000%22 /><use href=%22%23port-symbol%22 /></g><text class=%22label%22 text-anchor=%22end%22 dominant-baseline=%22text-before-edge%22 x=%229.500000%22 y=%22-1.500000%22>Port 4</text><g transform=%22translate(11.120000 7.590000)%22><use href=%22%23connection-symbol%22 /></g><g transform=%22translate(9.000000 6.050000)%22><use href=%22%23connection-symbol%22 /></g><path class=%22virtual-connection%22 d=%22M 11.120000,7.590000 C 11.556718,7.590000 8.563282,6.050000 9.000000,6.050000%22 /><g transform=%22translate(19.050000 6.050000)%22><use href=%22%23connection-symbol%22 /></g><g transform=%22translate(11.000000 7.590000)%22><use href=%22%23connection-symbol%22 /></g><path class=%22virtual-connection%22 d=%22M 19.050000,6.050000 C 20.415997,6.050000 9.634003,7.590000 11.000000,7.590000%22 /><g transform=%22translate(11.120000 4.810000)%22><use href=%22%23connection-symbol%22 /></g><g transform=%22translate(11.000000 4.810000)%22><use href=%22%23connection-symbol%22 /></g><path class=%22virtual-connection%22 d=%22M 11.120000,4.810000 C 11.140000,4.810000 10.980000,4.810000 11.000000,4.810000%22 /></g></g></svg>)
%22><use href=%22%23g-dc%22 transform=%22translate(-30.00 -30.00) scale(1.2)%22/><circle cx=%22-30.00%22 cy=%22-6.54%22 r=%224%22 fill=%22%2300643c%22 stroke=%22%2300643c%22 stroke-width=%221%22/><circle cx=%22-30.00%22 cy=%2210.05%22 r=%224%22 fill=%22%2300643c%22 stroke=%22%2300643c%22 stroke-width=%221%22/><circle cx=%2230.00%22 cy=%22-6.51%22 r=%224%22 fill=%22%2300643c%22 stroke=%22%2300643c%22 stroke-width=%221%22/><circle cx=%2230.00%22 cy=%2210.17%22 r=%224%22 fill=%22%2300643c%22 stroke=%22%2300643c%22 stroke-width=%221%22/></g><text x=%220.00%22 y=%2291.80%22 font-size=%229%22 fill=%22%23232530%22 font-weight=%22400%22 text-anchor=%22middle%22 dominant-baseline=%22hanging%22 stroke=%22%23ffffff%22 stroke-width=%223.15%22 stroke-linejoin=%22round%22 paint-order=%22stroke%22>Directional_Coupler_1</text><text x=%22-42.00%22 y=%2253.46%22 font-size=%2210%22 fill=%22%23b8461c%22 font-weight=%22700%22 text-anchor=%22end%22 dominant-baseline=%22middle%22 stroke=%22%23ffffff%22 stroke-width=%223.50%22 stroke-linejoin=%22round%22 paint-order=%22stroke%22>Port 1</text><text x=%22-42.00%22 y=%2270.05%22 font-size=%2210%22 fill=%22%23b8461c%22 font-weight=%22700%22 text-anchor=%22end%22 dominant-baseline=%22middle%22 stroke=%22%23ffffff%22 stroke-width=%223.50%22 stroke-linejoin=%22round%22 paint-order=%22stroke%22>Port 0</text><g transform=%22matrix(1 -0 0 1 384.000 -60.000)%22><use href=%22%23g-dc%22 transform=%22translate(-30.00 -30.00) scale(1.2)%22/><circle cx=%22-30.00%22 cy=%22-6.54%22 r=%224%22 fill=%22%2300643c%22 stroke=%22%2300643c%22 stroke-width=%221%22/><circle cx=%22-30.00%22 cy=%2210.05%22 r=%224%22 fill=%22%2300643c%22 stroke=%22%2300643c%22 stroke-width=%221%22/><circle cx=%2230.00%22 cy=%22-6.51%22 r=%224%22 fill=%22%2300643c%22 stroke=%22%2300643c%22 stroke-width=%221%22/><circle cx=%2230.00%22 cy=%2210.17%22 r=%224%22 fill=%22%2300643c%22 stroke=%22%2300643c%22 stroke-width=%221%22/></g><text x=%22384.00%22 y=%22-28.20%22 font-size=%229%22 fill=%22%23232530%22 font-weight=%22400%22 text-anchor=%22middle%22 dominant-baseline=%22hanging%22 stroke=%22%23ffffff%22 stroke-width=%223.15%22 stroke-linejoin=%22round%22 paint-order=%22stroke%22>Directional_Coupler_2</text><text x=%22426.00%22 y=%22-66.51%22 font-size=%2210%22 fill=%22%23b8461c%22 font-weight=%22700%22 text-anchor=%22start%22 dominant-baseline=%22middle%22 stroke=%22%23ffffff%22 stroke-width=%223.50%22 stroke-linejoin=%22round%22 paint-order=%22stroke%22>Port 3</text><text x=%22426.00%22 y=%22-49.83%22 font-size=%2210%22 fill=%22%23b8461c%22 font-weight=%22700%22 text-anchor=%22start%22 dominant-baseline=%22middle%22 stroke=%22%23ffffff%22 stroke-width=%223.50%22 stroke-linejoin=%22round%22 paint-order=%22stroke%22>Port 2</text><g transform=%22matrix(1 -0 0 1 192.000 60.000)%22><rect x=%22-30.00%22 y=%22-30.00%22 width=%2260.00%22 height=%2260.00%22 fill=%22%23f4f5f7%22 stroke=%22%23232530%22 stroke-width=%221%22/><use href=%22%23g-wg%22 transform=%22translate(-30.00 -30.00) scale(1.2)%22/><circle cx=%22-30.00%22 cy=%22-15.00%22 r=%224%22 fill=%22%2300643c%22 stroke=%22%2300643c%22 stroke-width=%221%22/><circle cx=%22-30.00%22 cy=%2215.00%22 r=%224%22 fill=%22%23f44e6a%22 stroke=%22%23f44e6a%22 stroke-width=%221%22/><circle cx=%2230.00%22 cy=%220.00%22 r=%224%22 fill=%22%2300643c%22 stroke=%22%2300643c%22 stroke-width=%221%22/></g><text x=%22192.00%22 y=%2291.80%22 font-size=%229%22 fill=%22%23232530%22 font-weight=%22400%22 text-anchor=%22middle%22 dominant-baseline=%22hanging%22 stroke=%22%23ffffff%22 stroke-width=%223.15%22 stroke-linejoin=%22round%22 paint-order=%22stroke%22>BBAnalyticWaveguide_1</text><text x=%22150.00%22 y=%2275.00%22 font-size=%2210%22 fill=%22%23b8461c%22 font-weight=%22700%22 text-anchor=%22end%22 dominant-baseline=%22middle%22 stroke=%22%23ffffff%22 stroke-width=%223.50%22 stroke-linejoin=%22round%22 paint-order=%22stroke%22>Port 4</text><g fill=%22none%22 stroke-width=%222%22></g></svg>)
Time-Stepper Initialization
Section titled “Time-Stepper Initialization”We configure the time-stepper with parameters that control temporal resolution and the spectral window used internally for fitting and dispersion:
Key parameters:
-
Time step
We choose so that the sampling rate comfortably exceeds the highest modulation frequency content. For a single tone at , a good rule is (we use , i.e., samples per period) to reduce numerical error and capture waveform shape.
-
Carrier frequency
Defines the optical center frequency used in the envelope formulation. Rather than directly time-stepping the full optical field oscillating at (corresponding to ), PhotonForge works in a rotating reference frame at the carrier.
This means we simulate only the slowly varying complex envelopes of the optical signals, which contain the modulation sidebands and device response. All frequency-domain S-matrix data and time-domain signals are therefore referenced relative to this carrier frequency. -
Frequency grid
PhotonForge uses the provided frequency grid to construct/fit frequency-domain responses (e.g., S-matrix elements) into time-domain form via poles-and-residues. The grid should span the carrier and relevant sidebands produced by the drive and include any device bandwidth/features of interest.
- For a single-tone, small-signal case, include at least .
- For large-signal or non-sinusoidal drives, extend to (with covering the significant harmonics).
- Use enough points (e.g., 50–200) to ensure a stable fit over the band.
With these choices, we ensure that the time-stepper both resolves the time-domain dynamics and has a frequency window broad and dense enough to capture the spectral content induced by modulation and device dispersion.
# Define the optical carrier frequency (around 1550 nm wavelength)f_c = 193.4e12  # Hz
# Define the electrical modulation frequencyf_m = 1e9  # Hz
# Choose a time step small enough to resolve the modulation periodtime_step = 0.001 / f_m
ts = mzm.setup_time_stepper(    time_step=time_step,    carrier_frequency=f_c,    time_stepper_kwargs={        "frequencies": np.linspace(f_c - 200 * f_m, f_c + 200 * f_m, 100),    },)
Input Signal Definition
Section titled “Input Signal Definition”The MZM transfer function is sinusoidal with respect to the applied phase shift. To maximize modulation efficiency for small drive signals, we bias the device at the quadrature point—where the output powers at Port 2 and Port 3 are equal.
-
Bias Point Selection
We apply a DC bias of . With , the induced phase shift is , placing the modulator at the midpoint of its transfer curve. -
Small-Signal Modulation
On top of the DC bias, we add a small cosine drive , which perturbs the phase slightly around so the output power swings symmetrically about the bias point. -
Optical Inputs and Carrier Handling
We provide baseband complex envelopes for the optical inputs: a CW envelope of unity on Port 1 and zero on Port 0. The optical carrier at is included automatically by the time-stepper configured earlier; there is no need to inject explicitly in the inputs. -
TimeSeries Packaging
We bundle the electrical and optical envelopes into apf.TimeSeriesobject and map them to the corresponding ports for time-domain propagation.
With this setup, we can observe how the MZM output powers at Port 2 and Port 3 evolve over time when biased at quadrature and driven with a small sinusoidal signal.
# Define the final simulation time (1 ns)t_f = 1e-9  # seconds
# Generate the time vector for the simulationt = time_step * np.arange(t_f // time_step)
# Electrical drive signal: small cosine modulation around DC biasE0_in = 1 + 0.1 * np.cos(2 * np.pi * f_m * t)
# Optical input signalsA0_in = np.zeros(len(t))  # No signal at second optical inputA1_in = np.ones(len(t))  # CW optical input at first optical port
# Bundle the input waveforms into a TimeSeries object for the simulationinputs = pf.TimeSeries(    values={        "Port 4@0": E0_in,  # Electrical modulation port        "Port 0@0": A0_in,  # Lower optical input        "Port 1@0": A1_in,  # Upper optical input    },    time_step=time_step,)
Running the Time-Domain Simulation
Section titled “Running the Time-Domain Simulation”-
Resetting the Time-Stepper
We callts.resetto ensure the simulation starts with a clean internal state, preventing residual values from previous runs. -
Executing the Simulation
Thestepmethod of the time-stepper is used to propagate the defined optical and electrical inputs through the MZM over the simulation time, producing the output waveforms.
The resulting outputs object contains the simulated time-domain signals at all output ports of the MZM.
# Reset the time-stepper to ensure a clean simulation startts.reset()
# Run the simulation for the given input waveformsoutputs = ts.step(inputs)
We validate the MZM time-domain simulation in PhotonForge by directly comparing the output optical powers with results from another commercial software.
The reference dataset can be downloaded here.
As shown in the plot, the PhotonForge simulation agrees closely with the reference across the modulation cycle. One key difference is at the very beginning (): the reference data exhibits a sharp artifact, while the PhotonForge result remains smooth.
# Plot PhotonForge simulation results for both output portsplt.plot(t, np.abs(outputs["Port 2@0"]) ** 2, label="Port 2")plt.plot(t, np.abs(outputs["Port 3@0"]) ** 2, label="Port 3")
# Load reference results from another commercial simulation tooltime3, y3 = np.loadtxt("misc/port2_case1.txt", delimiter=",", skiprows=3, unpack=True)time4, y4 = np.loadtxt("misc/port3_case1.txt", delimiter=",", skiprows=3, unpack=True)
# Plot reference results with dashed linesplt.plot(time3, y3, label="Port 2 (Reference)", linewidth=2, linestyle="--")plt.plot(time4, y4, label="Port 3 (Reference)", linewidth=2, linestyle="--")
# Formatting and displayplt.xlabel("Time (s)")plt.ylabel("Output Power")plt.legend()plt.grid(True)plt.tight_layout()plt.show()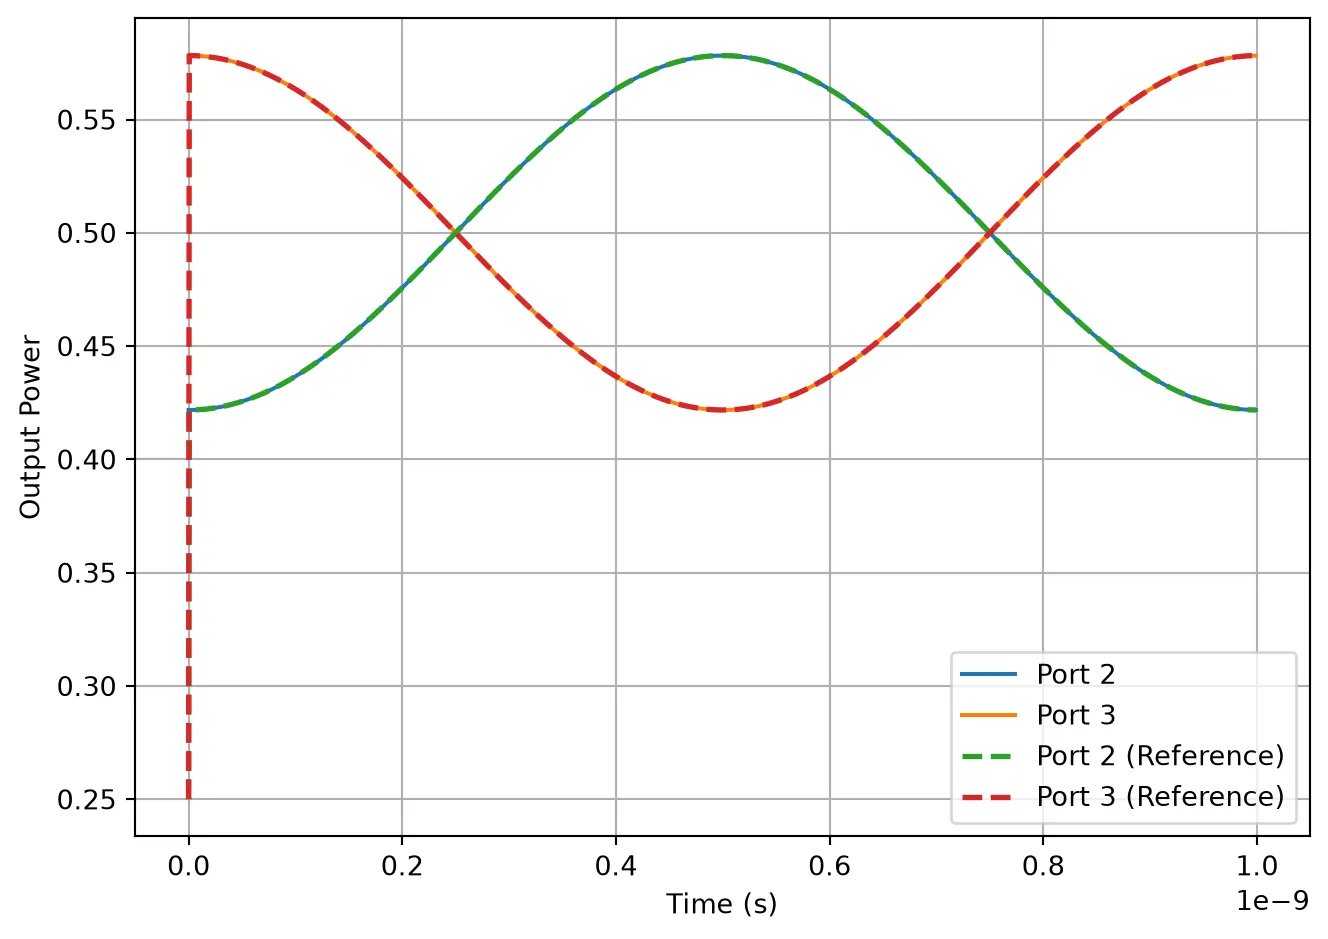
Large-Signal Modulation and Saturation Behavior
Section titled “Large-Signal Modulation and Saturation Behavior”In the previous example, we applied a small sinusoidal modulation around the quadrature bias point, which kept the MZM operating in its linear region.
Here, we intentionally increase the modulation depth to demonstrate saturation effects.
- Drive Signal
We use: The DC bias term () still sets the operating point at quadrature (), but the added cosine term now has an amplitude large enough to sweep the phase shift well beyond in both directions.
E0_in = 1 + np.cos(2 * np.pi * f_m * t)inputs = pf.TimeSeries( values={ "Port 4@0": E0_in, # Electrical modulation port "Port 0@0": A0_in, # Lower optical input "Port 1@0": A1_in, # Upper optical input }, time_step=time_step,)# Reset the time-stepper to ensure a clean simulation startts.reset()# Run the simulation for the given input waveformsoutputs = ts.step(inputs)Resulting Behavior
The MZM transfer function is sinusoidal in phase shift, so a large drive signal causes:
- Flattening of the output waveform near its maximum and minimum power levels.
- Nonlinear distortion due to the fact that the transfer curve is no longer locally linear.
The simulation (solid lines) and reference results (dashed lines) match closely, confirming that our time-domain EO modulator model reproduces the correct large-signal saturation behavior.
# Plot PhotonForge simulation results for both output portsplt.plot(t, np.abs(outputs["Port 2@0"]) ** 2, label="Port 2")plt.plot(t, np.abs(outputs["Port 3@0"]) ** 2, label="Port 3")plt.ylabel("Power (a.u.)")plt.xlabel("Time (s)")
# Load reference results from another commercial simulation tooltime3, y3 = np.loadtxt("misc/port2_case2.txt", delimiter=",", skiprows=3, unpack=True)time4, y4 = np.loadtxt("misc/port3_case2.txt", delimiter=",", skiprows=3, unpack=True)
# Plot reference results with dashed linesplt.plot(time3, y3, label="Port 2 (Reference)", linewidth=2, linestyle="--")plt.plot(time4, y4, label="Port 3 (Reference)", linewidth=2, linestyle="--")
# Formatting and displayplt.xlabel("Time (s)")plt.ylabel("Output Power")plt.legend()plt.grid(True)plt.tight_layout()plt.show()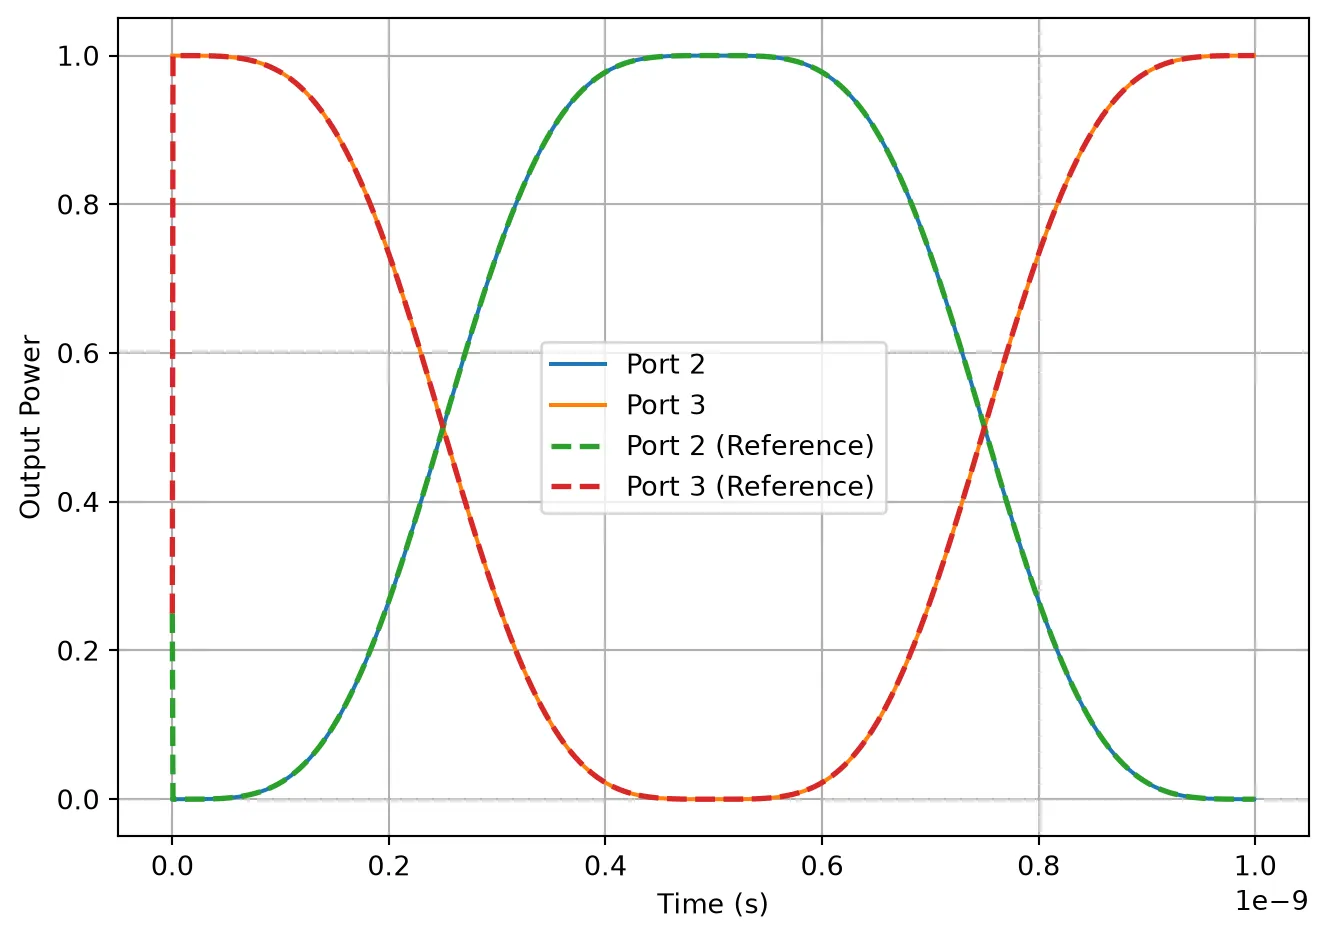
Port Monitors: Probing the EO Phase Shifter
Section titled “Port Monitors: Probing the EO Phase Shifter”We add port monitors to record the complex output signals at specific circuit locations. Monitors are configured by passing a monitors dictionary to the time_stepper_kwargs. Monitors are specified as a dictionary mapping monitor names to port objects. We first access the component reference from the MZM, then use its ports.
The monitored signals are stored with directional indicators: outputs_mon["eo_in@0+"] (outgoing wave) and outputs_mon["eo_out@0-"] (incoming wave), where the + and - suffixes indicate the wave direction.
Finally, we plot both the amplitude and the unwrapped phase side by side. This visualization makes it clear how the applied voltage modulates the optical signal as it propagates through the EO phase shifter.
# Get the reference from the MZM to access its ports for monitoringeo_ref = mzm.references[2]  # Electro-optic phase shifter
ts_mon = mzm.setup_time_stepper(    time_step=time_step,    carrier_frequency=f_c,    time_stepper_kwargs={        "frequencies": np.linspace(f_c - 200 * f_m, f_c + 200 * f_m, 100),        "monitors": {            "eo_in": eo_ref["P0"],            "eo_out": eo_ref["P1"],        },    },)
# Run the simulation to collect monitor signalsoutputs_mon = ts_mon.step(inputs)
# Extract time axis and complex envelopes from monitorseo_in = outputs_mon["eo_in@0-"]  # '-' sign indicates incoming waveeo_out = outputs_mon["eo_out@0+"]  # '+' sign indicates outgoing wave
# ... rest of the plotting code# Create a single figure with two stacked subplots sharing the time axisfig, (ax_amp, ax_phase) = plt.subplots(1, 2, figsize=(10, 4))
# Plot amplitude at EO input and outputax_amp.plot(t, np.abs(eo_in), label="EO input |A|")ax_amp.plot(t, np.abs(eo_out), label="EO output |A|")ax_amp.set_xlabel("Time (s)")ax_amp.set_ylabel("Amplitude (a.u.)")ax_amp.legend()ax_amp.grid()
# Compute unwrapped phases from complex envelopesphi_in = np.unwrap(np.angle(eo_in))phi_out = np.unwrap(np.angle(eo_out))
# Plot phase at EO input and outputax_phase.plot(t, phi_in, label="EO input phase")ax_phase.plot(t, phi_out, label="EO output phase")ax_phase.set_xlabel("Time (s)")ax_phase.set_ylabel("Phase (rad)")ax_phase.legend()ax_phase.grid()
# Finalize layout and renderfig.tight_layout()plt.show()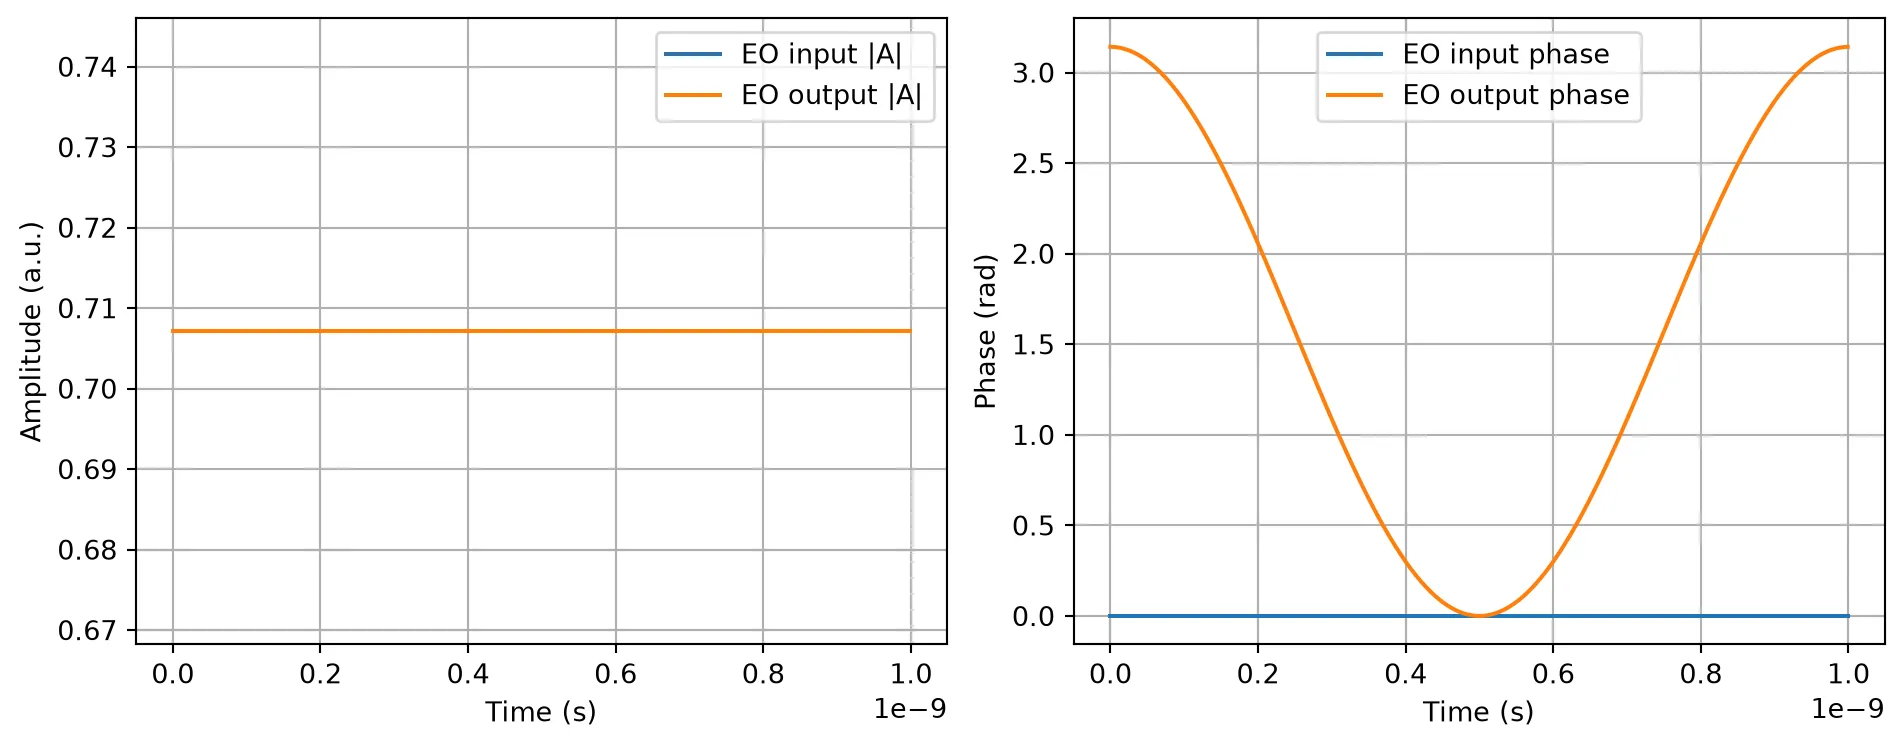
In this notebook, we implemented a relatively simple EO phase shifter model that applies an ideal, voltage-controlled phase shift to the optical field. While this is sufficient to capture the essential behavior of a Mach–Zehnder Modulator and validate its time-domain operation, real-world modulators often involve additional physical effects, including:
- Bandwidth limitations due to electrode design and parasitics
- Frequency-dependent Vπ and loss
- Thermal and carrier-induced nonlinearities
- Traveling-wave effects and reflections
PhotonForge is designed to support increasing model complexity, whether through extensions of the TimeStepper class or by using custom hybrid models. We also encourage you to experiment with your own time-domain models. The modular structure of PhotonForge allows you to create and register your own component behaviors using the same TimeStepper infrastructure demonstrated here.
This example serves as a foundation—ready to be extended toward more physically detailed models and system-level simulations.