

Nonlinear Waveguide
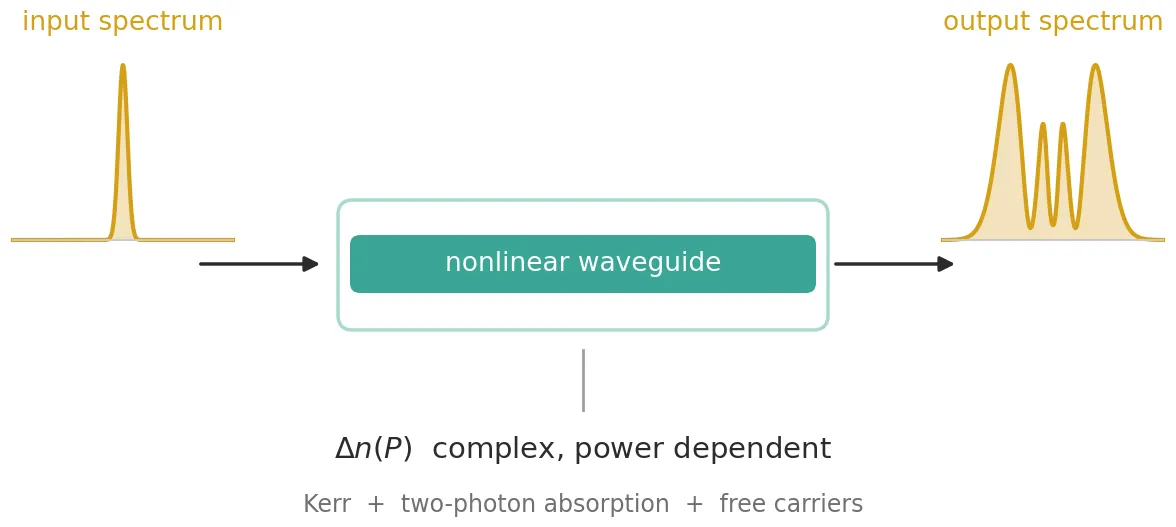
AnalyticWaveguideTimeStepper is the time-domain model of a waveguide. Besides the linear properties it shares with AnalyticWaveguideModel, namely the effective index, group index, propagation loss and chromatic dispersion, it accepts an effective index that depends on the optical power in the guide. That makes it a model of a nonlinear waveguide.
The class method AnalyticWaveguideModel.nonlinear builds such a model from physical
parameters: the Kerr coefficient, the two-photon absorption coefficient, the free-carrier
coefficients and the waveguide cross-section. The model it returns works both on an abstract
black box and on a real layout, such as a routed spiral, whose length it reads from the
geometry. This guide uses it for a silicon wire, where the power-dependent index comes from the
Kerr effect, two-photon absorption and the free carriers that two-photon absorption creates.
What the time stepper computes
Section titled “What the time stepper computes”The stepper propagates the complex envelope of the optical field, normalised so that is the optical power in watts. The oscillation at the carrier frequency is removed from the signal and handled by the stepper. Over a length , a change of the effective index multiplies the envelope by
on top of the linear delay and loss, where is the vacuum wavelength. Writing separates two effects:
- the real part adds a phase ;
- the imaginary part attenuates the power as , with an added absorption coefficient .
A single complex therefore describes both a phase change and a loss. The stepper sums three contributions, each set by one of its parameters:
-
dn_kerrsets an index change that follows the power instantly, . -
dn_fcsets the free-carrier contribution. A quantity relaxes towards its steady-state value with the time constanttau_fc,and is either the index change itself or, when
dn_fc_mapis given, the carrier density, which the map then converts to an index change. -
dn_thsets a second relaxing index change with the time constanttau_th, intended for heating. It is not used in this guide.
Each of these is a complex Interpolator against power. A relaxing channel settles at its steady state after a few time constants under constant power, and responds to the power averaged over roughly one time constant when the power changes faster than that.
The stepper also splits the waveguide into sections. Each section applies its nonlinear
phase at the power entering it, so the phase, the loss and the dispersion alternate along the
length in small steps, which is the split-step method. With peak_power given, the number of
sections is chosen so that the Kerr phase per section stays below max_phase, 0.05 rad by
default.
Nonlinear optics of a silicon wire
Section titled “Nonlinear optics of a silicon wire”At 1550 nm four effects change the index of a silicon waveguide. All of them depend on the intensity , where is the nonlinear effective area of the mode.
Kerr effect. The electronic response of silicon raises the refractive index in proportion to the intensity, , where is the Kerr coefficient. The response takes femtoseconds, so it is instantaneous for picosecond pulses. A pulse whose power varies in time therefore acquires a phase that varies in time. This is self-phase modulation (SPM): the pulse becomes chirped and its spectrum broadens.
Two-photon absorption (TPA). A 1550 nm photon carries 0.8 eV, less than the 1.12 eV bandgap
of silicon. One photon cannot be absorbed, but two photons together can. The absorption grows
with intensity, , which is an absorption
coefficient . With this is an
imaginary index . TPA is as fast as the Kerr
effect, so both go on dn_kerr.
Free carriers. Each two-photon absorption creates one electron-hole pair. The absorbed power per unit volume is , and each pair uses two photons of energy , where is the Planck constant and the optical frequency. The carrier density therefore obeys the rate equation
where is the carrier lifetime, about 1 ns in a silicon wire. Multiplying by gives
which is exactly the relaxation equation of dn_fc, with tau_fc equal to the carrier lifetime
and the steady-state density under constant intensity. The carriers change the
index in two ways:
- free-carrier absorption (FCA): the carriers absorb light with , where is the absorption cross section of electrons and holes together;
- free-carrier dispersion (FCD): the carriers lower the refractive index. The measured dependence of Soref and Bennett is , with for electrons and for holes, and .
When the index change is proportional to , relaxing the index change is the same as relaxing
. The hole term of Soref and Bennett is not proportional, so the carrier density itself must
relax and be converted afterwards: that is what dn_fc_map does, and the class method uses it
whenever an exponent differs from one.
Effective area. In a high-index-contrast wire the mode is not a plane wave, and the effective area is defined from the Kerr response integrated over the cross-section, normalised by the power the mode carries:
where is the impedance of free space and is non-zero only in the nonlinear material. The class method evaluates this integral from a mode solve when it is given the cross-section.
The four effects map onto the two channels as follows:
| effect | index change | channel |
|---|---|---|
| Kerr effect | dn_kerr | |
| two-photon absorption | dn_kerr | |
| free-carrier dispersion | dn_fc, with tau_fc | |
| free-carrier absorption | dn_fc, with tau_fc |
The first part of the guide uses the 2 cm silicon wire of Yin and Agrawal, with its parameters given explicitly, because their closed-form solution for SPM with TPA can be plotted for comparison. It shows what each effect does to a picosecond pulse and ends with chromatic dispersion acting on a femtosecond pulse. The last part builds a routed silicon spiral and lets the class method take every cross-section parameter from its port specification.
References
- Yin, Lianghong and Agrawal, Govind P. “Impact of two-photon absorption on self-phase modulation in silicon waveguides.” Optics Letters 2007 32 (14), 2031-2033, doi: 10.1364/OL.32.002031.
- Soref, Richard A. and Bennett, Brian R. “Electrooptical effects in silicon.” IEEE Journal of Quantum Electronics 1987 23 (1), 123-129, doi: 10.1109/JQE.1987.1073206.
- Afshar V., Shahraam and Monro, Tanya M. “A full vectorial model for pulse propagation in emerging waveguides with subwavelength structures part I: Kerr nonlinearity.” Optics Express 2009 17 (4), 2298-2318, doi: 10.1364/OE.17.002298.
- Agrawal, Govind P. Nonlinear Fiber Optics, 5th ed. Academic Press, 2013.
The parameters are those of the silicon wire of Yin and Agrawal: a 2 cm waveguide with 1 dB/cm linear loss, a nonlinear effective area of 0.1 µm², and the nonlinear coefficients of silicon at 1550 nm. The class method takes the material coefficients in SI units, as RingTimeStepper does, and lengths in µm, as the rest of PhotonForge.
Two names come from photonforge.utils: C_0, the speed of light in vacuum in µm/s, and
virtual_port_spec, which creates ports without a physical cross-section for the abstract
waveguide. The live viewer is opened here for the spiral at the end.
A few combinations of the parameters appear throughout. The loss in dB/µm is converted to a power attenuation coefficient in 1/m. Because the power decays along the waveguide, the nonlinear effects act over the effective length
which is shorter than . The nonlinear coefficient is the Kerr phase per watt of power and per metre of waveguide.
import matplotlib.pyplot as pltimport numpy as npimport photonforge as pfimport tidy3d as tdfrom photonforge.live_viewer import LiveViewerfrom photonforge.utils import C_0, virtual_port_spec
# Open the live viewer for the layout at the end of the guideviewer = LiveViewer()
# Use the basic technology for the abstract waveguidepf.config.default_technology = pf.basic_technology()
# Set the figure resolution and a light grid for all plotsplt.rcParams.update({"figure.dpi": 110, "axes.grid": True, "grid.alpha": 0.3})
# Set the operating wavelength and the carrier frequencywavelength = 1.55  # Vacuum wavelength (um)carrier_frequency = C_0 / wavelength  # Optical carrier frequency (Hz)
# Set the linear properties of the silicon wirelength = 2.0e4  # Waveguide length: 2 cm (um)n_eff = 2.45  # Effective indexn_group = 4.2  # Group index, which sets the delayloss = 1.0 / 1e4  # Propagation loss: 1 dB/cm (dB/um)area = 0.1e-12  # Nonlinear effective area: 0.1 um^2 (m^2)
# Set the nonlinear coefficients of silicon at 1550 nmkerr_index = 6e-18  # Kerr coefficient n2 (m^2/W)tpa = 5e-12  # Two-photon absorption coefficient beta_TPA (m/W)fca = 1.45e-21  # Free-carrier absorption cross section sigma_a (m^2)fcd = -1.35e-27  # Index change per carrier density, linear in N (m^3)carrier_lifetime = 1e-9  # Carrier lifetime tau_c (s)
# Compute the vacuum wavenumber (1/m)k0 = 2 * np.pi / (wavelength * 1e-6)
# Convert the loss from dB/um to a power attenuation coefficient (1/m)alpha = loss * 1e6 * np.log(10) / 10
# Compute the effective length over which the nonlinear effects act (m)l_eff = (1 - np.exp(-alpha * length * 1e-6)) / alpha
# Compute the nonlinear coefficient gamma = k0 n2 / A_eff (1/(W m))gamma = k0 * kerr_index / area
# Print the derived quantitiesprint(    f"alpha = {alpha:.2f} 1/m, effective length = {l_eff * 1e3:.2f} mm, "    f"gamma = {gamma:.0f} 1/(W m)")
LiveViewer started at http://127.0.0.1:44871. Call its 'stop()' method to free the port.alpha = 23.03 1/m, effective length = 16.03 mm, gamma = 243 1/(W m)Creating the nonlinear waveguide model
Section titled “Creating the nonlinear waveguide model”pf.AnalyticWaveguideModel.nonlinear returns an
AnalyticWaveguideModel for frequency-domain
simulations with an
AnalyticWaveguideTimeStepper
attached as its time_stepper. Its arguments are the physical parameters:
- the cross-section:
n_eff,n_group,dispersionandeffective_area, given here explicitly; - the waveguide:
lengthandpropagation_loss; - the material:
kerr_index,tpa_coefficient,fca_cross_section,fcd_coefficients,fcd_exponentsandcarrier_lifetime; - the discretisation:
peak_power, the highest power expected at the input, from which the number of sections follows.
From these it builds the interpolators of the stepper, exact at every power:
dn_kerris linear in power, so two samples define it everywhere;- the steady-state free-carrier term grows as , so three samples of a
"cubicspline"interpolator define it everywhere: through three samples, the spline is the parabola itself; tau_fcis the carrier lifetime.
The function below wraps the class method in a parametric component, so that each comparison switches effects on and off with one argument. With the free carriers off, the carrier lifetime is zero, which disables the channel. The model is turned into a black box with virtual ports.
@pf.parametric_componentdef silicon_wire(    *,    peak_power=0.0,    kerr=True,    tpa_on=True,    carriers=False,    fcd_on=True,    dispersion=0.0,    linear_loss=True,    total_length=length,    sections=None,):    """Silicon wire of Yin and Agrawal, with the chosen nonlinear effects active."""    # Create the model and its nonlinear time stepper from the physical parameters    model = pf.AnalyticWaveguideModel.nonlinear(        reference_frequency=carrier_frequency,        n_eff=n_eff,        n_group=n_group,        dispersion=dispersion,        effective_area=area,        length=total_length,        propagation_loss=loss if linear_loss else 0.0,        kerr_index=kerr_index if kerr else 0.0,        tpa_coefficient=tpa if tpa_on else 0.0,        fca_cross_section=fca,        fcd_coefficients=(fcd if fcd_on else 0.0, 0.0),        carrier_lifetime=carrier_lifetime if carriers else 0.0,        peak_power=peak_power,        sections=sections,    )
    # Create a two-port black box carrying the model    return model.black_box_component(virtual_port_spec(), name="Silicon wire")
def propagate(waveguide, pulse, time_step):    """Step a pulse envelope through a waveguide and return the output envelope."""    # Set up the time stepper for this time step and carrier frequency    stepper = waveguide.setup_time_stepper(        time_step, carrier_frequency, show_progress=False    )
    # Inject the pulse at the input port and step through the whole record    inputs = pf.TimeSeries({"P0@0": pulse}, time_step)    output = stepper.step(inputs=inputs, show_progress=False)
    # Return the envelope at the output port    return output["P1@0"]
Before any pulse is launched, the interpolators of the stepper can be plotted to compare the size
of each effect. They are read from the parametric_kwargs of the time stepper. On logarithmic
axes the linear and quadratic power laws appear as straight lines of slope one and two. The
imaginary parts are converted to an absorption coefficient in 1/cm,
, and compared with the 1 dB/cm linear loss.
# Create the wire with every effect on and read its stepper's interpolatorswire = silicon_wire(carriers=True)tables = wire.active_model.time_stepper.parametric_kwargs
# Evaluate both channels from 1 mW to 20 Wplot_powers = np.logspace(-3, np.log10(20.0), 400)kerr_values = tables["dn_kerr"](plot_powers)carrier_values = tables["dn_fc"](plot_powers)
# Set the factor that converts an imaginary index into an absorption coefficient (1/cm)to_per_cm = 4 * np.pi / (wavelength * 1e-6) / 100
# Create two panels, for the real and the imaginary partsfig, axes = plt.subplots(1, 2, figsize=(10, 3.5), tight_layout=True)
# Plot the real parts as magnitudes, since the Kerr change is positive and FCD negativeaxes[0].loglog(plot_powers, kerr_values.real, label="Kerr (positive)")axes[0].loglog(    plot_powers, -carrier_values.real, label="free-carrier dispersion (negative)")axes[0].set_ylabel(r"magnitude of real $\Delta n$")axes[0].set_ylim(1e-9, 1e1)
# Plot the absorption each channel adds, against the linear lossaxes[1].loglog(plot_powers, kerr_values.imag * to_per_cm, label="two-photon absorption")axes[1].loglog(    plot_powers, carrier_values.imag * to_per_cm, label="free-carrier absorption")axes[1].axhline(alpha / 100, color="k", ls="--", lw=1, label="linear loss, 1 dB/cm")axes[1].set_ylabel(r"added absorption (cm$^{-1}$)")axes[1].set_ylim(1e-4, 1e5)
# Label the power axis of both panelsfor ax in axes:    ax.set_xlabel("optical power (W)")    ax.legend(fontsize=8, loc="upper left")plt.show()
# Find the power above which free-carrier absorption exceeds TPA in steady statecrossing = plot_powers[np.argmax(carrier_values.imag > kerr_values.imag)]print(f"steady-state FCA exceeds TPA above {crossing * 1e3:.0f} mW")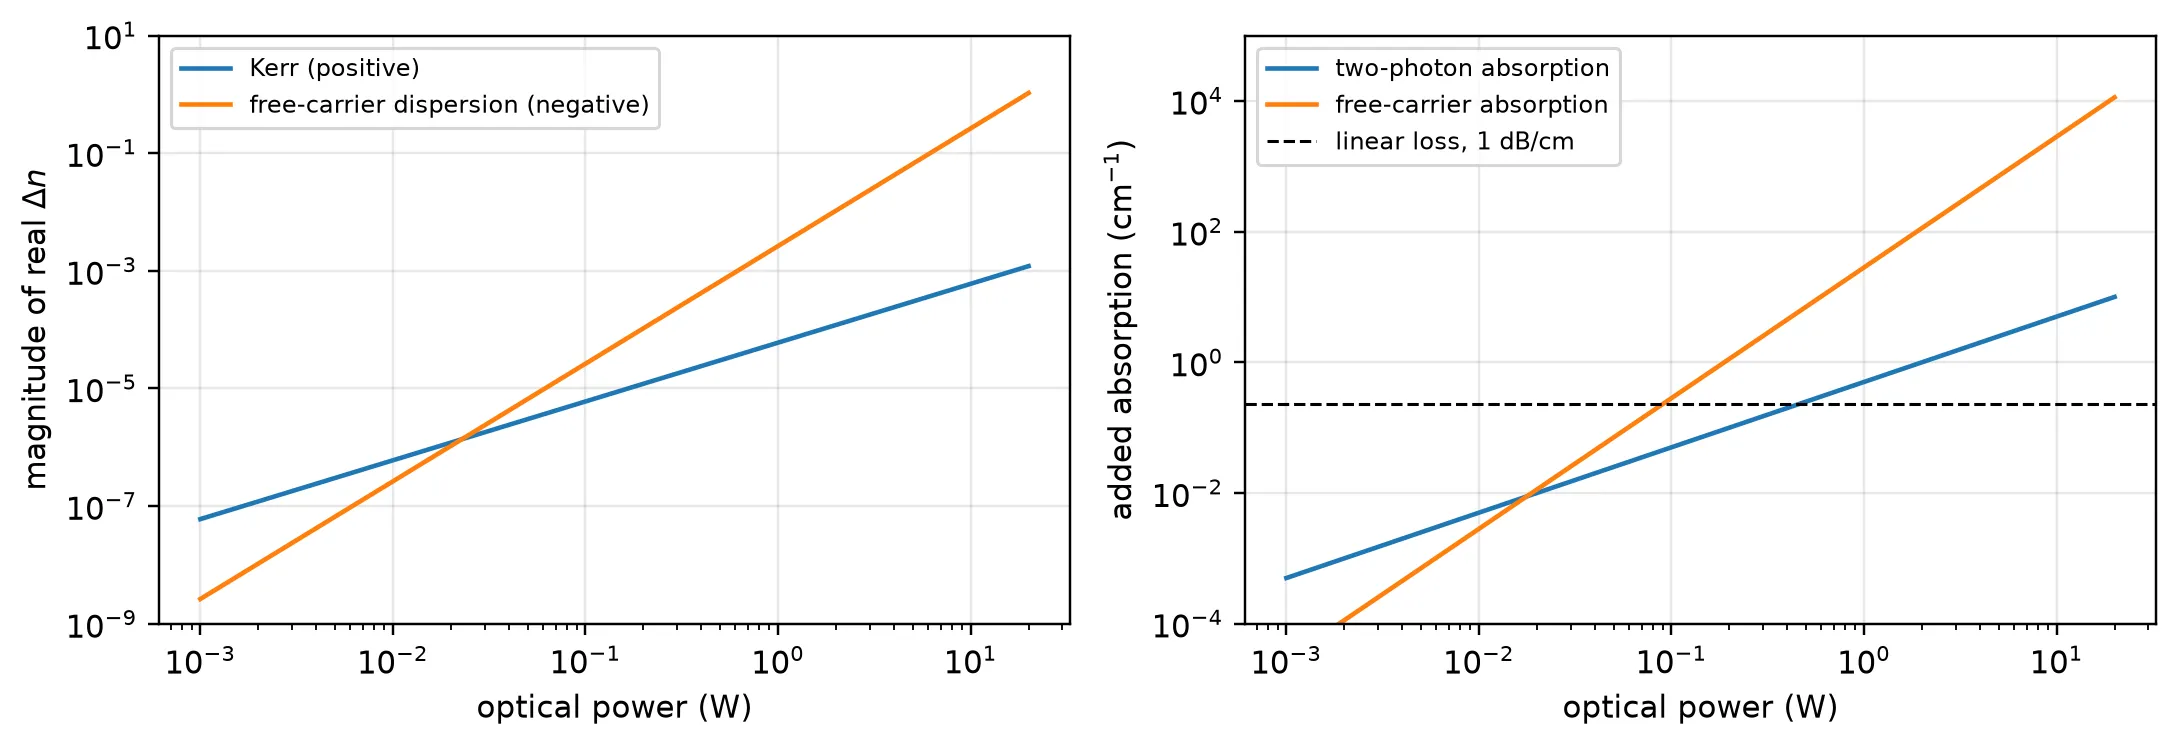
steady-state FCA exceeds TPA above 18 mWThe Kerr and TPA terms grow linearly with power, the free-carrier terms quadratically, so the free carriers are negligible at low power and dominate at high power. The two real parts have opposite signs: the Kerr effect raises the index while the free carriers lower it, so their chirps oppose each other.
The crossing power is a steady-state figure. It applies to signals much longer than the 1 ns carrier lifetime. A pulse of duration ends before the carriers approach : they accumulate to only about of it, so for picosecond pulses the free carriers matter only at watt-level peak powers.
Self-phase modulation with two-photon absorption
Section titled “Self-phase modulation with two-photon absorption”A Gaussian pulse enters the waveguide, with envelope and = 10 ps, the half-width at 1/e of the peak power. The Kerr effect turns the power profile of the pulse into a phase profile, which chirps the pulse and broadens its spectrum.
Choosing the peak power. SPM spectra are usually labelled by the maximum nonlinear phase , reached at the pulse peak. Without TPA, the peak intensity decays as along the waveguide, and the Kerr phase accumulates as
The peak power that gives a chosen phase is therefore . This phase is only a label for the input power: TPA removes power along the
way, so the phase actually accumulated is smaller. The same is passed as peak_power, so
the stepper chooses its sections for this pulse.
Closed-form solution. With free carriers neglected, Yin and Agrawal give the output intensity and nonlinear phase at each instant of the pulse:
The logarithm is the central result. The nonlinear phase grows ever more slowly with input intensity, so more power in a silicon wire buys less and less additional broadening. The closed-form values at the pulse peak are printed next to the simulated ones.
Time grid. A time step of 0.1 ps gives 100 samples per half-width and a simulated bandwidth of 10 THz, far wider than the broadened spectrum. The record of 6000 steps (600 ps) holds the pulse and the 280 ps group delay of the waveguide, .
Reading the spectrum. The stepper removes the carrier, so a component of the envelope that
rotates as lies at the optical frequency . The spectrum function
uses this to place the Fourier transform of the envelope on a wavelength axis.
# Set the time gridtime_step = 1e-13  # Time step: 0.1 ps (s)n_samples = 6000  # Record length: 600 pspeak_step = 500  # Time step of the input pulse peak: 50 ps into the recordt = (np.arange(n_samples) - peak_step) * time_step
# Set the input pulse half-width at 1/e of the peak power (s)t0 = 10e-12
# Set the plotted wavelength range and the power threshold for the phasewindow = 1.5  # Half-width of the plotted wavelength range (nm)threshold = 1e-3  # Fraction of the peak power above which the phase is measured
def spectrum(field):    """Power spectral density of an envelope against wavelength (nm)."""    # Take the power spectrum of the envelope, centred on the carrier    psd = np.abs(np.fft.fftshift(np.fft.fft(field))) ** 2
    # Compute the frequency offset of each spectral sample from the carrier (Hz)    nu = np.fft.fftshift(np.fft.fftfreq(field.size, time_step))
    # Convert each offset to a wavelength, the offset nu lying at f_c - nu    return 1e9 * C_0 * 1e-6 / (carrier_frequency - nu), psd
# Create one panel per nonlinear phasefig, axes = plt.subplots(1, 2, figsize=(10, 3.5), tight_layout=True)for ax, phi_max in zip(axes, [1.5 * np.pi, 7.5 * np.pi]):    # Set the peak power that gives this phase without TPA    peak_power = phi_max / (gamma * l_eff)    peak_intensity = peak_power / area
    # Create the Gaussian pulse envelope, in square root of watts    pulse = np.sqrt(peak_power) * np.exp(-0.5 * (t / t0) ** 2) + 0j
    # Propagate through the wire with the Kerr effect and TPA    out = propagate(silicon_wire(peak_power=peak_power), pulse, time_step)
    # Plot the output spectrum around the carrier wavelength    lam_nm, psd = spectrum(out)    keep = np.abs(lam_nm - wavelength * 1e3) < window    ax.plot(lam_nm[keep], psd[keep] / psd[keep].max(), lw=1.4)    ax.set_xlabel("wavelength (nm)")    ax.set_ylabel("normalised spectral density")    ax.set_title(        rf"$\phi_\mathrm{{max}}$ = {phi_max / np.pi:.1f}$\pi$, "        rf"$I_0$ = {peak_intensity / 1e13:.1f} GW/cm$^2$",        fontsize=9.5,    )
    # Measure the nonlinear phase as the phase swing across the pulse    power = np.abs(out) ** 2    phase = np.unwrap(np.angle(out))[power > threshold * power.max()]
    # Compute the closed-form peak intensity and phase at the output    closed_intensity = (        peak_intensity        * np.exp(-alpha * length * 1e-6)        / (1 + tpa * peak_intensity * l_eff)    )    closed_phase = k0 * kerr_index / tpa * np.log1p(tpa * peak_intensity * l_eff)
    # Print the simulated values next to the closed-form ones (GW/cm^2 and pi)    print(        f"phi_max = {phi_max / np.pi:.1f} pi: "        f"output peak intensity {power.max() / area / 1e13:.3f} "        f"(closed form {closed_intensity / 1e13:.3f}), "        f"nonlinear phase {np.ptp(phase) / np.pi:.2f} pi "        f"(closed form {closed_phase / np.pi:.2f} pi)"    )plt.show()
phi_max = 1.5 pi: output peak intensity 0.387 (closed form 0.387), nonlinear phase 1.05 pi (closed form 1.05 pi)phi_max = 7.5 pi: output peak intensity 0.653 (closed form 0.653), nonlinear phase 2.73 pi (closed form 2.73 pi)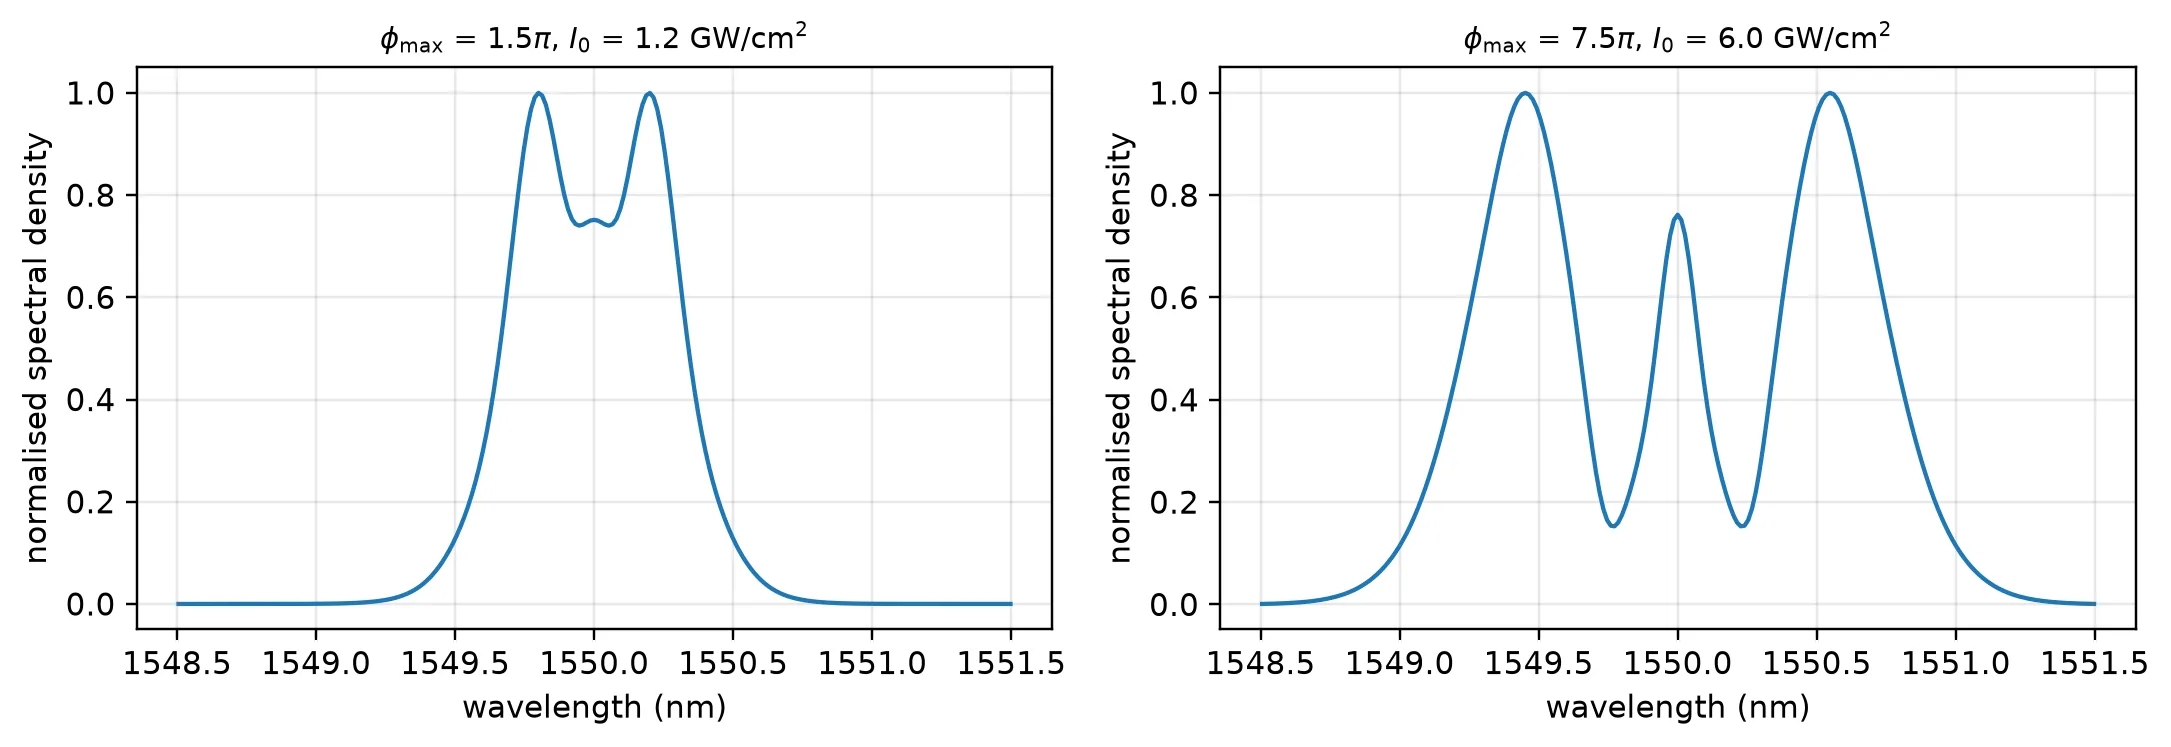
The spectrum develops the multiple peaks that are the signature of self-phase modulation, with the outermost pair the strongest. Raising from 1.5π to 7.5π, a fivefold increase in power, adds peaks but broadens the spectrum far less than fivefold: TPA limits the accumulated phase to 2.73π instead of 7.5π, the saturation that the logarithm describes. The simulated phase and output intensity are those of the closed form, because the stepper has cut the wire finely enough for each pulse. How finely is the subject of the next subsection.
How many sections
Section titled “How many sections”A single section applies the whole nonlinear phase at once, computed from the input power. The
real waveguide applies it continuously, while loss and TPA lower the power along the way. The
lumped version is accurate only while the phase and the power change per section are small, so
the number of sections needed grows with the nonlinear phase. With peak_power set, the stepper
takes
the Kerr phase over the whole length at the peak power, including the TPA term, divided by
max_phase . The cell below sends the 7.5π pulse through 1 to 64 sections
set explicitly with sections, and through the automatic count, and measures the nonlinear
phase.
# Set the pulse that gives 7.5 pi of phase without TPAphi_max = 7.5 * np.pipeak_power = phi_max / (gamma * l_eff)pulse = np.sqrt(peak_power) * np.exp(-0.5 * (t / t0) ** 2) + 0j
# Compute the closed-form nonlinear phase at the pulse peakpeak_intensity = peak_power / areaclosed_phase = k0 * kerr_index / tpa * np.log1p(tpa * peak_intensity * l_eff)
def nonlinear_phase(waveguide):    """Phase swing across the output pulse, in units of pi."""    # Propagate the pulse and keep the samples that carry significant power    out = propagate(waveguide, pulse, time_step)    power = np.abs(out) ** 2    return np.ptp(np.unwrap(np.angle(out))[power > threshold * power.max()]) / np.pi
# Propagate through waveguides cut into more and more sectionscounts = [1, 2, 4, 8, 16, 32, 64]phases = [nonlinear_phase(silicon_wire(sections=count)) for count in counts]
# Compute the automatic section count and propagate with itautomatic = int(np.ceil(k0 * length * 1e-6 * abs(tables["dn_kerr"](peak_power)) / 0.05))automatic_phase = nonlinear_phase(silicon_wire(peak_power=peak_power))
# Plot the nonlinear phase against the number of sectionsfig, ax = plt.subplots(figsize=(5.6, 3.3), tight_layout=True)ax.semilogx(counts, phases, "o-", ms=5, label="sections set explicitly")ax.semilogx(automatic, automatic_phase, "s", ms=7, label="automatic, from peak_power")ax.axhline(closed_phase / np.pi, color="k", ls="--", lw=1, label="closed form")ax.set_xlabel("number of sections")ax.set_ylabel(r"nonlinear phase ($\pi$)")ax.legend(fontsize=8)plt.show()
# Print the phase for each count and for the automatic onefor count, phase in zip(counts, phases):    print(f"{count:4d} sections: {phase:.3f} pi")print(    f"{automatic:4d} sections (automatic): {automatic_phase:.3f} pi, "    f"closed form {closed_phase / np.pi:.3f} pi")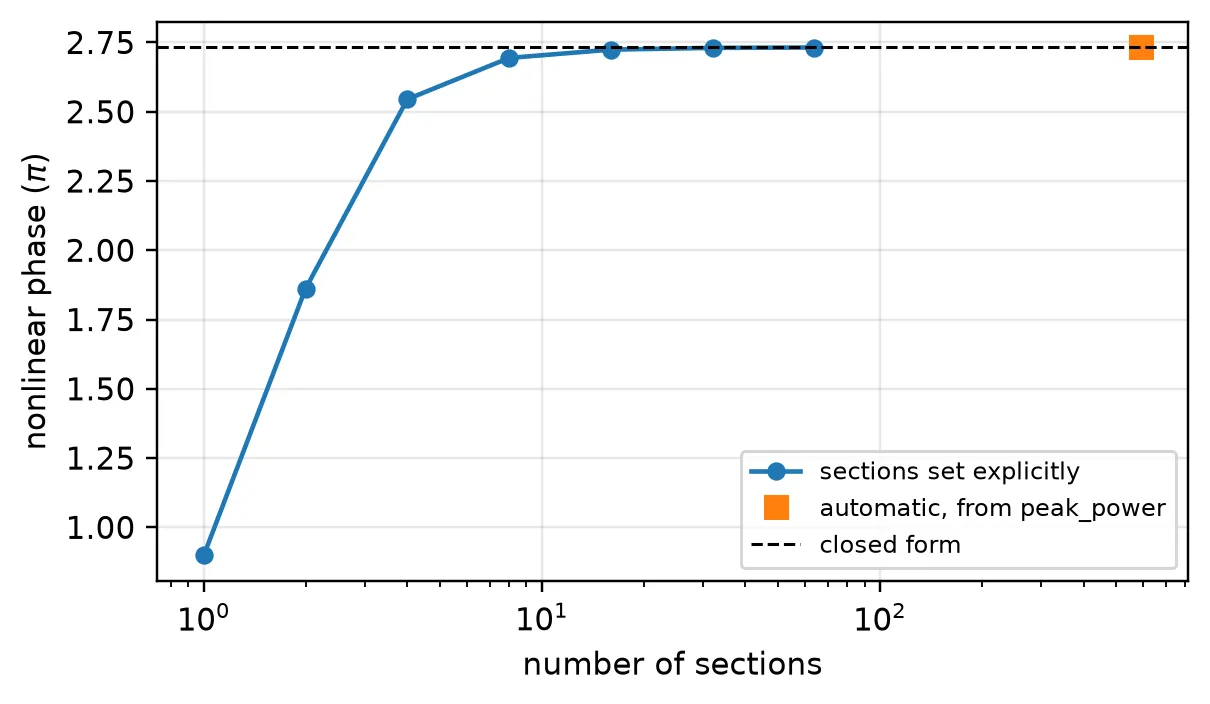
1 sections: 0.899 pi 2 sections: 1.862 pi 4 sections: 2.545 pi 8 sections: 2.694 pi 16 sections: 2.724 pi 32 sections: 2.730 pi 64 sections: 2.732 pi 592 sections (automatic): 2.732 pi, closed form 2.733 piWith one section the phase is 9.36π, which is : the input power applied over
the whole length, with neither the linear loss nor TPA reducing it. As the section count grows,
the phase approaches the closed-form 2.73π, and the remaining difference roughly halves each
time the count doubles, the behaviour of a first-order split-step scheme. For this pulse the
automatic count is 592 sections, which leaves 0.002π between the phase and the closed form.
max_phase therefore sets the accuracy, and the number of sections follows from the pulse.
Free carriers
Section titled “Free carriers”Two-photon absorption leaves electron-hole pairs behind, and in silicon they live for about a
nanosecond, fifty times longer than the 20 ps pulse. Their density therefore keeps rising
through the whole pulse instead of following its power, which is what dn_fc reproduces with
tau_fc set to the carrier lifetime.
The consequence is an asymmetry in time. The leading edge of the pulse meets almost no carriers, while the trailing edge travels through all the carriers the leading edge created.
The pulse is now set for , a peak intensity of 12.5 GW/cm², where the free carriers are strong. Three runs add the effects one at a time: TPA alone, then FCA, then FCD with the linear coefficient m³ used by Yin and Agrawal.
# Set the pulse that gives 15.5 pi of phase without TPAphi_max = 15.5 * np.pipeak_power = phi_max / (gamma * l_eff)pulse = np.sqrt(peak_power) * np.exp(-0.5 * (t / t0) ** 2) + 0jprint(    f"peak intensity {peak_power / area / 1e13:.1f} GW/cm^2, "    f"carrier lifetime {carrier_lifetime * 1e9:.0f} ns, "    f"pulse width {2 * t0 * 1e12:.0f} ps")
# Switch the free-carrier effects on one at a timecases = {    "TPA only": dict(carriers=False),    "TPA + FCA": dict(carriers=True, fcd_on=False),    "TPA + FCA + FCD": dict(carriers=True, fcd_on=True),}outputs = {    label: propagate(silicon_wire(peak_power=peak_power, **options), pulse, time_step)    for label, options in cases.items()}
# Set the plot ranges around the output pulse (ps) and the carrier wavelength (nm)time_window = 30spectral_window = 5
# Locate the output pulse peak without free carriers, the time origin of the plotpeak_index = int(np.argmax(np.abs(outputs["TPA only"]) ** 2))
# Create panels for the pulse shape and the spectrumfig, axes = plt.subplots(1, 2, figsize=(10, 3.6), tight_layout=True)for label, out in outputs.items():    # Plot the output power against time    axes[0].plot(        (t - t[peak_index]) * 1e12, np.abs(out) ** 2 * 1e3, lw=1.4, label=label    )
    # Plot the output spectrum around the carrier wavelength    lam_nm, psd = spectrum(out)    keep = np.abs(lam_nm - wavelength * 1e3) < spectral_window    axes[1].plot(lam_nm[keep], psd[keep] / psd[keep].max(), lw=1.3, label=label)
# Label both panelsaxes[0].set_xlabel("time (ps)")axes[0].set_ylabel("output power (mW)")axes[0].set_xlim(-time_window, time_window)axes[0].set_title("pulse shape", fontsize=9.5)axes[1].set_xlabel("wavelength (nm)")axes[1].set_ylabel("normalised spectral density")axes[1].set_title("spectrum", fontsize=9.5)for ax in axes:    ax.legend(fontsize=8)plt.show()
# Print the energy left in each half of the pulse (pJ)for label in ("TPA only", "TPA + FCA"):    power = np.abs(outputs[label]) ** 2    leading = power[:peak_index].sum() * time_step * 1e12    trailing = power[peak_index:].sum() * time_step * 1e12    print(        f"{label:9s}: leading half {leading:6.3f} pJ, trailing half {trailing:6.3f} pJ"    )
peak intensity 12.5 GW/cm^2, carrier lifetime 1 ns, pulse width 20 ps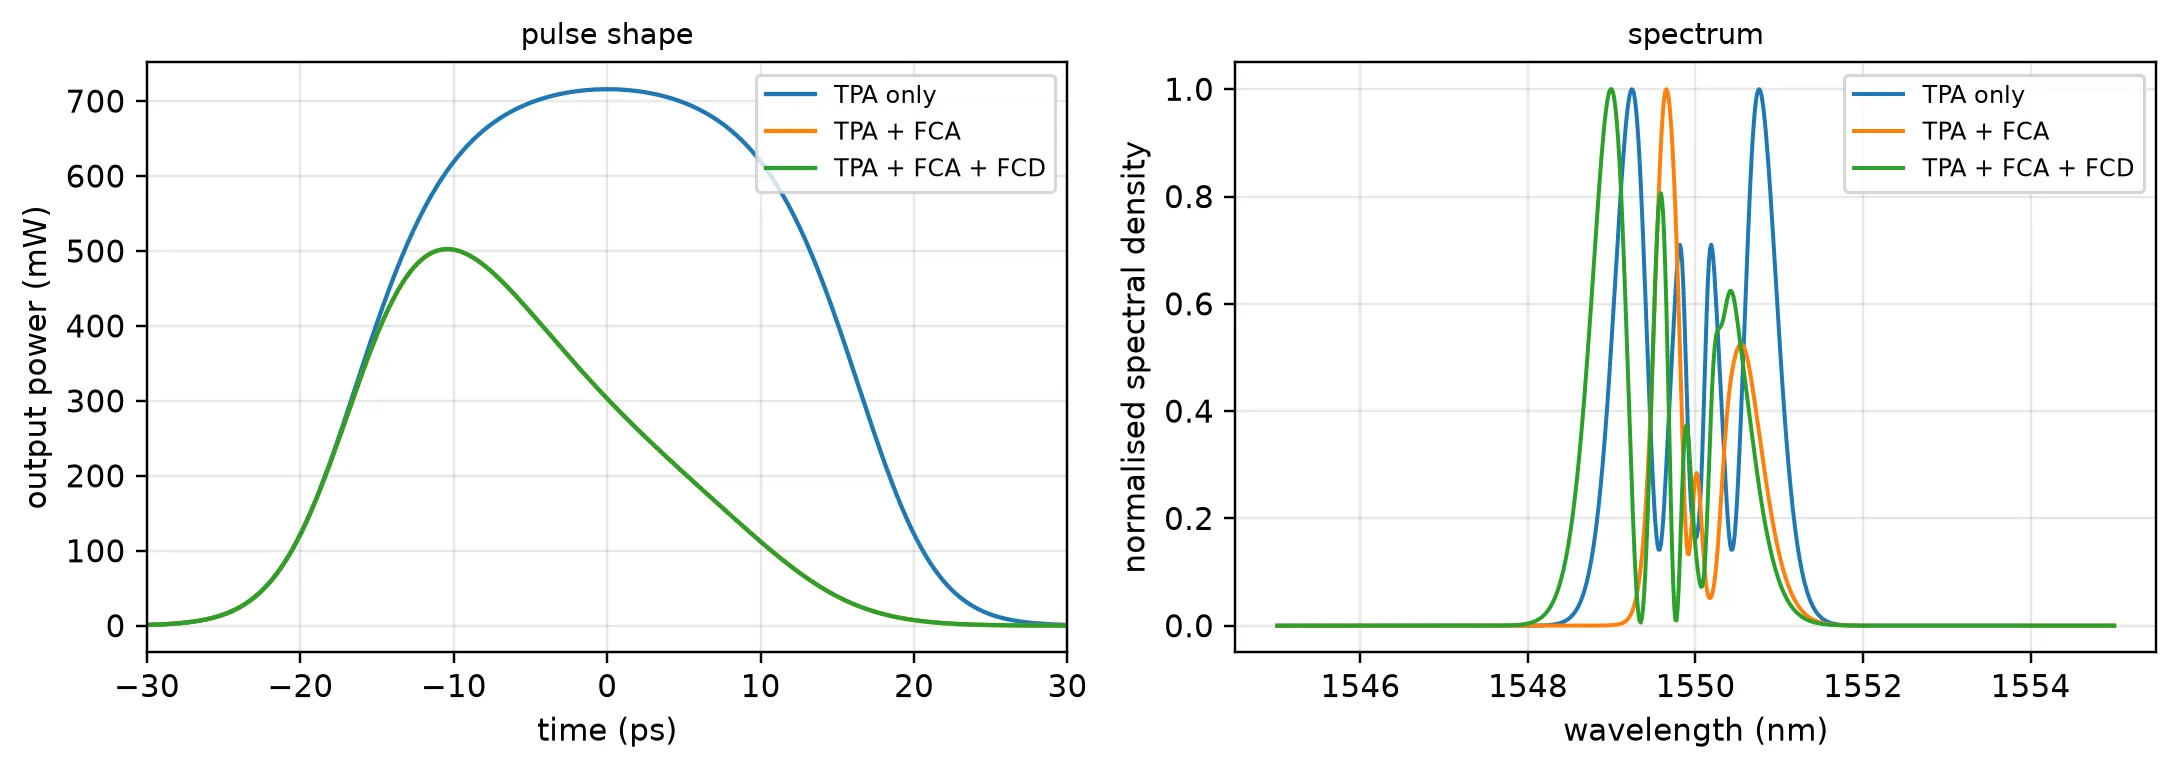
TPA only : leading half 11.050 pJ, trailing half 11.121 pJTPA + FCA: leading half 8.018 pJ, trailing half 2.543 pJFree-carrier absorption removes most of the trailing half of the pulse, leaving 2.5 pJ of 11.1 pJ, while the leading half keeps 8.0 of 11.0 pJ, and the output peak moves 10 ps earlier. Self-phase modulation puts the red-shifted light on the leading edge and the blue-shifted light on the trailing edge, so cutting the trailing edge cuts the blue side of the spectrum: the peak near 1549.2 nm disappears and the spectrum becomes lopsided rather than simply weaker.
Free-carrier dispersion acts in the other direction. Its index change is negative and grows during the pulse, which shifts light towards shorter wavelengths: the spectrum moves to the blue and gains a peak near 1549.0 nm. FCD changes only the phase, so in the pulse-shape panel its curve lies on top of the FCA one. The free carriers therefore cannot be treated as an extra loss: they change where the light ends up in the spectrum, not only how much of it survives.
The section count still comes from the Kerr phase alone, 1222 sections here. With free carriers this strong it holds the output energy within 0.3% of a run with four times as many sections.
Chromatic dispersion
Section titled “Chromatic dispersion”Chromatic dispersion makes the group velocity depend on frequency. It is described by the group-velocity dispersion , the second derivative of the propagation constant, and acts over the dispersion length . For the 10 ps pulse above and = 1 ps²/m, is 100 m, so dispersion is negligible in a 2 cm waveguide. For a pulse with = 100 fs, falls to 1 cm, and dispersion and the nonlinear phase act over the same distance.
The class method takes the dispersion in the same form as the frequency-domain model, as the dispersion parameter in s/µm² rather than as . The two are related by
The stepper applies the dispersion as a finite impulse response filter on the envelope, one per section, which interleaves it with the nonlinear phase.
With anomalous dispersion (), the dispersive chirp and the Kerr chirp have opposite signs. For a pulse they cancel exactly when the soliton order
equals one, and the pulse propagates without changing shape. This is a fundamental soliton, with peak power . Three runs over one dispersion length compare dispersion alone, the soliton without any loss, and the soliton with the TPA and linear loss of silicon.
The time step is reduced to 10 fs, giving 10 samples per half-width, and the record of 200 ps holds the 140 ps group delay of the 1 cm waveguide.
# Set the anomalous group-velocity dispersion and the short pulse widthbeta2 = -1e-24  # Group-velocity dispersion beta_2: -1 ps^2/m (s^2/m)t0_short = 100e-15  # Pulse half-width T0 (s)
# Convert beta_2 to s^2/um, then to the dispersion parameter D (s/um^2)dispersion = -2 * np.pi * C_0 * (beta2 * 1e-6) / wavelength**2
# Compute the peak power of the fundamental soliton, N = 1 (W)soliton_power = abs(beta2) / (gamma * t0_short**2)
# Set the waveguide length to one dispersion length (um)dispersion_length = t0_short**2 / abs(beta2) * 1e6print(    f"D = {dispersion:.3e} s/um^2, "    f"dispersion length {dispersion_length * 1e-3:.1f} mm, "    f"soliton peak power {soliton_power * 1e3:.0f} mW")
# Set the finer time gridstep_short = 1e-14  # Time step: 10 fs (s)n_short = 20000  # Record length: 200 pspeak_short = 3000  # Time step of the input pulse peak: 30 ps into the recordplot_range = 700  # Half-width of the plotted time range (fs)t_short = (np.arange(n_short) - peak_short) * step_short
# Create the sech pulse, clipping the argument so cosh does not overflow in the wingssech = np.sqrt(soliton_power) / np.cosh(np.clip(t_short / t0_short, -300, 300)) + 0j
# Switch the Kerr effect and the losses on or off for each runruns = {    "dispersion only": dict(kerr=False, tpa_on=False, linear_loss=False),    "soliton, lossless": dict(kerr=True, tpa_on=False, linear_loss=False),    "soliton in silicon": dict(kerr=True, tpa_on=True, linear_loss=True),}
# Plot the input pulse, centred on its peak (fs)fig, ax = plt.subplots(figsize=(6.4, 3.6), tight_layout=True)power_in = np.abs(sech) ** 2ax.plot(    (t_short - t_short[peak_short]) * 1e15,    power_in / power_in.max(),    "k",    lw=2,    label="input",)
for label, options in runs.items():    # Propagate through one dispersion length of dispersive waveguide    waveguide = silicon_wire(        peak_power=soliton_power,        dispersion=dispersion,        total_length=dispersion_length,        **options,    )    out = propagate(waveguide, sech, step_short)
    # Plot the output pulse, centred on its own peak    power = np.abs(out) ** 2    shift = t_short[int(np.argmax(power))]    ax.plot((t_short - shift) * 1e15, power / power.max(), lw=1.4, label=label)
    # Measure the full width at half maximum of the output pulse (fs)    above = power > power.max() / 2    width = (t_short[above][-1] - t_short[above][0]) * 1e15    print(        f"{label:18s}: output width {width:4.0f} fs, "        f"peak power {power.max() * 1e3:5.1f} mW"    )
# Label the plotax.set_xlabel("time (fs)")ax.set_ylabel("normalised power")ax.set_xlim(-plot_range, plot_range)ax.legend(fontsize=8)ax.set_title("one dispersion length of propagation", fontsize=9.5)plt.show()
# Print the input full width at half maximum, 1.763 T0 for a sech pulseprint(f"input width {1.763 * t0_short * 1e15:.0f} fs")
D = 7.840e-16 s/um^2, dispersion length 10.0 mm, soliton peak power 411 mWdispersion only : output width 260 fs, peak power 293.0 mWsoliton, lossless : output width 170 fs, peak power 410.7 mWsoliton in silicon: output width 190 fs, peak power 267.8 mW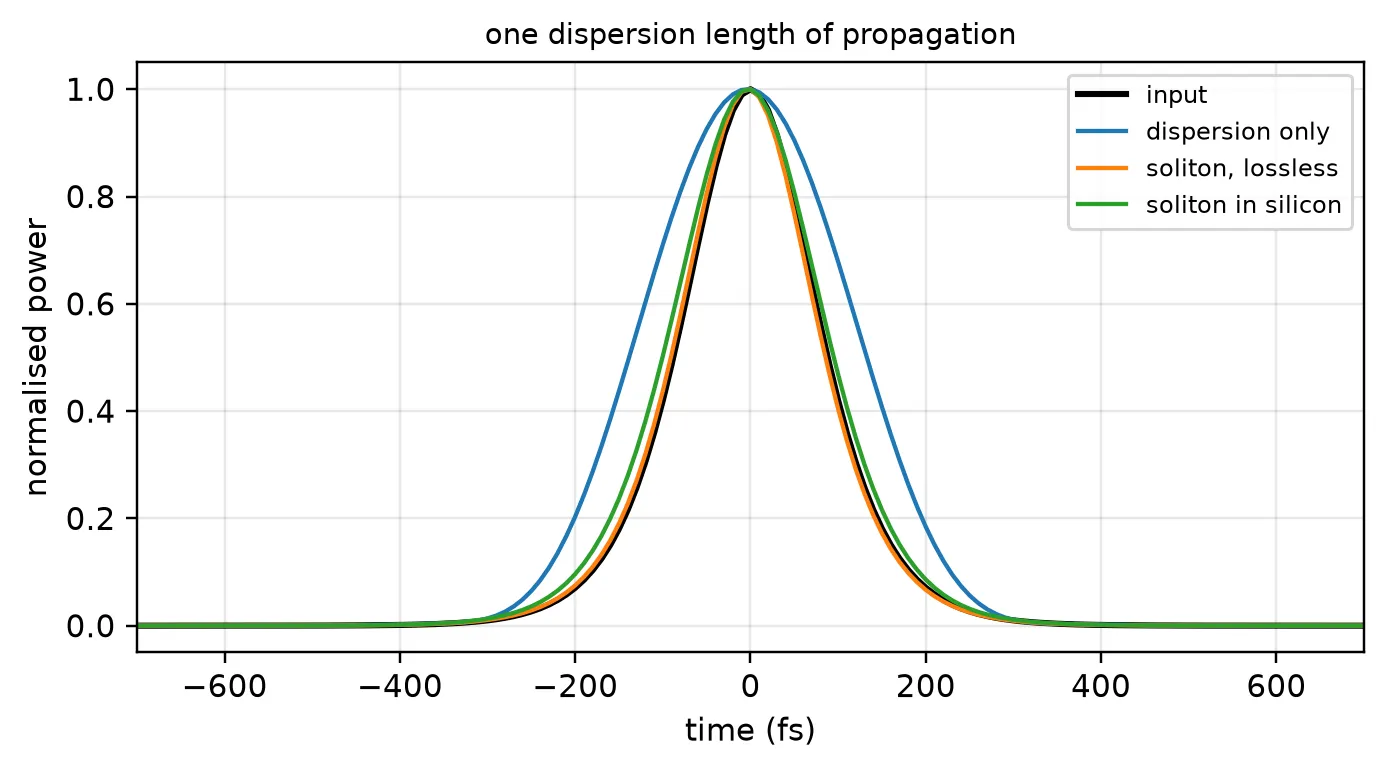
input width 176 fsDispersion alone stretches the pulse from 176 fs to 260 fs, by about half again, over one dispersion length. With the matched Kerr phase the lossless pulse keeps its width and peak power, since the nonlinear chirp cancels the dispersive one. In silicon the width is still close to the input, but TPA and the 1 dB/cm linear loss have taken a third of the peak power. The balance depends on that power, so over longer distances the pulse broadens. Soliton propagation over many dispersion lengths is therefore a result for silicon nitride, which has no TPA at 1550 nm, rather than for silicon.
A routed spiral from its cross-section
Section titled “A routed spiral from its cross-section”A real device is a routed waveguide, here a rectangular spiral of 2 cm drawn in the basic technology. The same class method applies, with two differences:
- the material coefficients live on the Tidy3D medium of the silicon core, as a
nonlinear_specwith aKerrNonlinearityand aTwoPhotonAbsorption. Tidy3D states them in µm-based units: in µm²/W, in µm/W, in µm², and the plasma-dispersion coefficients in µm. The same medium can be used in a nonlinear FDTD simulation. The values below are those of silicon at 1550 nm, with the Soref and Bennett form of free-carrier dispersion, ; - the cross-section is given by its port specification,
"Strip". The class method runs one mode solve at the carrier frequency and takes , , and the effective areas from it, reading the nonlinear coefficients from the core medium. The values it used are stored in thepropertiesof the returned model.
No length is given: the model is added to the spiral, and the stepper measures the length of
the routed path from the layout.
# Describe the nonlinearity of silicon at 1550 nm on its Tidy3D mediumsilicon_nonlinearity = td.NonlinearSpec(    models=[        td.KerrNonlinearity(n2=6e-6),  # n2: 6e-18 m^2/W (um^2/W)        td.TwoPhotonAbsorption(            beta=5e-6,  # beta_TPA: 5e-12 m/W (um/W)            tau=1e-9,  # Carrier lifetime (s)            sigma=1.45e-9,  # FCA cross section: 1.45e-21 m^2 (um^2)            c_e=-8.8e-10,  # Soref electron term: -8.8e-22 cm^3 (um^3)            c_h=-3.38e-8,  # Soref hole term: -8.5e-18 cm^2.4 (um^2.4)            e_h=0.8,  # Soref hole exponent        ),    ])silicon = td.Medium(    permittivity=3.476**2, nonlinear_spec=silicon_nonlinearity, name="Si")
# Create the technology with the nonlinear silicon coretechnology = pf.basic_technology(core_medium=silicon)
# Draw a 2 cm rectangular spiral with the strip cross-sectionspiral = pf.parametric.rectangular_spiral( port_spec="Strip", full_length=length, radius=10.0, # Bend radius (um) technology=technology,)viewer(spiral);fill:%23221f20;font-weight:bold;font-size:10.093336px;}.terminal{fill:none;stroke:%23805080;stroke-width:1.261667;}.dashed{stroke-dasharray:6.308335,3.785001;}.port{fill:none;stroke:%23805080;stroke-width:2.523334;}.virtual-connection{fill:none;stroke:%23907090;stroke-width:1.892501;}.layer_5_0{stroke:%23998573;fill:url(%23pat-layer_5_0);fill-opacity:0.492;}.label_5_0{fill:%23998573;}.layer_3_0{stroke:%238851ad;fill:url(%23pat-layer_3_0);fill-opacity:0.492;}.label_3_0{fill:%238851ad;}.layer_4_0{stroke:%23535e59;fill:url(%23pat-layer_4_0);fill-opacity:0.492;}.label_4_0{fill:%23535e59;}.layer_1_0{stroke:%23858d89;fill:url(%23pat-layer_1_0);fill-opacity:0.492;}.label_1_0{fill:%23858d89;}.layer_2_0{stroke:%235b98b9;fill:url(%23pat-layer_2_0);fill-opacity:0.492;}.label_2_0{fill:%235b98b9;}</style><defs><path id=%22port-symbol%22 class=%22port%22 d=%22M 0,-5.046668 L 7.570002,0 0,5.046668%22 /><path id=%22ref-port-symbol%22 class=%22port%22 style=%22stroke-opacity:0.33;%22 d=%22M 0,-3.785001 C 5.046668,-3.785001 5.046668,3.785001 0,3.785001%22 /><circle id=%22port-bend-symbol%22 style=%22stroke-width:0;stroke:none;fill:%23805080;fill-opacity:1;%22 cx=%220%22 cy=%220%22 r=%222.271001%22 /><circle id=%22connection-symbol%22 style=%22stroke-width:0;stroke:none;fill:%23907090;fill-opacity:1;%22 cx=%220%22 cy=%220%22 r=%222.649501%22 /><pattern id=%22pat-layer_5_0%22 patternUnits=%22userSpaceOnUse%22 width=%226.308335%22 height=%226.308335%22 patternTransform=%22translate(0.371079,5.644300)%22><line x1=%226.308335%22 y1=%220%22 x2=%220%22 y2=%226.308335%22 style=%22stroke:%23998573;stroke-width:0.630834%22 /><line x1=%229.462503%22 y1=%223.154168%22 x2=%223.154168%22 y2=%229.462503%22 style=%22stroke:%23998573;stroke-width:0.630834%22 /><line x1=%223.154168%22 y1=%22-3.154168%22 x2=%22-3.154168%22 y2=%223.154168%22 style=%22stroke:%23998573;stroke-width:0.630834%22 /></pattern><pattern id=%22pat-layer_3_0%22 patternUnits=%22userSpaceOnUse%22 width=%223.785001%22 height=%223.785001%22 patternTransform=%22translate(0.890588,2.788948)%22><circle cx=%221.892501%22 cy=%221.892501%22 r=%220.630834%22 style=%22stroke:none;fill:%238851ad;fill-opacity:1.0%22 /></pattern><pattern id=%22pat-layer_4_0%22 patternUnits=%22userSpaceOnUse%22 width=%226.308335%22 height=%226.308335%22 patternTransform=%22translate(4.081864,1.992106)%22><line x1=%223.154168%22 y1=%220%22 x2=%223.154168%22 y2=%226.308335%22 style=%22stroke:%23535e59;stroke-width:0.630834%22 /><line x1=%220%22 y1=%223.154168%22 x2=%226.308335%22 y2=%223.154168%22 style=%22stroke:%23535e59;stroke-width:0.630834%22 /></pattern><pattern id=%22pat-layer_1_0%22 patternUnits=%22userSpaceOnUse%22 width=%226.308335%22 height=%226.308335%22 patternTransform=%22translate(2.597550,3.652194)%22><circle cx=%223.154168%22 cy=%223.154168%22 r=%220.630834%22 style=%22stroke:none;fill:%23858d89;fill-opacity:1.0%22 /></pattern><pattern id=%22pat-layer_2_0%22 patternUnits=%22userSpaceOnUse%22 width=%226.308335%22 height=%226.308335%22 patternTransform=%22translate(5.195099,0.996053)%22><line x1=%220%22 y1=%220%22 x2=%226.308335%22 y2=%226.308335%22 style=%22stroke:%235b98b9;stroke-width:0.630834%22 /><line x1=%22-3.154168%22 y1=%223.154168%22 x2=%223.154168%22 y2=%229.462503%22 style=%22stroke:%235b98b9;stroke-width:0.630834%22 /><line x1=%223.154168%22 y1=%22-3.154168%22 x2=%229.462503%22 y2=%223.154168%22 style=%22stroke:%235b98b9;stroke-width:0.630834%22 /></pattern><g id=%22C1%22 data-name=%22bend__IWBAENOFOFSJ6A24HUOANPG6L7E3M7CVRIH3Z4SVD4H4WHOR5ECQ%22><path class=%22layer_1_0%22 d=%22M 0.000000,-1.250000 0.572000,-1.269000 0.858000,-1.292000 1.425000,-1.367000 1.707000,-1.418000 2.265000,-1.548000 2.813000,-1.714000 3.348000,-1.916000 3.870000,-2.152000 4.375000,-2.422000 4.621000,-2.569000 5.097000,-2.888000 5.551000,-3.236000 5.981000,-3.614000 6.386000,-4.019000 6.764000,-4.449000 7.112000,-4.903000 7.431000,-5.379000 7.717000,-5.875000 7.970000,-6.389000 8.189000,-6.918000 8.286000,-7.187000 8.452000,-7.735000 8.582000,-8.293000 8.675000,-8.858000 8.708000,-9.142000 8.745000,-9.714000 8.750000,-10.000000 11.250000,-10.000000 11.244000,-9.632000 11.226000,-9.264000 11.196000,-8.897000 11.154000,-8.532000 11.100000,-8.167000 11.034000,-7.805000 10.956000,-7.445000 10.867000,-7.088000 10.766000,-6.734000 10.653000,-6.384000 10.529000,-6.037000 10.394000,-5.695000 10.247000,-5.357000 10.090000,-5.024000 9.922000,-4.697000 9.743000,-4.375000 9.554000,-4.059000 9.354000,-3.750000 9.145000,-3.447000 8.925000,-3.151000 8.696000,-2.863000 8.458000,-2.582000 8.211000,-2.310000 7.955000,-2.045000 7.690000,-1.789000 7.418000,-1.542000 7.137000,-1.304000 6.849000,-1.075000 6.553000,-0.855000 6.250000,-0.646000 5.941000,-0.446000 5.625000,-0.257000 5.303000,-0.078000 4.976000,0.090000 4.643000,0.247000 4.305000,0.394000 3.963000,0.529000 3.616000,0.653000 3.266000,0.766000 2.912000,0.867000 2.555000,0.956000 2.195000,1.034000 1.833000,1.100000 1.468000,1.154000 1.103000,1.196000 0.736000,1.226000 0.368000,1.244000 0.000000,1.250000 z%22 /><path class=%22layer_2_0%22 d=%22M 0.000000,-0.250000 0.319000,-0.255000 0.638000,-0.271000 0.956000,-0.297000 1.273000,-0.333000 1.588000,-0.380000 1.902000,-0.437000 2.523000,-0.582000 3.134000,-0.767000 3.731000,-0.992000 4.024000,-1.119000 4.312000,-1.255000 4.596000,-1.401000 4.875000,-1.556000 5.149000,-1.720000 5.417000,-1.893000 5.935000,-2.265000 6.185000,-2.463000 6.429000,-2.670000 6.665000,-2.884000 7.116000,-3.335000 7.330000,-3.571000 7.537000,-3.815000 7.925000,-4.321000 8.107000,-4.583000 8.280000,-4.851000 8.444000,-5.125000 8.599000,-5.404000 8.745000,-5.688000 8.881000,-5.976000 9.008000,-6.269000 9.233000,-6.866000 9.418000,-7.477000 9.563000,-8.098000 9.620000,-8.412000 9.667000,-8.727000 9.703000,-9.044000 9.729000,-9.362000 9.745000,-9.681000 9.750000,-10.000000 10.250000,-10.000000 10.245000,-9.665000 10.201000,-8.995000 10.162000,-8.662000 10.113000,-8.330000 10.053000,-8.000000 9.982000,-7.672000 9.901000,-7.347000 9.809000,-7.025000 9.706000,-6.705000 9.593000,-6.389000 9.470000,-6.077000 9.336000,-5.770000 9.193000,-5.467000 9.040000,-5.168000 8.877000,-4.875000 8.523000,-4.305000 8.332000,-4.030000 8.132000,-3.760000 7.923000,-3.497000 7.481000,-2.993000 7.248000,-2.752000 7.007000,-2.519000 6.758000,-2.294000 6.503000,-2.077000 6.240000,-1.868000 5.970000,-1.668000 5.695000,-1.477000 5.125000,-1.123000 4.832000,-0.960000 4.533000,-0.807000 3.923000,-0.530000 3.611000,-0.407000 3.295000,-0.294000 2.975000,-0.191000 2.653000,-0.099000 2.328000,-0.018000 2.000000,0.053000 1.670000,0.113000 1.338000,0.162000 1.005000,0.201000 0.335000,0.245000 0.000000,0.250000 z%22 /></g><g id=%22C10%22 data-name=%22straight__PZQWV6GGINJJT5IR3IGILPU75LB2GLIRUWKMKOQYXSBBR7CXC4IQ%22><path class=%22layer_1_0%22 d=%22M 0.000000,-1.250000 15.750000,-1.250000 15.750000,1.250000 0.000000,1.250000 z%22 /><path class=%22layer_2_0%22 d=%22M 0.000000,-0.250000 15.750000,-0.250000 15.750000,0.250000 0.000000,0.250000 z%22 /></g><g id=%22C11%22 data-name=%22straight__YX6NSXBL3M7AHKXZBMDJL4JMQ24OIQQAG4WQVEFFYDLGH6ZR5OCQ%22><path class=%22layer_1_0%22 d=%22M 0.000000,-1.250000 38.144000,-1.250000 38.144000,1.250000 0.000000,1.250000 z%22 /><path class=%22layer_2_0%22 d=%22M 0.000000,-0.250000 38.144000,-0.250000 38.144000,0.250000 0.000000,0.250000 z%22 /></g><g id=%22C12%22 data-name=%22straight__IAHOY6YIYA4IWVQPINXAYUSXH5SV7MDZDLHBMTTHBIOBVOKURRMQ%22><path class=%22layer_1_0%22 d=%22M 0.000000,-1.250000 20.250000,-1.250000 20.250000,1.250000 0.000000,1.250000 z%22 /><path class=%22layer_2_0%22 d=%22M 0.000000,-0.250000 20.250000,-0.250000 20.250000,0.250000 0.000000,0.250000 z%22 /></g><g id=%22C13%22 data-name=%22straight__JWHYKWFCW6IYHEH6M6Q4UVSET2SUYEWFPIVJE6WUOW2TQT35I4RA%22><path class=%22layer_1_0%22 d=%22M 0.000000,-1.250000 42.644000,-1.250000 42.644000,1.250000 0.000000,1.250000 z%22 /><path class=%22layer_2_0%22 d=%22M 0.000000,-0.250000 42.644000,-0.250000 42.644000,0.250000 0.000000,0.250000 z%22 /></g><g id=%22C14%22 data-name=%22straight__CFZEZUVENYE4GDVP5EBKYYAPWEO4EKNQBJJJKAWV6D2XXMPHA4HA%22><path class=%22layer_1_0%22 d=%22M 0.000000,-1.250000 24.750000,-1.250000 24.750000,1.250000 0.000000,1.250000 z%22 /><path class=%22layer_2_0%22 d=%22M 0.000000,-0.250000 24.750000,-0.250000 24.750000,0.250000 0.000000,0.250000 z%22 /></g><g id=%22C15%22 data-name=%22straight__NE3QTN6CQSI3EMEVDBMISRSUVTNWZMIYZV6TVEXHJPVL7IR44EIQ%22><path class=%22layer_1_0%22 d=%22M 0.000000,-1.250000 47.144000,-1.250000 47.144000,1.250000 0.000000,1.250000 z%22 /><path class=%22layer_2_0%22 d=%22M 0.000000,-0.250000 47.144000,-0.250000 47.144000,0.250000 0.000000,0.250000 z%22 /></g><g id=%22C16%22 data-name=%22straight__SR7LWIDMQTZC6V725CY4PH3UVSSTCBXSMFDOZISN34SWMV6NZDBQ%22><path class=%22layer_1_0%22 d=%22M 0.000000,-1.250000 29.250000,-1.250000 29.250000,1.250000 0.000000,1.250000 z%22 /><path class=%22layer_2_0%22 d=%22M 0.000000,-0.250000 29.250000,-0.250000 29.250000,0.250000 0.000000,0.250000 z%22 /></g><g id=%22C17%22 data-name=%22straight__6R6T2N6WGBQM7TIG6NXS5XIFPB2BUKJDXXKUPRKSAIOW5TB35DFA%22><path class=%22layer_1_0%22 d=%22M 0.000000,-1.250000 51.644000,-1.250000 51.644000,1.250000 0.000000,1.250000 z%22 /><path class=%22layer_2_0%22 d=%22M 0.000000,-0.250000 51.644000,-0.250000 51.644000,0.250000 0.000000,0.250000 z%22 /></g><g id=%22C18%22 data-name=%22straight__ZLPTNYJZLMPT4P45YYHHQ3AFYZ4CG4OSJYUK6TC7YRWLNPPOQENQ%22><path class=%22layer_1_0%22 d=%22M 0.000000,-1.250000 33.750000,-1.250000 33.750000,1.250000 0.000000,1.250000 z%22 /><path class=%22layer_2_0%22 d=%22M 0.000000,-0.250000 33.750000,-0.250000 33.750000,0.250000 0.000000,0.250000 z%22 /></g><g id=%22C19%22 data-name=%22straight__KGJIEZEMD5QXPS56VOMDMVYR6WZVYPLPLEBIFM6H2K5CR24JNQVA%22><path class=%22layer_1_0%22 d=%22M 0.000000,-1.250000 56.144000,-1.250000 56.144000,1.250000 0.000000,1.250000 z%22 /><path class=%22layer_2_0%22 d=%22M 0.000000,-0.250000 56.144000,-0.250000 56.144000,0.250000 0.000000,0.250000 z%22 /></g><g id=%22C2%22 data-name=%22bend__4GW562RNS5AAJPDIKM6ZAGBNYHBKPPAPVULKQIWDPUWOYRJUPYPA%22><path class=%22layer_1_0%22 d=%22M 0.000000,-1.250000 0.368000,-1.244000 0.736000,-1.226000 1.103000,-1.196000 1.468000,-1.154000 1.833000,-1.100000 2.195000,-1.034000 2.555000,-0.956000 2.912000,-0.867000 3.266000,-0.766000 3.616000,-0.653000 3.963000,-0.529000 4.305000,-0.394000 4.643000,-0.247000 4.976000,-0.090000 5.303000,0.078000 5.625000,0.257000 5.941000,0.446000 6.250000,0.646000 6.553000,0.855000 6.849000,1.075000 7.137000,1.304000 7.418000,1.542000 7.690000,1.789000 7.955000,2.045000 8.211000,2.310000 8.458000,2.582000 8.696000,2.863000 8.925000,3.151000 9.145000,3.447000 9.354000,3.750000 9.554000,4.059000 9.743000,4.375000 9.922000,4.697000 10.090000,5.024000 10.247000,5.357000 10.394000,5.695000 10.529000,6.037000 10.653000,6.384000 10.766000,6.734000 10.867000,7.088000 10.956000,7.445000 11.034000,7.805000 11.100000,8.167000 11.154000,8.532000 11.196000,8.897000 11.226000,9.264000 11.244000,9.632000 11.250000,10.000000 8.750000,10.000000 8.745000,9.714000 8.708000,9.142000 8.675000,8.858000 8.582000,8.293000 8.452000,7.735000 8.286000,7.187000 8.189000,6.918000 7.970000,6.389000 7.717000,5.875000 7.431000,5.379000 7.112000,4.903000 6.764000,4.449000 6.386000,4.019000 5.981000,3.614000 5.551000,3.236000 5.097000,2.888000 4.621000,2.569000 4.375000,2.422000 3.870000,2.152000 3.348000,1.916000 2.813000,1.714000 2.265000,1.548000 1.707000,1.418000 1.425000,1.367000 0.858000,1.292000 0.572000,1.269000 0.000000,1.250000 z%22 /><path class=%22layer_2_0%22 d=%22M 0.000000,-0.250000 0.335000,-0.245000 1.005000,-0.201000 1.338000,-0.162000 1.670000,-0.113000 2.000000,-0.053000 2.328000,0.018000 2.653000,0.099000 2.975000,0.191000 3.295000,0.294000 3.611000,0.407000 3.923000,0.530000 4.533000,0.807000 4.832000,0.960000 5.125000,1.123000 5.695000,1.477000 5.970000,1.668000 6.240000,1.868000 6.503000,2.077000 6.758000,2.294000 7.007000,2.519000 7.248000,2.752000 7.481000,2.993000 7.923000,3.497000 8.132000,3.760000 8.332000,4.030000 8.523000,4.305000 8.877000,4.875000 9.040000,5.168000 9.193000,5.467000 9.336000,5.770000 9.470000,6.077000 9.593000,6.389000 9.706000,6.705000 9.809000,7.025000 9.901000,7.347000 9.982000,7.672000 10.053000,8.000000 10.113000,8.330000 10.162000,8.662000 10.201000,8.995000 10.245000,9.665000 10.250000,10.000000 9.750000,10.000000 9.745000,9.681000 9.729000,9.362000 9.703000,9.044000 9.667000,8.727000 9.620000,8.412000 9.563000,8.098000 9.418000,7.477000 9.233000,6.866000 9.008000,6.269000 8.881000,5.976000 8.745000,5.688000 8.599000,5.404000 8.444000,5.125000 8.280000,4.851000 8.107000,4.583000 7.925000,4.321000 7.537000,3.815000 7.330000,3.571000 7.116000,3.335000 6.665000,2.884000 6.429000,2.670000 6.185000,2.463000 5.935000,2.265000 5.417000,1.893000 5.149000,1.720000 4.875000,1.556000 4.596000,1.401000 4.312000,1.255000 4.024000,1.119000 3.731000,0.992000 3.134000,0.767000 2.523000,0.582000 1.902000,0.437000 1.588000,0.380000 1.273000,0.333000 0.956000,0.297000 0.638000,0.271000 0.319000,0.255000 0.000000,0.250000 z%22 /></g><g id=%22C20%22 data-name=%22straight__PSUEVWF63OVVFWYH7754JUXYRYF4JUBOT3G3MOEPF7IRECC327UA%22><path class=%22layer_1_0%22 d=%22M 0.000000,-1.250000 38.250000,-1.250000 38.250000,1.250000 0.000000,1.250000 z%22 /><path class=%22layer_2_0%22 d=%22M 0.000000,-0.250000 38.250000,-0.250000 38.250000,0.250000 0.000000,0.250000 z%22 /></g><g id=%22C21%22 data-name=%22straight__TKKZJRB2XVKDKK77CO2LLE3KWPIRITMYXIUQRI3EE3RAX5P3MSXA%22><path class=%22layer_1_0%22 d=%22M 0.000000,-1.250000 60.644000,-1.250000 60.644000,1.250000 0.000000,1.250000 z%22 /><path class=%22layer_2_0%22 d=%22M 0.000000,-0.250000 60.644000,-0.250000 60.644000,0.250000 0.000000,0.250000 z%22 /></g><g id=%22C22%22 data-name=%22straight__GO6R4ISALJFM72OWNBT4NZU56Y2GCX6BANCCWEPVFIGGPWSO3KRQ%22><path class=%22layer_1_0%22 d=%22M 0.000000,-1.250000 42.750000,-1.250000 42.750000,1.250000 0.000000,1.250000 z%22 /><path class=%22layer_2_0%22 d=%22M 0.000000,-0.250000 42.750000,-0.250000 42.750000,0.250000 0.000000,0.250000 z%22 /></g><g id=%22C23%22 data-name=%22straight__HMX3SZBOGS5KIDU7HN7KIPPPLWWPFUVF3XRV4WP3BEUMGR76PC2Q%22><path class=%22layer_1_0%22 d=%22M 0.000000,-1.250000 65.144000,-1.250000 65.144000,1.250000 0.000000,1.250000 z%22 /><path class=%22layer_2_0%22 d=%22M 0.000000,-0.250000 65.144000,-0.250000 65.144000,0.250000 0.000000,0.250000 z%22 /></g><g id=%22C24%22 data-name=%22straight__YFFPEGOYIRSBJXXNOP5RDY6NXRUA3OSCP4INTSVH2Y5NZVEVWD7Q%22><path class=%22layer_1_0%22 d=%22M 0.000000,-1.250000 47.250000,-1.250000 47.250000,1.250000 0.000000,1.250000 z%22 /><path class=%22layer_2_0%22 d=%22M 0.000000,-0.250000 47.250000,-0.250000 47.250000,0.250000 0.000000,0.250000 z%22 /></g><g id=%22C25%22 data-name=%22straight__PXXZAW37Q6E67I72QFV2F2QTPXACBVQX6TDU5X2ZW5AOJL7NK6WQ%22><path class=%22layer_1_0%22 d=%22M 0.000000,-1.250000 69.644000,-1.250000 69.644000,1.250000 0.000000,1.250000 z%22 /><path class=%22layer_2_0%22 d=%22M 0.000000,-0.250000 69.644000,-0.250000 69.644000,0.250000 0.000000,0.250000 z%22 /></g><g id=%22C26%22 data-name=%22straight__FBBCXPPGUW7QZP6KGTQPM7JJNQGM7TAYTW3VQZFM6I2H7R2KTKMQ%22><path class=%22layer_1_0%22 d=%22M 0.000000,-1.250000 51.750000,-1.250000 51.750000,1.250000 0.000000,1.250000 z%22 /><path class=%22layer_2_0%22 d=%22M 0.000000,-0.250000 51.750000,-0.250000 51.750000,0.250000 0.000000,0.250000 z%22 /></g><g id=%22C27%22 data-name=%22straight__HCDUDNHUPSHPHOBE4UO7ZAJCEFDJSCQTJNYYGTR35YDE6R6J55FQ%22><path class=%22layer_1_0%22 d=%22M 0.000000,-1.250000 74.144000,-1.250000 74.144000,1.250000 0.000000,1.250000 z%22 /><path class=%22layer_2_0%22 d=%22M 0.000000,-0.250000 74.144000,-0.250000 74.144000,0.250000 0.000000,0.250000 z%22 /></g><g id=%22C28%22 data-name=%22straight__DWO4XD3GWAG3P3UQ7A455OK3TDHP2LL53VL6JYSIEVBTMSOUG6NA%22><path class=%22layer_1_0%22 d=%22M 0.000000,-1.250000 56.250000,-1.250000 56.250000,1.250000 0.000000,1.250000 z%22 /><path class=%22layer_2_0%22 d=%22M 0.000000,-0.250000 56.250000,-0.250000 56.250000,0.250000 0.000000,0.250000 z%22 /></g><g id=%22C29%22 data-name=%22straight__ADQ6B3ORYVB5J6JMZ3QWHGZZYUBYWXL46IBRTSV7FYCNTBIEJBYA%22><path class=%22layer_1_0%22 d=%22M 0.000000,-1.250000 78.644000,-1.250000 78.644000,1.250000 0.000000,1.250000 z%22 /><path class=%22layer_2_0%22 d=%22M 0.000000,-0.250000 78.644000,-0.250000 78.644000,0.250000 0.000000,0.250000 z%22 /></g><g id=%22C3%22 data-name=%22straight__O7PE35CYVU3EXJIDEYTOHQUHYLSSMNQ4OOODNENSVYJ76TTWNCVA%22><path class=%22layer_1_0%22 d=%22M 0.000000,-1.250000 1.197000,-1.250000 1.197000,1.250000 0.000000,1.250000 z%22 /><path class=%22layer_2_0%22 d=%22M 0.000000,-0.250000 1.197000,-0.250000 1.197000,0.250000 0.000000,0.250000 z%22 /></g><g id=%22C30%22 data-name=%22straight__3D345VUXBEYN3C6YAWJ6RSHOA6DJEDRE4BKO6VCCFVXDIWPPBPOA%22><path class=%22layer_1_0%22 d=%22M 0.000000,-1.250000 60.750000,-1.250000 60.750000,1.250000 0.000000,1.250000 z%22 /><path class=%22layer_2_0%22 d=%22M 0.000000,-0.250000 60.750000,-0.250000 60.750000,0.250000 0.000000,0.250000 z%22 /></g><g id=%22C31%22 data-name=%22straight__RFBNEIWL44JTRH7DURPHLANSPS2CI62DWFZOHBXM2H5P6RCO45YQ%22><path class=%22layer_1_0%22 d=%22M 0.000000,-1.250000 83.144000,-1.250000 83.144000,1.250000 0.000000,1.250000 z%22 /><path class=%22layer_2_0%22 d=%22M 0.000000,-0.250000 83.144000,-0.250000 83.144000,0.250000 0.000000,0.250000 z%22 /></g><g id=%22C32%22 data-name=%22straight__W5Z2QEMR6RPQQLP23NYXFW5VW7JPT5WWGY26FC57OODPRZESVI5Q%22><path class=%22layer_1_0%22 d=%22M 0.000000,-1.250000 65.250000,-1.250000 65.250000,1.250000 0.000000,1.250000 z%22 /><path class=%22layer_2_0%22 d=%22M 0.000000,-0.250000 65.250000,-0.250000 65.250000,0.250000 0.000000,0.250000 z%22 /></g><g id=%22C33%22 data-name=%22straight__WESB36POVBKKYGNIXALAWJXOIP2CROGNEULX4DSUTJI6ZB4Y2Y4A%22><path class=%22layer_1_0%22 d=%22M 0.000000,-1.250000 87.644000,-1.250000 87.644000,1.250000 0.000000,1.250000 z%22 /><path class=%22layer_2_0%22 d=%22M 0.000000,-0.250000 87.644000,-0.250000 87.644000,0.250000 0.000000,0.250000 z%22 /></g><g id=%22C34%22 data-name=%22straight__KHXVDHVP3KJYRYPHC2RZQPYNNZUD2ZRCJ6KOAQVDIH7HMCITVGQA%22><path class=%22layer_1_0%22 d=%22M 0.000000,-1.250000 69.750000,-1.250000 69.750000,1.250000 0.000000,1.250000 z%22 /><path class=%22layer_2_0%22 d=%22M 0.000000,-0.250000 69.750000,-0.250000 69.750000,0.250000 0.000000,0.250000 z%22 /></g><g id=%22C35%22 data-name=%22straight__F3GBRKIQ6TLUNRR3C22LPWO6LCQI5TVBBEQLC3PPRNDLJM32K3VA%22><path class=%22layer_1_0%22 d=%22M 0.000000,-1.250000 92.144000,-1.250000 92.144000,1.250000 0.000000,1.250000 z%22 /><path class=%22layer_2_0%22 d=%22M 0.000000,-0.250000 92.144000,-0.250000 92.144000,0.250000 0.000000,0.250000 z%22 /></g><g id=%22C36%22 data-name=%22straight__X76U6RN6I7WF5UDW42TJNBTEKYT5F6RXVX5DIOOPPA7YQNLRNH5Q%22><path class=%22layer_1_0%22 d=%22M 0.000000,-1.250000 74.250000,-1.250000 74.250000,1.250000 0.000000,1.250000 z%22 /><path class=%22layer_2_0%22 d=%22M 0.000000,-0.250000 74.250000,-0.250000 74.250000,0.250000 0.000000,0.250000 z%22 /></g><g id=%22C37%22 data-name=%22straight__752E77WPP5H7PCBJFWATCN767ER727KNKKOFO2AWRLBGF7QLED4Q%22><path class=%22layer_1_0%22 d=%22M 0.000000,-1.250000 96.644000,-1.250000 96.644000,1.250000 0.000000,1.250000 z%22 /><path class=%22layer_2_0%22 d=%22M 0.000000,-0.250000 96.644000,-0.250000 96.644000,0.250000 0.000000,0.250000 z%22 /></g><g id=%22C38%22 data-name=%22straight__FE2NQV27UXIUF6VDBI3W7XOUYCKT2YHPQC4ODE3KCL2WJWWS344Q%22><path class=%22layer_1_0%22 d=%22M 0.000000,-1.250000 78.750000,-1.250000 78.750000,1.250000 0.000000,1.250000 z%22 /><path class=%22layer_2_0%22 d=%22M 0.000000,-0.250000 78.750000,-0.250000 78.750000,0.250000 0.000000,0.250000 z%22 /></g><g id=%22C39%22 data-name=%22straight__72T35XYPBQMFDFVOYILCM3UOTLZCC7OHU3S22IBTBO2XMDBGDWDA%22><path class=%22layer_1_0%22 d=%22M 0.000000,-1.250000 101.144000,-1.250000 101.144000,1.250000 0.000000,1.250000 z%22 /><path class=%22layer_2_0%22 d=%22M 0.000000,-0.250000 101.144000,-0.250000 101.144000,0.250000 0.000000,0.250000 z%22 /></g><g id=%22C4%22 data-name=%22straight__PYMFOL4CHURB4G5AV7A47ZYKRKLO3S4GWSHQJFAB7DO4GELNLORA%22><path class=%22layer_1_0%22 d=%22M 0.000000,-1.250000 2.250000,-1.250000 2.250000,1.250000 0.000000,1.250000 z%22 /><path class=%22layer_2_0%22 d=%22M 0.000000,-0.250000 2.250000,-0.250000 2.250000,0.250000 0.000000,0.250000 z%22 /></g><g id=%22C40%22 data-name=%22straight__IB4K7NEA65W3L6QSEVEOAJY6O7GPWCGK257B5LQ436KZUTDSMNCQ%22><path class=%22layer_1_0%22 d=%22M 0.000000,-1.250000 83.250000,-1.250000 83.250000,1.250000 0.000000,1.250000 z%22 /><path class=%22layer_2_0%22 d=%22M 0.000000,-0.250000 83.250000,-0.250000 83.250000,0.250000 0.000000,0.250000 z%22 /></g><g id=%22C41%22 data-name=%22straight__LN532GXNFG46SBIU7PELT7DJZMTPV3BFVLFLNG4LMJUE7HDPU54Q%22><path class=%22layer_1_0%22 d=%22M 0.000000,-1.250000 105.644000,-1.250000 105.644000,1.250000 0.000000,1.250000 z%22 /><path class=%22layer_2_0%22 d=%22M 0.000000,-0.250000 105.644000,-0.250000 105.644000,0.250000 0.000000,0.250000 z%22 /></g><g id=%22C42%22 data-name=%22straight__UVMBGDLLTZPNQ7UQOTKAVPQPOUMJT47U5LF6GQ37T4QGGH576DKA%22><path class=%22layer_1_0%22 d=%22M 0.000000,-1.250000 87.750000,-1.250000 87.750000,1.250000 0.000000,1.250000 z%22 /><path class=%22layer_2_0%22 d=%22M 0.000000,-0.250000 87.750000,-0.250000 87.750000,0.250000 0.000000,0.250000 z%22 /></g><g id=%22C43%22 data-name=%22straight__EW5EKVPFB35TT5OXAY2Y7OGBQNWILOICZIGCOXQ3PHBPOCP4UMGA%22><path class=%22layer_1_0%22 d=%22M 0.000000,-1.250000 110.144000,-1.250000 110.144000,1.250000 0.000000,1.250000 z%22 /><path class=%22layer_2_0%22 d=%22M 0.000000,-0.250000 110.144000,-0.250000 110.144000,0.250000 0.000000,0.250000 z%22 /></g><g id=%22C44%22 data-name=%22straight__EOEECBH4BWZ6REP6GW4JPJYD4FOOBXSKEXNM5QZQYFFV56TNEC2Q%22><path class=%22layer_1_0%22 d=%22M 0.000000,-1.250000 92.250000,-1.250000 92.250000,1.250000 0.000000,1.250000 z%22 /><path class=%22layer_2_0%22 d=%22M 0.000000,-0.250000 92.250000,-0.250000 92.250000,0.250000 0.000000,0.250000 z%22 /></g><g id=%22C45%22 data-name=%22straight__T5UHDCRVYMZLC6KEQFVOFODW6UG5NGHYNT3CJ4BUX4QOTP6BZD7Q%22><path class=%22layer_1_0%22 d=%22M 0.000000,-1.250000 114.644000,-1.250000 114.644000,1.250000 0.000000,1.250000 z%22 /><path class=%22layer_2_0%22 d=%22M 0.000000,-0.250000 114.644000,-0.250000 114.644000,0.250000 0.000000,0.250000 z%22 /></g><g id=%22C46%22 data-name=%22straight__CP25TI6VNCREGCZFVGBP2CI4JPPCEY5DRHAZYYPYJDRHFTTAUWPQ%22><path class=%22layer_1_0%22 d=%22M 0.000000,-1.250000 96.750000,-1.250000 96.750000,1.250000 0.000000,1.250000 z%22 /><path class=%22layer_2_0%22 d=%22M 0.000000,-0.250000 96.750000,-0.250000 96.750000,0.250000 0.000000,0.250000 z%22 /></g><g id=%22C47%22 data-name=%22straight__MKVYZNZIQWI7PXL7VMFN3EITO7SQDIXTSAYKNPTCX72UYC5P46CQ%22><path class=%22layer_1_0%22 d=%22M 0.000000,-1.250000 119.144000,-1.250000 119.144000,1.250000 0.000000,1.250000 z%22 /><path class=%22layer_2_0%22 d=%22M 0.000000,-0.250000 119.144000,-0.250000 119.144000,0.250000 0.000000,0.250000 z%22 /></g><g id=%22C48%22 data-name=%22straight__E6FSZ47SK4HB7WSILGGETO5UWTXUBNXJPZJKGZ77I5HYAWT7YLVQ%22><path class=%22layer_1_0%22 d=%22M 0.000000,-1.250000 101.250000,-1.250000 101.250000,1.250000 0.000000,1.250000 z%22 /><path class=%22layer_2_0%22 d=%22M 0.000000,-0.250000 101.250000,-0.250000 101.250000,0.250000 0.000000,0.250000 z%22 /></g><g id=%22C49%22 data-name=%22straight__KVUYX2EFBCKKJJOI7JGVC73NJEU4WBYKVTP53QK5IC2WCYTBR77A%22><path class=%22layer_1_0%22 d=%22M 0.000000,-1.250000 123.644000,-1.250000 123.644000,1.250000 0.000000,1.250000 z%22 /><path class=%22layer_2_0%22 d=%22M 0.000000,-0.250000 123.644000,-0.250000 123.644000,0.250000 0.000000,0.250000 z%22 /></g><g id=%22C5%22 data-name=%22straight__GP5KB3WCROQBMQXQRTDA4MYNLGPKB7A4ZBMXMG3PRVUNIB2QBF7Q%22><path class=%22layer_1_0%22 d=%22M 0.000000,-1.250000 24.644000,-1.250000 24.644000,1.250000 0.000000,1.250000 z%22 /><path class=%22layer_2_0%22 d=%22M 0.000000,-0.250000 24.644000,-0.250000 24.644000,0.250000 0.000000,0.250000 z%22 /></g><g id=%22C50%22 data-name=%22straight__Q37VE6ZIIXFXKKLKJTRAJB4BDSN7HMIGBQHER5UBEOYVLYZBEIFA%22><path class=%22layer_1_0%22 d=%22M 0.000000,-1.250000 105.750000,-1.250000 105.750000,1.250000 0.000000,1.250000 z%22 /><path class=%22layer_2_0%22 d=%22M 0.000000,-0.250000 105.750000,-0.250000 105.750000,0.250000 0.000000,0.250000 z%22 /></g><g id=%22C51%22 data-name=%22straight__KFHEVNZEUDCTBIIMSG6ML3YCDB6EEMP4W57ODCVWE6VTSGKMF4WA%22><path class=%22layer_1_0%22 d=%22M 0.000000,-1.250000 128.144000,-1.250000 128.144000,1.250000 0.000000,1.250000 z%22 /><path class=%22layer_2_0%22 d=%22M 0.000000,-0.250000 128.144000,-0.250000 128.144000,0.250000 0.000000,0.250000 z%22 /></g><g id=%22C52%22 data-name=%22straight__ZYXTY2U47ZUOIUYAHXR45UJBAKYKJPL7OHC2XBYXNLOS2EXAAOEA%22><path class=%22layer_1_0%22 d=%22M 0.000000,-1.250000 110.250000,-1.250000 110.250000,1.250000 0.000000,1.250000 z%22 /><path class=%22layer_2_0%22 d=%22M 0.000000,-0.250000 110.250000,-0.250000 110.250000,0.250000 0.000000,0.250000 z%22 /></g><g id=%22C53%22 data-name=%22straight__RUOD7NGDG2WMNUX4PE7R3GDAW55ECVGG26SXRRX64O6UGGH4BKMA%22><path class=%22layer_1_0%22 d=%22M 0.000000,-1.250000 132.644000,-1.250000 132.644000,1.250000 0.000000,1.250000 z%22 /><path class=%22layer_2_0%22 d=%22M 0.000000,-0.250000 132.644000,-0.250000 132.644000,0.250000 0.000000,0.250000 z%22 /></g><g id=%22C54%22 data-name=%22straight__DXMNEA5WRMBRAIPYTTKT74GA6ZSYCLAAVYWUH7VF7POTXBQH56SQ%22><path class=%22layer_1_0%22 d=%22M 0.000000,-1.250000 114.750000,-1.250000 114.750000,1.250000 0.000000,1.250000 z%22 /><path class=%22layer_2_0%22 d=%22M 0.000000,-0.250000 114.750000,-0.250000 114.750000,0.250000 0.000000,0.250000 z%22 /></g><g id=%22C55%22 data-name=%22straight__IJCFWKWE4WVMQHAVCMMWERH7NITN24EGC26FQDMB7QXDCLDSTYPQ%22><path class=%22layer_1_0%22 d=%22M 0.000000,-1.250000 137.144000,-1.250000 137.144000,1.250000 0.000000,1.250000 z%22 /><path class=%22layer_2_0%22 d=%22M 0.000000,-0.250000 137.144000,-0.250000 137.144000,0.250000 0.000000,0.250000 z%22 /></g><g id=%22C56%22 data-name=%22straight__ABMDJL4DSZE2TNVLDVBR7RXTXBE3NDUDZ6HIYO2OMS2YEGL5AOJA%22><path class=%22layer_1_0%22 d=%22M 0.000000,-1.250000 119.250000,-1.250000 119.250000,1.250000 0.000000,1.250000 z%22 /><path class=%22layer_2_0%22 d=%22M 0.000000,-0.250000 119.250000,-0.250000 119.250000,0.250000 0.000000,0.250000 z%22 /></g><g id=%22C57%22 data-name=%22straight__I5Z7WXULGDC6IGKK26YT7SKDFW2JJAW25NR7VB3SL7IDOAKTCNOA%22><path class=%22layer_1_0%22 d=%22M 0.000000,-1.250000 141.644000,-1.250000 141.644000,1.250000 0.000000,1.250000 z%22 /><path class=%22layer_2_0%22 d=%22M 0.000000,-0.250000 141.644000,-0.250000 141.644000,0.250000 0.000000,0.250000 z%22 /></g><g id=%22C58%22 data-name=%22straight__ZYKBX473MPIFGEEZALQDZPGRXOJOU4ZOOTIUI5XGGE3KKMNVRF3Q%22><path class=%22layer_1_0%22 d=%22M 0.000000,-1.250000 123.750000,-1.250000 123.750000,1.250000 0.000000,1.250000 z%22 /><path class=%22layer_2_0%22 d=%22M 0.000000,-0.250000 123.750000,-0.250000 123.750000,0.250000 0.000000,0.250000 z%22 /></g><g id=%22C59%22 data-name=%22straight__ZN7OY7VMX2A7P7FSIORUKRJI4OOPEB54ZKEBN52BAWW2MFS3VUFQ%22><path class=%22layer_1_0%22 d=%22M 0.000000,-1.250000 146.144000,-1.250000 146.144000,1.250000 0.000000,1.250000 z%22 /><path class=%22layer_2_0%22 d=%22M 0.000000,-0.250000 146.144000,-0.250000 146.144000,0.250000 0.000000,0.250000 z%22 /></g><g id=%22C6%22 data-name=%22straight__LEBV5LPJGBQQGLVM4B6FK63BATZYEI4FDTGYQ6VEBQSK644OCQZQ%22><path class=%22layer_1_0%22 d=%22M 0.000000,-1.250000 6.750000,-1.250000 6.750000,1.250000 0.000000,1.250000 z%22 /><path class=%22layer_2_0%22 d=%22M 0.000000,-0.250000 6.750000,-0.250000 6.750000,0.250000 0.000000,0.250000 z%22 /></g><g id=%22C60%22 data-name=%22straight__EF4D3PUVPCDVPLWUUS3LYB7U5SJO7M7UFNOZ2JNEBC6BWXYQUNIA%22><path class=%22layer_1_0%22 d=%22M 0.000000,-1.250000 128.250000,-1.250000 128.250000,1.250000 0.000000,1.250000 z%22 /><path class=%22layer_2_0%22 d=%22M 0.000000,-0.250000 128.250000,-0.250000 128.250000,0.250000 0.000000,0.250000 z%22 /></g><g id=%22C61%22 data-name=%22straight__7LX3CC2Q24NHQYJH6WEW6SVQVUV5VF3VEFZKGWIOEFKQI3CC7GBA%22><path class=%22layer_1_0%22 d=%22M 0.000000,-1.250000 150.644000,-1.250000 150.644000,1.250000 0.000000,1.250000 z%22 /><path class=%22layer_2_0%22 d=%22M 0.000000,-0.250000 150.644000,-0.250000 150.644000,0.250000 0.000000,0.250000 z%22 /></g><g id=%22C62%22 data-name=%22straight__KS6HEALCLH3W7NUTJ3A3IXD74ZSG6P3X2ANHHEOKG6U4R6DLKFFA%22><path class=%22layer_1_0%22 d=%22M 0.000000,-1.250000 132.750000,-1.250000 132.750000,1.250000 0.000000,1.250000 z%22 /><path class=%22layer_2_0%22 d=%22M 0.000000,-0.250000 132.750000,-0.250000 132.750000,0.250000 0.000000,0.250000 z%22 /></g><g id=%22C63%22 data-name=%22straight__42SKREKARP26DYRJ7QEJZLENRYHGW6PHLVSMODJCBNQNE7GPIDCA%22><path class=%22layer_1_0%22 d=%22M 0.000000,-1.250000 155.144000,-1.250000 155.144000,1.250000 0.000000,1.250000 z%22 /><path class=%22layer_2_0%22 d=%22M 0.000000,-0.250000 155.144000,-0.250000 155.144000,0.250000 0.000000,0.250000 z%22 /></g><g id=%22C64%22 data-name=%22straight__G2J5OMGNUORMECYBTOMBDCJWMAODYIOXZEEW3RNKEBADGTUVGDRQ%22><path class=%22layer_1_0%22 d=%22M 0.000000,-1.250000 137.250000,-1.250000 137.250000,1.250000 0.000000,1.250000 z%22 /><path class=%22layer_2_0%22 d=%22M 0.000000,-0.250000 137.250000,-0.250000 137.250000,0.250000 0.000000,0.250000 z%22 /></g><g id=%22C65%22 data-name=%22straight__JZ7EKGKOKYYBOG5NDDRUYJXXBXMEL7YDSKNC63355LNQF6ZN2BIQ%22><path class=%22layer_1_0%22 d=%22M 0.000000,-1.250000 159.644000,-1.250000 159.644000,1.250000 0.000000,1.250000 z%22 /><path class=%22layer_2_0%22 d=%22M 0.000000,-0.250000 159.644000,-0.250000 159.644000,0.250000 0.000000,0.250000 z%22 /></g><g id=%22C66%22 data-name=%22straight__QRJXOUGLZ7ARFRTKOIFPB6NCOEUW6YIGSYQU52WMASW32LR6WECA%22><path class=%22layer_1_0%22 d=%22M 0.000000,-1.250000 141.750000,-1.250000 141.750000,1.250000 0.000000,1.250000 z%22 /><path class=%22layer_2_0%22 d=%22M 0.000000,-0.250000 141.750000,-0.250000 141.750000,0.250000 0.000000,0.250000 z%22 /></g><g id=%22C67%22 data-name=%22straight__TMMAHCDIOWRRXHFNPLGTWMJRZHWHE4RGUUHYILG4SUFGZV2TNW6A%22><path class=%22layer_1_0%22 d=%22M 0.000000,-1.250000 164.144000,-1.250000 164.144000,1.250000 0.000000,1.250000 z%22 /><path class=%22layer_2_0%22 d=%22M 0.000000,-0.250000 164.144000,-0.250000 164.144000,0.250000 0.000000,0.250000 z%22 /></g><g id=%22C68%22 data-name=%22straight__T6XF5RUJ73YKI3GP22CBAN6UJSAOMKLDXD7TWVYH44W5JL7E6FRA%22><path class=%22layer_1_0%22 d=%22M 0.000000,-1.250000 146.250000,-1.250000 146.250000,1.250000 0.000000,1.250000 z%22 /><path class=%22layer_2_0%22 d=%22M 0.000000,-0.250000 146.250000,-0.250000 146.250000,0.250000 0.000000,0.250000 z%22 /></g><g id=%22C69%22 data-name=%22straight__G4X6XODGNOOPQSBPW7EMOARWBQ5ZJHTRSDYNFXEJLRUQZAJHL5WQ%22><path class=%22layer_1_0%22 d=%22M 0.000000,-1.250000 168.644000,-1.250000 168.644000,1.250000 0.000000,1.250000 z%22 /><path class=%22layer_2_0%22 d=%22M 0.000000,-0.250000 168.644000,-0.250000 168.644000,0.250000 0.000000,0.250000 z%22 /></g><g id=%22C7%22 data-name=%22straight__OBF2TEEPUWMQWAASB7JIQMKYT2KQNFLHTDIZ5ARK56NA4CTSL2LA%22><path class=%22layer_1_0%22 d=%22M 0.000000,-1.250000 29.144000,-1.250000 29.144000,1.250000 0.000000,1.250000 z%22 /><path class=%22layer_2_0%22 d=%22M 0.000000,-0.250000 29.144000,-0.250000 29.144000,0.250000 0.000000,0.250000 z%22 /></g><g id=%22C70%22 data-name=%22straight__YIXU5SL72YDEZA4G546AEFIEDHCTCNFGRRC223SGVWTNNZBD6GJA%22><path class=%22layer_1_0%22 d=%22M 0.000000,-1.250000 150.750000,-1.250000 150.750000,1.250000 0.000000,1.250000 z%22 /><path class=%22layer_2_0%22 d=%22M 0.000000,-0.250000 150.750000,-0.250000 150.750000,0.250000 0.000000,0.250000 z%22 /></g><g id=%22C71%22 data-name=%22straight__SDI5EPNGV7N2TYBZUNBEN533BUBE2VHZ3JHWCUHBKYOIK2WIJ4RA%22><path class=%22layer_1_0%22 d=%22M 0.000000,-1.250000 173.144000,-1.250000 173.144000,1.250000 0.000000,1.250000 z%22 /><path class=%22layer_2_0%22 d=%22M 0.000000,-0.250000 173.144000,-0.250000 173.144000,0.250000 0.000000,0.250000 z%22 /></g><g id=%22C72%22 data-name=%22straight__2D2OTVGVX7QHQEMKTWCSVCAHPHBINC2FUP63PP7K3WVV4Y6EHNOA%22><path class=%22layer_1_0%22 d=%22M 0.000000,-1.250000 155.250000,-1.250000 155.250000,1.250000 0.000000,1.250000 z%22 /><path class=%22layer_2_0%22 d=%22M 0.000000,-0.250000 155.250000,-0.250000 155.250000,0.250000 0.000000,0.250000 z%22 /></g><g id=%22C73%22 data-name=%22straight__TKGZGGEYOJOPROYKVFMNZL6WWQQJ4PQUPOXY2PJPWLW5HIGIRMBA%22><path class=%22layer_1_0%22 d=%22M 0.000000,-1.250000 177.644000,-1.250000 177.644000,1.250000 0.000000,1.250000 z%22 /><path class=%22layer_2_0%22 d=%22M 0.000000,-0.250000 177.644000,-0.250000 177.644000,0.250000 0.000000,0.250000 z%22 /></g><g id=%22C74%22 data-name=%22straight__CZVZJVD7WHBSZIFRCJQNJOJRQX5YK4HQHN57V4AG5NFQWCIQQ34A%22><path class=%22layer_1_0%22 d=%22M 0.000000,-1.250000 159.750000,-1.250000 159.750000,1.250000 0.000000,1.250000 z%22 /><path class=%22layer_2_0%22 d=%22M 0.000000,-0.250000 159.750000,-0.250000 159.750000,0.250000 0.000000,0.250000 z%22 /></g><g id=%22C75%22 data-name=%22straight__6PIXOGPNMYF4Z72O2WNJPCOELB4IQAHX445WERXO3BY6OXQRJUWQ%22><path class=%22layer_1_0%22 d=%22M 0.000000,-1.250000 182.144000,-1.250000 182.144000,1.250000 0.000000,1.250000 z%22 /><path class=%22layer_2_0%22 d=%22M 0.000000,-0.250000 182.144000,-0.250000 182.144000,0.250000 0.000000,0.250000 z%22 /></g><g id=%22C76%22 data-name=%22straight__TIU2ZQGVEMNNPHRU2ICYOKQNNZ5R65DPRCJJNQIRT2MOUH6J3HOA%22><path class=%22layer_1_0%22 d=%22M 0.000000,-1.250000 164.250000,-1.250000 164.250000,1.250000 0.000000,1.250000 z%22 /><path class=%22layer_2_0%22 d=%22M 0.000000,-0.250000 164.250000,-0.250000 164.250000,0.250000 0.000000,0.250000 z%22 /></g><g id=%22C77%22 data-name=%22straight__MT4JMGUCP5KIILXBCHCIRVSE62LTAMQITVO42WRQT3NRMLXT2UCQ%22><path class=%22layer_1_0%22 d=%22M 0.000000,-1.250000 186.644000,-1.250000 186.644000,1.250000 0.000000,1.250000 z%22 /><path class=%22layer_2_0%22 d=%22M 0.000000,-0.250000 186.644000,-0.250000 186.644000,0.250000 0.000000,0.250000 z%22 /></g><g id=%22C78%22 data-name=%22straight__XJPDVWTTRK5SPZTEW2LA7HX5SYLOVZ5ZFAMHQ2WGYBXXZYVWIB3A%22><path class=%22layer_1_0%22 d=%22M 0.000000,-1.250000 168.750000,-1.250000 168.750000,1.250000 0.000000,1.250000 z%22 /><path class=%22layer_2_0%22 d=%22M 0.000000,-0.250000 168.750000,-0.250000 168.750000,0.250000 0.000000,0.250000 z%22 /></g><g id=%22C79%22 data-name=%22straight__P2R353YCLZFKVMBI3WAWFBMUK7U4B2MSK67GQC3HENLMZYJWJJEQ%22><path class=%22layer_1_0%22 d=%22M 0.000000,-1.250000 191.144000,-1.250000 191.144000,1.250000 0.000000,1.250000 z%22 /><path class=%22layer_2_0%22 d=%22M 0.000000,-0.250000 191.144000,-0.250000 191.144000,0.250000 0.000000,0.250000 z%22 /></g><g id=%22C8%22 data-name=%22straight__EEC4K5DFHKKZXMGU2IYKY65ZNWSTUOJSOVPLKXJHIHUXACPTCUNQ%22><path class=%22layer_1_0%22 d=%22M 0.000000,-1.250000 11.250000,-1.250000 11.250000,1.250000 0.000000,1.250000 z%22 /><path class=%22layer_2_0%22 d=%22M 0.000000,-0.250000 11.250000,-0.250000 11.250000,0.250000 0.000000,0.250000 z%22 /></g><g id=%22C80%22 data-name=%22straight__D2H6M7KOYSLRFM4OXMVRWVQVYNIDMFMYKSXUAED5BF72XHEWNUUQ%22><path class=%22layer_1_0%22 d=%22M 0.000000,-1.250000 173.250000,-1.250000 173.250000,1.250000 0.000000,1.250000 z%22 /><path class=%22layer_2_0%22 d=%22M 0.000000,-0.250000 173.250000,-0.250000 173.250000,0.250000 0.000000,0.250000 z%22 /></g><g id=%22C81%22 data-name=%22straight__QPPXBGUYBL46RVYMPPH5WMNRYLYY37ZU5O7ESEIS46VTLPYURH5A%22><path class=%22layer_1_0%22 d=%22M 0.000000,-1.250000 195.644000,-1.250000 195.644000,1.250000 0.000000,1.250000 z%22 /><path class=%22layer_2_0%22 d=%22M 0.000000,-0.250000 195.644000,-0.250000 195.644000,0.250000 0.000000,0.250000 z%22 /></g><g id=%22C82%22 data-name=%22straight__7QKZN6AF7Y5XLNDDORNWYWRHGHDOHP3K4IWYSUFYMPAOSOO7NNPA%22><path class=%22layer_1_0%22 d=%22M 0.000000,-1.250000 177.750000,-1.250000 177.750000,1.250000 0.000000,1.250000 z%22 /><path class=%22layer_2_0%22 d=%22M 0.000000,-0.250000 177.750000,-0.250000 177.750000,0.250000 0.000000,0.250000 z%22 /></g><g id=%22C83%22 data-name=%22straight__5IQLPQ3BWFYDQA36FLPBSMUJUVYGH67XFKLMF5NKCXMMVXDSALFQ%22><path class=%22layer_1_0%22 d=%22M 0.000000,-1.250000 200.144000,-1.250000 200.144000,1.250000 0.000000,1.250000 z%22 /><path class=%22layer_2_0%22 d=%22M 0.000000,-0.250000 200.144000,-0.250000 200.144000,0.250000 0.000000,0.250000 z%22 /></g><g id=%22C84%22 data-name=%22straight__UZPYU6TXK6UTLHEYHCMLRTQM7SATDOK7JHGM5GIFA2L5MDZAOLMQ%22><path class=%22layer_1_0%22 d=%22M 0.000000,-1.250000 182.250000,-1.250000 182.250000,1.250000 0.000000,1.250000 z%22 /><path class=%22layer_2_0%22 d=%22M 0.000000,-0.250000 182.250000,-0.250000 182.250000,0.250000 0.000000,0.250000 z%22 /></g><g id=%22C85%22 data-name=%22straight__XSSNADHBA2KLBWQRIBZ7GWXOLYR6GD27QGDRRPJ6WCBBPDK43VJQ%22><path class=%22layer_1_0%22 d=%22M 0.000000,-1.250000 204.644000,-1.250000 204.644000,1.250000 0.000000,1.250000 z%22 /><path class=%22layer_2_0%22 d=%22M 0.000000,-0.250000 204.644000,-0.250000 204.644000,0.250000 0.000000,0.250000 z%22 /></g><g id=%22C86%22 data-name=%22straight__GXGQG57GFNH6WAAFOCNXSIJWTOPSG6LZFJN7SGGGU76AH4Q6M23Q%22><path class=%22layer_1_0%22 d=%22M 0.000000,-1.250000 196.750000,-1.250000 196.750000,1.250000 0.000000,1.250000 z%22 /><path class=%22layer_2_0%22 d=%22M 0.000000,-0.250000 196.750000,-0.250000 196.750000,0.250000 0.000000,0.250000 z%22 /></g><g id=%22C9%22 data-name=%22straight__3C5C7Z2QPNC5ABVDF474PUCNVPYT5PXRWR2S3ADALHBSIHLC3Y4A%22><path class=%22layer_1_0%22 d=%22M 0.000000,-1.250000 33.644000,-1.250000 33.644000,1.250000 0.000000,1.250000 z%22 /><path class=%22layer_2_0%22 d=%22M 0.000000,-0.250000 33.644000,-0.250000 33.644000,0.250000 0.000000,0.250000 z%22 /></g></defs><g transform=%22scale(1 -1)%22><g id=%22C0%22 data-name=%22rectangular_spiral__VQK6YEVIFR7AO4BLDQQC2G7STBWGXCXWM5UOOWSFJIIRWMJVEF4Q%22><use transform=%22translate(104.500000 113.447000)%22 href=%22%23C1%22 /><use transform=%22translate(94.500000 123.447000) rotate(270.000000)%22 href=%22%23C2%22 /><use transform=%22translate(114.500000 103.447000) rotate(270.000000)%22 href=%22%23C3%22 /><use transform=%22translate(94.500000 124.644000) rotate(270.000000)%22 href=%22%23C3%22 /><use transform=%22translate(114.500000 102.250000) rotate(270.000000)%22 href=%22%23C1%22 /><use transform=%22translate(104.500000 134.644000) rotate(180.000000)%22 href=%22%23C2%22 /><use transform=%22translate(104.500000 92.250000) rotate(180.000000)%22 href=%22%23C4%22 /><use transform=%22translate(106.750000 134.644000) rotate(180.000000)%22 href=%22%23C4%22 /><use transform=%22translate(102.250000 92.250000) rotate(180.000000)%22 href=%22%23C1%22 /><use transform=%22translate(116.750000 124.644000) rotate(90.000000)%22 href=%22%23C2%22 /><use transform=%22translate(92.250000 102.250000) rotate(90.000000)%22 href=%22%23C5%22 /><use transform=%22translate(116.750000 100.000000) rotate(90.000000)%22 href=%22%23C5%22 /><use transform=%22translate(92.250000 126.894000) rotate(90.000000)%22 href=%22%23C1%22 /><use transform=%22translate(106.750000 90.000000)%22 href=%22%23C2%22 /><use transform=%22translate(102.250000 136.894000)%22 href=%22%23C6%22 /><use transform=%22translate(100.000000 90.000000)%22 href=%22%23C6%22 /><use transform=%22translate(109.000000 136.894000)%22 href=%22%23C1%22 /><use transform=%22translate(90.000000 100.000000) rotate(270.000000)%22 href=%22%23C2%22 /><use transform=%22translate(119.000000 126.894000) rotate(270.000000)%22 href=%22%23C7%22 /><use transform=%22translate(90.000000 129.144000) rotate(270.000000)%22 href=%22%23C7%22 /><use transform=%22translate(119.000000 97.750000) rotate(270.000000)%22 href=%22%23C1%22 /><use transform=%22translate(100.000000 139.144000) rotate(180.000000)%22 href=%22%23C2%22 /><use transform=%22translate(109.000000 87.750000) rotate(180.000000)%22 href=%22%23C8%22 /><use transform=%22translate(111.250000 139.144000) rotate(180.000000)%22 href=%22%23C8%22 /><use transform=%22translate(97.750000 87.750000) rotate(180.000000)%22 href=%22%23C1%22 /><use transform=%22translate(121.250000 129.144000) rotate(90.000000)%22 href=%22%23C2%22 /><use transform=%22translate(87.750000 97.750000) rotate(90.000000)%22 href=%22%23C9%22 /><use transform=%22translate(121.250000 95.500000) rotate(90.000000)%22 href=%22%23C9%22 /><use transform=%22translate(87.750000 131.394000) rotate(90.000000)%22 href=%22%23C1%22 /><use transform=%22translate(111.250000 85.500000)%22 href=%22%23C2%22 /><use transform=%22translate(97.750000 141.394000)%22 href=%22%23C10%22 /><use transform=%22translate(95.500000 85.500000)%22 href=%22%23C10%22 /><use transform=%22translate(113.500000 141.394000)%22 href=%22%23C1%22 /><use transform=%22translate(85.500000 95.500000) rotate(270.000000)%22 href=%22%23C2%22 /><use transform=%22translate(123.500000 131.394000) rotate(270.000000)%22 href=%22%23C11%22 /><use transform=%22translate(85.500000 133.644000) rotate(270.000000)%22 href=%22%23C11%22 /><use transform=%22translate(123.500000 93.250000) rotate(270.000000)%22 href=%22%23C1%22 /><use transform=%22translate(95.500000 143.644000) rotate(180.000000)%22 href=%22%23C2%22 /><use transform=%22translate(113.500000 83.250000) rotate(180.000000)%22 href=%22%23C12%22 /><use transform=%22translate(115.750000 143.644000) rotate(180.000000)%22 href=%22%23C12%22 /><use transform=%22translate(93.250000 83.250000) rotate(180.000000)%22 href=%22%23C1%22 /><use transform=%22translate(125.750000 133.644000) rotate(90.000000)%22 href=%22%23C2%22 /><use transform=%22translate(83.250000 93.250000) rotate(90.000000)%22 href=%22%23C13%22 /><use transform=%22translate(125.750000 91.000000) rotate(90.000000)%22 href=%22%23C13%22 /><use transform=%22translate(83.250000 135.894000) rotate(90.000000)%22 href=%22%23C1%22 /><use transform=%22translate(115.750000 81.000000)%22 href=%22%23C2%22 /><use transform=%22translate(93.250000 145.894000)%22 href=%22%23C14%22 /><use transform=%22translate(91.000000 81.000000)%22 href=%22%23C14%22 /><use transform=%22translate(118.000000 145.894000)%22 href=%22%23C1%22 /><use transform=%22translate(81.000000 91.000000) rotate(270.000000)%22 href=%22%23C2%22 /><use transform=%22translate(128.000000 135.894000) rotate(270.000000)%22 href=%22%23C15%22 /><use transform=%22translate(81.000000 138.144000) rotate(270.000000)%22 href=%22%23C15%22 /><use transform=%22translate(128.000000 88.750000) rotate(270.000000)%22 href=%22%23C1%22 /><use transform=%22translate(91.000000 148.144000) rotate(180.000000)%22 href=%22%23C2%22 /><use transform=%22translate(118.000000 78.750000) rotate(180.000000)%22 href=%22%23C16%22 /><use transform=%22translate(120.250000 148.144000) rotate(180.000000)%22 href=%22%23C16%22 /><use transform=%22translate(88.750000 78.750000) rotate(180.000000)%22 href=%22%23C1%22 /><use transform=%22translate(130.250000 138.144000) rotate(90.000000)%22 href=%22%23C2%22 /><use transform=%22translate(78.750000 88.750000) rotate(90.000000)%22 href=%22%23C17%22 /><use transform=%22translate(130.250000 86.500000) rotate(90.000000)%22 href=%22%23C17%22 /><use transform=%22translate(78.750000 140.394000) rotate(90.000000)%22 href=%22%23C1%22 /><use transform=%22translate(120.250000 76.500000)%22 href=%22%23C2%22 /><use transform=%22translate(88.750000 150.394000)%22 href=%22%23C18%22 /><use transform=%22translate(86.500000 76.500000)%22 href=%22%23C18%22 /><use transform=%22translate(122.500000 150.394000)%22 href=%22%23C1%22 /><use transform=%22translate(76.500000 86.500000) rotate(270.000000)%22 href=%22%23C2%22 /><use transform=%22translate(132.500000 140.394000) rotate(270.000000)%22 href=%22%23C19%22 /><use transform=%22translate(76.500000 142.644000) rotate(270.000000)%22 href=%22%23C19%22 /><use transform=%22translate(132.500000 84.250000) rotate(270.000000)%22 href=%22%23C1%22 /><use transform=%22translate(86.500000 152.644000) rotate(180.000000)%22 href=%22%23C2%22 /><use transform=%22translate(122.500000 74.250000) rotate(180.000000)%22 href=%22%23C20%22 /><use transform=%22translate(124.750000 152.644000) rotate(180.000000)%22 href=%22%23C20%22 /><use transform=%22translate(84.250000 74.250000) rotate(180.000000)%22 href=%22%23C1%22 /><use transform=%22translate(134.750000 142.644000) rotate(90.000000)%22 href=%22%23C2%22 /><use transform=%22translate(74.250000 84.250000) rotate(90.000000)%22 href=%22%23C21%22 /><use transform=%22translate(134.750000 82.000000) rotate(90.000000)%22 href=%22%23C21%22 /><use transform=%22translate(74.250000 144.894000) rotate(90.000000)%22 href=%22%23C1%22 /><use transform=%22translate(124.750000 72.000000)%22 href=%22%23C2%22 /><use transform=%22translate(84.250000 154.894000)%22 href=%22%23C22%22 /><use transform=%22translate(82.000000 72.000000)%22 href=%22%23C22%22 /><use transform=%22translate(127.000000 154.894000)%22 href=%22%23C1%22 /><use transform=%22translate(72.000000 82.000000) rotate(270.000000)%22 href=%22%23C2%22 /><use transform=%22translate(137.000000 144.894000) rotate(270.000000)%22 href=%22%23C23%22 /><use transform=%22translate(72.000000 147.144000) rotate(270.000000)%22 href=%22%23C23%22 /><use transform=%22translate(137.000000 79.750000) rotate(270.000000)%22 href=%22%23C1%22 /><use transform=%22translate(82.000000 157.144000) rotate(180.000000)%22 href=%22%23C2%22 /><use transform=%22translate(127.000000 69.750000) rotate(180.000000)%22 href=%22%23C24%22 /><use transform=%22translate(129.250000 157.144000) rotate(180.000000)%22 href=%22%23C24%22 /><use transform=%22translate(79.750000 69.750000) rotate(180.000000)%22 href=%22%23C1%22 /><use transform=%22translate(139.250000 147.144000) rotate(90.000000)%22 href=%22%23C2%22 /><use transform=%22translate(69.750000 79.750000) rotate(90.000000)%22 href=%22%23C25%22 /><use transform=%22translate(139.250000 77.500000) rotate(90.000000)%22 href=%22%23C25%22 /><use transform=%22translate(69.750000 149.394000) rotate(90.000000)%22 href=%22%23C1%22 /><use transform=%22translate(129.250000 67.500000)%22 href=%22%23C2%22 /><use transform=%22translate(79.750000 159.394000)%22 href=%22%23C26%22 /><use transform=%22translate(77.500000 67.500000)%22 href=%22%23C26%22 /><use transform=%22translate(131.500000 159.394000)%22 href=%22%23C1%22 /><use transform=%22translate(67.500000 77.500000) rotate(270.000000)%22 href=%22%23C2%22 /><use transform=%22translate(141.500000 149.394000) rotate(270.000000)%22 href=%22%23C27%22 /><use transform=%22translate(67.500000 151.644000) rotate(270.000000)%22 href=%22%23C27%22 /><use transform=%22translate(141.500000 75.250000) rotate(270.000000)%22 href=%22%23C1%22 /><use transform=%22translate(77.500000 161.644000) rotate(180.000000)%22 href=%22%23C2%22 /><use transform=%22translate(131.500000 65.250000) rotate(180.000000)%22 href=%22%23C28%22 /><use transform=%22translate(133.750000 161.644000) rotate(180.000000)%22 href=%22%23C28%22 /><use transform=%22translate(75.250000 65.250000) rotate(180.000000)%22 href=%22%23C1%22 /><use transform=%22translate(143.750000 151.644000) rotate(90.000000)%22 href=%22%23C2%22 /><use transform=%22translate(65.250000 75.250000) rotate(90.000000)%22 href=%22%23C29%22 /><use transform=%22translate(143.750000 73.000000) rotate(90.000000)%22 href=%22%23C29%22 /><use transform=%22translate(65.250000 153.894000) rotate(90.000000)%22 href=%22%23C1%22 /><use transform=%22translate(133.750000 63.000000)%22 href=%22%23C2%22 /><use transform=%22translate(75.250000 163.894000)%22 href=%22%23C30%22 /><use transform=%22translate(73.000000 63.000000)%22 href=%22%23C30%22 /><use transform=%22translate(136.000000 163.894000)%22 href=%22%23C1%22 /><use transform=%22translate(63.000000 73.000000) rotate(270.000000)%22 href=%22%23C2%22 /><use transform=%22translate(146.000000 153.894000) rotate(270.000000)%22 href=%22%23C31%22 /><use transform=%22translate(63.000000 156.144000) rotate(270.000000)%22 href=%22%23C31%22 /><use transform=%22translate(146.000000 70.750000) rotate(270.000000)%22 href=%22%23C1%22 /><use transform=%22translate(73.000000 166.144000) rotate(180.000000)%22 href=%22%23C2%22 /><use transform=%22translate(136.000000 60.750000) rotate(180.000000)%22 href=%22%23C32%22 /><use transform=%22translate(138.250000 166.144000) rotate(180.000000)%22 href=%22%23C32%22 /><use transform=%22translate(70.750000 60.750000) rotate(180.000000)%22 href=%22%23C1%22 /><use transform=%22translate(148.250000 156.144000) rotate(90.000000)%22 href=%22%23C2%22 /><use transform=%22translate(60.750000 70.750000) rotate(90.000000)%22 href=%22%23C33%22 /><use transform=%22translate(148.250000 68.500000) rotate(90.000000)%22 href=%22%23C33%22 /><use transform=%22translate(60.750000 158.394000) rotate(90.000000)%22 href=%22%23C1%22 /><use transform=%22translate(138.250000 58.500000)%22 href=%22%23C2%22 /><use transform=%22translate(70.750000 168.394000)%22 href=%22%23C34%22 /><use transform=%22translate(68.500000 58.500000)%22 href=%22%23C34%22 /><use transform=%22translate(140.500000 168.394000)%22 href=%22%23C1%22 /><use transform=%22translate(58.500000 68.500000) rotate(270.000000)%22 href=%22%23C2%22 /><use transform=%22translate(150.500000 158.394000) rotate(270.000000)%22 href=%22%23C35%22 /><use transform=%22translate(58.500000 160.644000) rotate(270.000000)%22 href=%22%23C35%22 /><use transform=%22translate(150.500000 66.250000) rotate(270.000000)%22 href=%22%23C1%22 /><use transform=%22translate(68.500000 170.644000) rotate(180.000000)%22 href=%22%23C2%22 /><use transform=%22translate(140.500000 56.250000) rotate(180.000000)%22 href=%22%23C36%22 /><use transform=%22translate(142.750000 170.644000) rotate(180.000000)%22 href=%22%23C36%22 /><use transform=%22translate(66.250000 56.250000) rotate(180.000000)%22 href=%22%23C1%22 /><use transform=%22translate(152.750000 160.644000) rotate(90.000000)%22 href=%22%23C2%22 /><use transform=%22translate(56.250000 66.250000) rotate(90.000000)%22 href=%22%23C37%22 /><use transform=%22translate(152.750000 64.000000) rotate(90.000000)%22 href=%22%23C37%22 /><use transform=%22translate(56.250000 162.894000) rotate(90.000000)%22 href=%22%23C1%22 /><use transform=%22translate(142.750000 54.000000)%22 href=%22%23C2%22 /><use transform=%22translate(66.250000 172.894000)%22 href=%22%23C38%22 /><use transform=%22translate(64.000000 54.000000)%22 href=%22%23C38%22 /><use transform=%22translate(145.000000 172.894000)%22 href=%22%23C1%22 /><use transform=%22translate(54.000000 64.000000) rotate(270.000000)%22 href=%22%23C2%22 /><use transform=%22translate(155.000000 162.894000) rotate(270.000000)%22 href=%22%23C39%22 /><use transform=%22translate(54.000000 165.144000) rotate(270.000000)%22 href=%22%23C39%22 /><use transform=%22translate(155.000000 61.750000) rotate(270.000000)%22 href=%22%23C1%22 /><use transform=%22translate(64.000000 175.144000) rotate(180.000000)%22 href=%22%23C2%22 /><use transform=%22translate(145.000000 51.750000) rotate(180.000000)%22 href=%22%23C40%22 /><use transform=%22translate(147.250000 175.144000) rotate(180.000000)%22 href=%22%23C40%22 /><use transform=%22translate(61.750000 51.750000) rotate(180.000000)%22 href=%22%23C1%22 /><use transform=%22translate(157.250000 165.144000) rotate(90.000000)%22 href=%22%23C2%22 /><use transform=%22translate(51.750000 61.750000) rotate(90.000000)%22 href=%22%23C41%22 /><use transform=%22translate(157.250000 59.500000) rotate(90.000000)%22 href=%22%23C41%22 /><use transform=%22translate(51.750000 167.394000) rotate(90.000000)%22 href=%22%23C1%22 /><use transform=%22translate(147.250000 49.500000)%22 href=%22%23C2%22 /><use transform=%22translate(61.750000 177.394000)%22 href=%22%23C42%22 /><use transform=%22translate(59.500000 49.500000)%22 href=%22%23C42%22 /><use transform=%22translate(149.500000 177.394000)%22 href=%22%23C1%22 /><use transform=%22translate(49.500000 59.500000) rotate(270.000000)%22 href=%22%23C2%22 /><use transform=%22translate(159.500000 167.394000) rotate(270.000000)%22 href=%22%23C43%22 /><use transform=%22translate(49.500000 169.644000) rotate(270.000000)%22 href=%22%23C43%22 /><use transform=%22translate(159.500000 57.250000) rotate(270.000000)%22 href=%22%23C1%22 /><use transform=%22translate(59.500000 179.644000) rotate(180.000000)%22 href=%22%23C2%22 /><use transform=%22translate(149.500000 47.250000) rotate(180.000000)%22 href=%22%23C44%22 /><use transform=%22translate(151.750000 179.644000) rotate(180.000000)%22 href=%22%23C44%22 /><use transform=%22translate(57.250000 47.250000) rotate(180.000000)%22 href=%22%23C1%22 /><use transform=%22translate(161.750000 169.644000) rotate(90.000000)%22 href=%22%23C2%22 /><use transform=%22translate(47.250000 57.250000) rotate(90.000000)%22 href=%22%23C45%22 /><use transform=%22translate(161.750000 55.000000) rotate(90.000000)%22 href=%22%23C45%22 /><use transform=%22translate(47.250000 171.894000) rotate(90.000000)%22 href=%22%23C1%22 /><use transform=%22translate(151.750000 45.000000)%22 href=%22%23C2%22 /><use transform=%22translate(57.250000 181.894000)%22 href=%22%23C46%22 /><use transform=%22translate(55.000000 45.000000)%22 href=%22%23C46%22 /><use transform=%22translate(154.000000 181.894000)%22 href=%22%23C1%22 /><use transform=%22translate(45.000000 55.000000) rotate(270.000000)%22 href=%22%23C2%22 /><use transform=%22translate(164.000000 171.894000) rotate(270.000000)%22 href=%22%23C47%22 /><use transform=%22translate(45.000000 174.144000) rotate(270.000000)%22 href=%22%23C47%22 /><use transform=%22translate(164.000000 52.750000) rotate(270.000000)%22 href=%22%23C1%22 /><use transform=%22translate(55.000000 184.144000) rotate(180.000000)%22 href=%22%23C2%22 /><use transform=%22translate(154.000000 42.750000) rotate(180.000000)%22 href=%22%23C48%22 /><use transform=%22translate(156.250000 184.144000) rotate(180.000000)%22 href=%22%23C48%22 /><use transform=%22translate(52.750000 42.750000) rotate(180.000000)%22 href=%22%23C1%22 /><use transform=%22translate(166.250000 174.144000) rotate(90.000000)%22 href=%22%23C2%22 /><use transform=%22translate(42.750000 52.750000) rotate(90.000000)%22 href=%22%23C49%22 /><use transform=%22translate(166.250000 50.500000) rotate(90.000000)%22 href=%22%23C49%22 /><use transform=%22translate(42.750000 176.394000) rotate(90.000000)%22 href=%22%23C1%22 /><use transform=%22translate(156.250000 40.500000)%22 href=%22%23C2%22 /><use transform=%22translate(52.750000 186.394000)%22 href=%22%23C50%22 /><use transform=%22translate(50.500000 40.500000)%22 href=%22%23C50%22 /><use transform=%22translate(158.500000 186.394000)%22 href=%22%23C1%22 /><use transform=%22translate(40.500000 50.500000) rotate(270.000000)%22 href=%22%23C2%22 /><use transform=%22translate(168.500000 176.394000) rotate(270.000000)%22 href=%22%23C51%22 /><use transform=%22translate(40.500000 178.644000) rotate(270.000000)%22 href=%22%23C51%22 /><use transform=%22translate(168.500000 48.250000) rotate(270.000000)%22 href=%22%23C1%22 /><use transform=%22translate(50.500000 188.644000) rotate(180.000000)%22 href=%22%23C2%22 /><use transform=%22translate(158.500000 38.250000) rotate(180.000000)%22 href=%22%23C52%22 /><use transform=%22translate(160.750000 188.644000) rotate(180.000000)%22 href=%22%23C52%22 /><use transform=%22translate(48.250000 38.250000) rotate(180.000000)%22 href=%22%23C1%22 /><use transform=%22translate(170.750000 178.644000) rotate(90.000000)%22 href=%22%23C2%22 /><use transform=%22translate(38.250000 48.250000) rotate(90.000000)%22 href=%22%23C53%22 /><use transform=%22translate(170.750000 46.000000) rotate(90.000000)%22 href=%22%23C53%22 /><use transform=%22translate(38.250000 180.894000) rotate(90.000000)%22 href=%22%23C1%22 /><use transform=%22translate(160.750000 36.000000)%22 href=%22%23C2%22 /><use transform=%22translate(48.250000 190.894000)%22 href=%22%23C54%22 /><use transform=%22translate(46.000000 36.000000)%22 href=%22%23C54%22 /><use transform=%22translate(163.000000 190.894000)%22 href=%22%23C1%22 /><use transform=%22translate(36.000000 46.000000) rotate(270.000000)%22 href=%22%23C2%22 /><use transform=%22translate(173.000000 180.894000) rotate(270.000000)%22 href=%22%23C55%22 /><use transform=%22translate(36.000000 183.144000) rotate(270.000000)%22 href=%22%23C55%22 /><use transform=%22translate(173.000000 43.750000) rotate(270.000000)%22 href=%22%23C1%22 /><use transform=%22translate(46.000000 193.144000) rotate(180.000000)%22 href=%22%23C2%22 /><use transform=%22translate(163.000000 33.750000) rotate(180.000000)%22 href=%22%23C56%22 /><use transform=%22translate(165.250000 193.144000) rotate(180.000000)%22 href=%22%23C56%22 /><use transform=%22translate(43.750000 33.750000) rotate(180.000000)%22 href=%22%23C1%22 /><use transform=%22translate(175.250000 183.144000) rotate(90.000000)%22 href=%22%23C2%22 /><use transform=%22translate(33.750000 43.750000) rotate(90.000000)%22 href=%22%23C57%22 /><use transform=%22translate(175.250000 41.500000) rotate(90.000000)%22 href=%22%23C57%22 /><use transform=%22translate(33.750000 185.394000) rotate(90.000000)%22 href=%22%23C1%22 /><use transform=%22translate(165.250000 31.500000)%22 href=%22%23C2%22 /><use transform=%22translate(43.750000 195.394000)%22 href=%22%23C58%22 /><use transform=%22translate(41.500000 31.500000)%22 href=%22%23C58%22 /><use transform=%22translate(167.500000 195.394000)%22 href=%22%23C1%22 /><use transform=%22translate(31.500000 41.500000) rotate(270.000000)%22 href=%22%23C2%22 /><use transform=%22translate(177.500000 185.394000) rotate(270.000000)%22 href=%22%23C59%22 /><use transform=%22translate(31.500000 187.644000) rotate(270.000000)%22 href=%22%23C59%22 /><use transform=%22translate(177.500000 39.250000) rotate(270.000000)%22 href=%22%23C1%22 /><use transform=%22translate(41.500000 197.644000) rotate(180.000000)%22 href=%22%23C2%22 /><use transform=%22translate(167.500000 29.250000) rotate(180.000000)%22 href=%22%23C60%22 /><use transform=%22translate(169.750000 197.644000) rotate(180.000000)%22 href=%22%23C60%22 /><use transform=%22translate(39.250000 29.250000) rotate(180.000000)%22 href=%22%23C1%22 /><use transform=%22translate(179.750000 187.644000) rotate(90.000000)%22 href=%22%23C2%22 /><use transform=%22translate(29.250000 39.250000) rotate(90.000000)%22 href=%22%23C61%22 /><use transform=%22translate(179.750000 37.000000) rotate(90.000000)%22 href=%22%23C61%22 /><use transform=%22translate(29.250000 189.894000) rotate(90.000000)%22 href=%22%23C1%22 /><use transform=%22translate(169.750000 27.000000)%22 href=%22%23C2%22 /><use transform=%22translate(39.250000 199.894000)%22 href=%22%23C62%22 /><use transform=%22translate(37.000000 27.000000)%22 href=%22%23C62%22 /><use transform=%22translate(172.000000 199.894000)%22 href=%22%23C1%22 /><use transform=%22translate(27.000000 37.000000) rotate(270.000000)%22 href=%22%23C2%22 /><use transform=%22translate(182.000000 189.894000) rotate(270.000000)%22 href=%22%23C63%22 /><use transform=%22translate(27.000000 192.144000) rotate(270.000000)%22 href=%22%23C63%22 /><use transform=%22translate(182.000000 34.750000) rotate(270.000000)%22 href=%22%23C1%22 /><use transform=%22translate(37.000000 202.144000) rotate(180.000000)%22 href=%22%23C2%22 /><use transform=%22translate(172.000000 24.750000) rotate(180.000000)%22 href=%22%23C64%22 /><use transform=%22translate(174.250000 202.144000) rotate(180.000000)%22 href=%22%23C64%22 /><use transform=%22translate(34.750000 24.750000) rotate(180.000000)%22 href=%22%23C1%22 /><use transform=%22translate(184.250000 192.144000) rotate(90.000000)%22 href=%22%23C2%22 /><use transform=%22translate(24.750000 34.750000) rotate(90.000000)%22 href=%22%23C65%22 /><use transform=%22translate(184.250000 32.500000) rotate(90.000000)%22 href=%22%23C65%22 /><use transform=%22translate(24.750000 194.394000) rotate(90.000000)%22 href=%22%23C1%22 /><use transform=%22translate(174.250000 22.500000)%22 href=%22%23C2%22 /><use transform=%22translate(34.750000 204.394000)%22 href=%22%23C66%22 /><use transform=%22translate(32.500000 22.500000)%22 href=%22%23C66%22 /><use transform=%22translate(176.500000 204.394000)%22 href=%22%23C1%22 /><use transform=%22translate(22.500000 32.500000) rotate(270.000000)%22 href=%22%23C2%22 /><use transform=%22translate(186.500000 194.394000) rotate(270.000000)%22 href=%22%23C67%22 /><use transform=%22translate(22.500000 196.644000) rotate(270.000000)%22 href=%22%23C67%22 /><use transform=%22translate(186.500000 30.250000) rotate(270.000000)%22 href=%22%23C1%22 /><use transform=%22translate(32.500000 206.644000) rotate(180.000000)%22 href=%22%23C2%22 /><use transform=%22translate(176.500000 20.250000) rotate(180.000000)%22 href=%22%23C68%22 /><use transform=%22translate(178.750000 206.644000) rotate(180.000000)%22 href=%22%23C68%22 /><use transform=%22translate(30.250000 20.250000) rotate(180.000000)%22 href=%22%23C1%22 /><use transform=%22translate(188.750000 196.644000) rotate(90.000000)%22 href=%22%23C2%22 /><use transform=%22translate(20.250000 30.250000) rotate(90.000000)%22 href=%22%23C69%22 /><use transform=%22translate(188.750000 28.000000) rotate(90.000000)%22 href=%22%23C69%22 /><use transform=%22translate(20.250000 198.894000) rotate(90.000000)%22 href=%22%23C1%22 /><use transform=%22translate(178.750000 18.000000)%22 href=%22%23C2%22 /><use transform=%22translate(30.250000 208.894000)%22 href=%22%23C70%22 /><use transform=%22translate(28.000000 18.000000)%22 href=%22%23C70%22 /><use transform=%22translate(181.000000 208.894000)%22 href=%22%23C1%22 /><use transform=%22translate(18.000000 28.000000) rotate(270.000000)%22 href=%22%23C2%22 /><use transform=%22translate(191.000000 198.894000) rotate(270.000000)%22 href=%22%23C71%22 /><use transform=%22translate(18.000000 201.144000) rotate(270.000000)%22 href=%22%23C71%22 /><use transform=%22translate(191.000000 25.750000) rotate(270.000000)%22 href=%22%23C1%22 /><use transform=%22translate(28.000000 211.144000) rotate(180.000000)%22 href=%22%23C2%22 /><use transform=%22translate(181.000000 15.750000) rotate(180.000000)%22 href=%22%23C72%22 /><use transform=%22translate(183.250000 211.144000) rotate(180.000000)%22 href=%22%23C72%22 /><use transform=%22translate(25.750000 15.750000) rotate(180.000000)%22 href=%22%23C1%22 /><use transform=%22translate(193.250000 201.144000) rotate(90.000000)%22 href=%22%23C2%22 /><use transform=%22translate(15.750000 25.750000) rotate(90.000000)%22 href=%22%23C73%22 /><use transform=%22translate(193.250000 23.500000) rotate(90.000000)%22 href=%22%23C73%22 /><use transform=%22translate(15.750000 203.394000) rotate(90.000000)%22 href=%22%23C1%22 /><use transform=%22translate(183.250000 13.500000)%22 href=%22%23C2%22 /><use transform=%22translate(25.750000 213.394000)%22 href=%22%23C74%22 /><use transform=%22translate(23.500000 13.500000)%22 href=%22%23C74%22 /><use transform=%22translate(185.500000 213.394000)%22 href=%22%23C1%22 /><use transform=%22translate(13.500000 23.500000) rotate(270.000000)%22 href=%22%23C2%22 /><use transform=%22translate(195.500000 203.394000) rotate(270.000000)%22 href=%22%23C75%22 /><use transform=%22translate(13.500000 205.644000) rotate(270.000000)%22 href=%22%23C75%22 /><use transform=%22translate(195.500000 21.250000) rotate(270.000000)%22 href=%22%23C1%22 /><use transform=%22translate(23.500000 215.644000) rotate(180.000000)%22 href=%22%23C2%22 /><use transform=%22translate(185.500000 11.250000) rotate(180.000000)%22 href=%22%23C76%22 /><use transform=%22translate(187.750000 215.644000) rotate(180.000000)%22 href=%22%23C76%22 /><use transform=%22translate(21.250000 11.250000) rotate(180.000000)%22 href=%22%23C1%22 /><use transform=%22translate(197.750000 205.644000) rotate(90.000000)%22 href=%22%23C2%22 /><use transform=%22translate(11.250000 21.250000) rotate(90.000000)%22 href=%22%23C77%22 /><use transform=%22translate(197.750000 19.000000) rotate(90.000000)%22 href=%22%23C77%22 /><use transform=%22translate(11.250000 207.894000) rotate(90.000000)%22 href=%22%23C1%22 /><use transform=%22translate(187.750000 9.000000)%22 href=%22%23C2%22 /><use transform=%22translate(21.250000 217.894000)%22 href=%22%23C78%22 /><use transform=%22translate(19.000000 9.000000)%22 href=%22%23C78%22 /><use transform=%22translate(190.000000 217.894000)%22 href=%22%23C1%22 /><use transform=%22translate(9.000000 19.000000) rotate(270.000000)%22 href=%22%23C2%22 /><use transform=%22translate(200.000000 207.894000) rotate(270.000000)%22 href=%22%23C79%22 /><use transform=%22translate(9.000000 210.144000) rotate(270.000000)%22 href=%22%23C79%22 /><use transform=%22translate(200.000000 16.750000) rotate(270.000000)%22 href=%22%23C1%22 /><use transform=%22translate(19.000000 220.144000) rotate(180.000000)%22 href=%22%23C2%22 /><use transform=%22translate(190.000000 6.750000) rotate(180.000000)%22 href=%22%23C80%22 /><use transform=%22translate(192.250000 220.144000) rotate(180.000000)%22 href=%22%23C80%22 /><use transform=%22translate(16.750000 6.750000) rotate(180.000000)%22 href=%22%23C1%22 /><use transform=%22translate(202.250000 210.144000) rotate(90.000000)%22 href=%22%23C2%22 /><use transform=%22translate(6.750000 16.750000) rotate(90.000000)%22 href=%22%23C81%22 /><use transform=%22translate(202.250000 14.500000) rotate(90.000000)%22 href=%22%23C81%22 /><use transform=%22translate(6.750000 212.394000) rotate(90.000000)%22 href=%22%23C1%22 /><use transform=%22translate(192.250000 4.500000)%22 href=%22%23C2%22 /><use transform=%22translate(16.750000 222.394000)%22 href=%22%23C82%22 /><use transform=%22translate(14.500000 4.500000)%22 href=%22%23C82%22 /><use transform=%22translate(194.500000 222.394000)%22 href=%22%23C1%22 /><use transform=%22translate(4.500000 14.500000) rotate(270.000000)%22 href=%22%23C2%22 /><use transform=%22translate(204.500000 212.394000) rotate(270.000000)%22 href=%22%23C83%22 /><use transform=%22translate(4.500000 214.644000) rotate(270.000000)%22 href=%22%23C83%22 /><use transform=%22translate(204.500000 12.250000) rotate(270.000000)%22 href=%22%23C1%22 /><use transform=%22translate(14.500000 224.644000) rotate(180.000000)%22 href=%22%23C2%22 /><use transform=%22translate(194.500000 2.250000) rotate(180.000000)%22 href=%22%23C84%22 /><use transform=%22translate(196.750000 224.644000) rotate(180.000000)%22 href=%22%23C84%22 /><use transform=%22translate(12.250000 2.250000) rotate(180.000000)%22 href=%22%23C1%22 /><use transform=%22translate(206.750000 214.644000) rotate(90.000000)%22 href=%22%23C2%22 /><use transform=%22translate(2.250000 12.250000) rotate(90.000000)%22 href=%22%23C85%22 /><use transform=%22translate(206.750000 10.000000) rotate(90.000000)%22 href=%22%23C85%22 /><use transform=%22translate(2.250000 216.894000) rotate(90.000000)%22 href=%22%23C1%22 /><use transform=%22translate(196.750000 0.000000)%22 href=%22%23C2%22 /><use transform=%22translate(0.000000 0.000000)%22 href=%22%23C86%22 /><use transform=%22translate(12.250000 226.894000)%22 href=%22%23C86%22 /><g transform=%22translate(0.000000 0.000000) rotate(0.000000)%22><path class=%22port%22 d=%22M 0,-1.125000 V 1.125000%22 /><use href=%22%23port-symbol%22 /></g><text class=%22label%22 text-anchor=%22start%22 dominant-baseline=%22text-after-edge%22 x=%220.000000%22 y=%22-0.000000%22>P0</text><g transform=%22translate(209.000000 226.894000) rotate(180.000000)%22><path class=%22port%22 d=%22M 0,-1.125000 V 1.125000%22 /><use href=%22%23port-symbol%22 /></g><text class=%22label%22 text-anchor=%22end%22 dominant-baseline=%22text-before-edge%22 x=%22209.000000%22 y=%22-226.894000%22>P1</text></g></g></svg>)
The model is created from the port specification, with the peak power of the 7.5π pulse of the silicon wire, and added to the spiral as its active model. Explicit arguments take precedence over the medium, so a second model with the linear free-carrier dispersion of the silicon wire, m³, differs from the first only in that term. The mode solve runs once: the second call reuses its result.
# Set the peak power of the 7.5 pi pulse of the silicon wire (W)peak_power = 7.5 * np.pi / (gamma * l_eff)
# Create the model from the strip cross-section, with every coefficient from the mediumsoref_model = pf.AnalyticWaveguideModel.nonlinear(    reference_frequency=carrier_frequency,    port_spec="Strip",    technology=technology,    propagation_loss=loss,    peak_power=peak_power,    verbose=False,)
# Create a second model that replaces the Soref terms with the linear coefficientlinear_model = pf.AnalyticWaveguideModel.nonlinear(    reference_frequency=carrier_frequency,    port_spec="Strip",    technology=technology,    propagation_loss=loss,    fcd_coefficients=(fcd, 0.0),    fcd_exponents=(1.0, 1.0),    peak_power=peak_power,    verbose=False,)
# Print the cross-section parameters the mode solve suppliedproperties = soref_model.propertiesprint(f"n_eff = {properties.n_eff:.4f}, n_group = {properties.n_group:.3f}")print(f"D = {properties.dispersion / 1e-18:.0f} ps/(nm km)")print(f"Kerr effective area = {properties.kerr_effective_area * 1e12:.4f} um^2")print(f"TPA effective area = {properties.tpa_effective_area * 1e12:.4f} um^2")print(f"routed length = {pf.route_length(spiral) * 1e-4:.4f} cm")
n_eff = 2.4400, n_group = 4.046D = 1446 ps/(nm km)Kerr effective area = 0.0909 um^2TPA effective area = 0.0909 um^2routed length = 2.0000 cmThe same pulse is sent through the silicon wire of the first part, whose parameters are those of Yin and Agrawal, and through the spiral with each of the two models, free carriers included in all three.
# Create the input pulse at this peak powerpulse = np.sqrt(peak_power) * np.exp(-0.5 * (t / t0) ** 2) + 0j
# Propagate through the silicon wire with free carriersoutputs = {    "silicon wire, Yin and Agrawal": propagate(        silicon_wire(peak_power=peak_power, carriers=True), pulse, time_step    )}
# Propagate through the spiral with each model active in turnfor label, model in (    ("spiral, linear FCD", linear_model),    ("spiral, Soref FCD", soref_model),):    spiral.add_model(model, label, set_active=True)    outputs[label] = propagate(spiral, pulse, time_step)
# Plot the output spectra over a wider range, since the Soref terms shift furtherwide_window = 3.0  # Half-width of the plotted wavelength range (nm)fig, ax = plt.subplots(figsize=(6.4, 3.4), tight_layout=True)for label, out in outputs.items():    lam_nm, psd = spectrum(out)    keep = np.abs(lam_nm - wavelength * 1e3) < wide_window    ax.plot(lam_nm[keep], psd[keep] / psd[keep].max(), lw=1.4, label=label)
# Label the plotax.set_xlabel("wavelength (nm)")ax.set_ylabel("normalised spectral density")ax.legend(fontsize=8)plt.show()
# Print the output peak power, energy and mean wavelength of each casefor label, out in outputs.items():    power = np.abs(out) ** 2    energy = power.sum() * time_step * 1e12    lam_nm, psd = spectrum(out)    mean_wavelength = np.sum(lam_nm * psd) / np.sum(psd)    print(        f"{label:30s}: peak {power.max():.3f} W, energy {energy:.2f} pJ, "        f"mean wavelength {mean_wavelength:.3f} nm"    )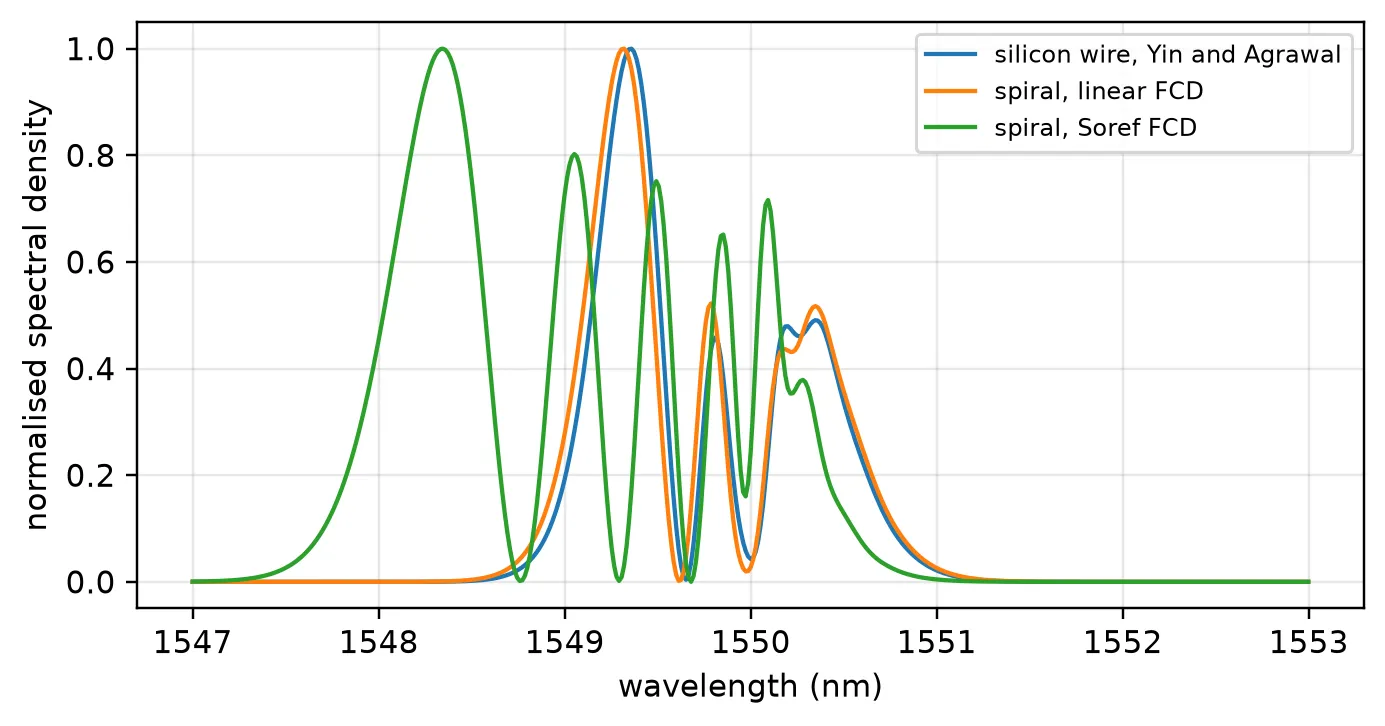
silicon wire, Yin and Agrawal : peak 0.477 W, energy 10.50 pJ, mean wavelength 1549.732 nmspiral, linear FCD : peak 0.439 W, energy 9.59 pJ, mean wavelength 1549.714 nmspiral, Soref FCD : peak 0.440 W, energy 9.59 pJ, mean wavelength 1548.998 nmWith the same linear free-carrier dispersion, the spiral and the silicon wire give nearly the same spectrum: their mean wavelengths differ by 0.02 nm. The effective area from the mode solve, 0.091 µm², is 9% smaller than the 0.1 µm² of Yin and Agrawal, so the same power is a higher intensity, and the extra TPA and free-carrier absorption leave 9.56 pJ at the output instead of 10.47 pJ.
The Soref and Bennett form moves the spectrum a further 0.72 nm to the blue and adds a peak near 1548.3 nm. The pulse creates up to about 10¹⁸ cm⁻³ carriers near the input, and at 10¹⁷ to 10¹⁸ cm⁻³ the hole term makes the index change two to three times what the linear coefficient gives. The output energy is the same in both cases, since free-carrier dispersion only changes the phase.
Summary
Section titled “Summary”pf.AnalyticWaveguideModel.nonlinearbuilds a waveguide model with its nonlinear time stepper from physical parameters: the Kerr and TPA coefficients, the free-carrier coefficients and lifetime, and the cross-section. The same model goes on an abstract black box or on a routed layout, whose length the stepper measures.- Given a port specification, it takes , , and the effective areas from
a mode solve, and the nonlinear coefficients from the
nonlinear_specof the core’s Tidy3D medium. The effective area uses the vectorial definition normalised by the mode power. - In the stepper, the Kerr effect and TPA go on
dn_kerr, and the free carriers ondn_fcwithtau_fcequal to the carrier lifetime. For a free-carrier index that is not proportional to the density,dn_fc_maprelaxes the density and converts it afterwards. - The stepper splits the waveguide into sections, a split-step scheme. Passing
peak_powerchooses their number so that the Kerr phase per section stays belowmax_phase. - Two-photon absorption makes the nonlinear phase grow only logarithmically with input power. Free carriers add an asymmetry in time and, through the chirp, an asymmetry in the spectrum.
- Set
dispersionwhen the dispersion length is comparable to the waveguide length. For a picosecond pulse in a centimetre of silicon it is not; for a femtosecond pulse it is.