Time-Domain Simulation of a Low-Pass Filter
In this notebook, we demonstrate the workflow for simulating the time-domain response of a photonic low-pass filter (LPF) using PhotonForge.
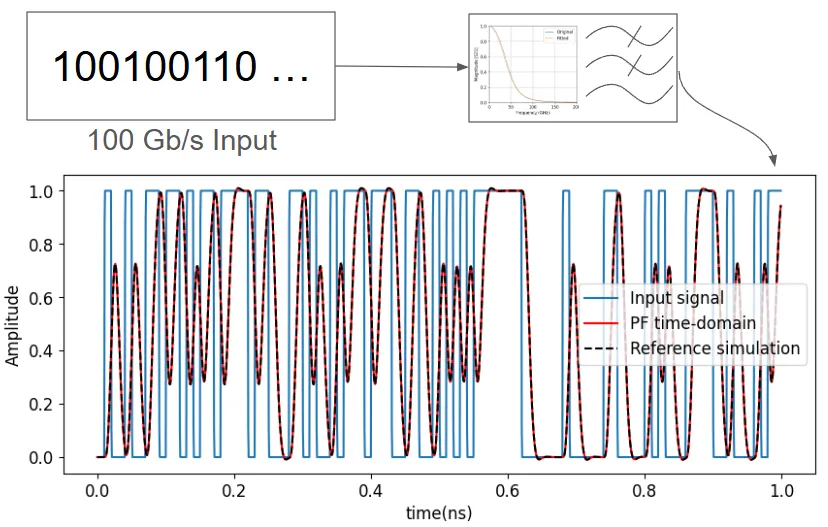
We start by importing the frequency-domain S-parameters of the filter and converting them into an S-matrix representation. This is followed by fitting the frequency response using a pole-residue expansion, which enables efficient and accurate time-domain simulation. Finally, we drive the system using a reference input waveform and compare the resulting output with the response from a commercial simulation tool.
# !pip install scikit-rf # Uncomment this line to install skrf moduleimport matplotlib.pyplot as pltimport numpy as npimport photonforge as pfimport skrf as rf
plt.rcParams["font.size"] = 12
We begin by importing the frequency-domain response of a low-pass filter from a touchstone file, which was generated using a commercial electromagnetic solver. The S-parameters are then processed to extract the transmission coefficient (S21) for subsequent time-domain analysis.
# Load the S-parameter data from a commercial EM solverlpf = rf.Network("misc/sparameters_lpf_30GHz.s1p")
# Extract the frequency vectorfreq = lpf.f
# Extract and flatten the S21 parameterS21 = lpf.s.squeeze()
We now load the time-domain input and output waveforms from a reference simulation performed in a commercial software. The data is read from text files where each row represents a time-value pair, and the first line (header) is skipped.
# Load results from interconnect simulationsfilenames = ["misc/input_signal.txt", "misc/output_signal.txt"]
# Read txt files while skipping the first row (header)data = [np.loadtxt(filename, delimiter=",", skiprows=1) for filename in filenames]
# Extract time vector and signal waveformstime = data[0][:, 0]  # Timeinput_signal = data[0][:, 1]  # Input signal amplitudeoutput_signal = data[1][:, 1]  # Output signal amplitude
Creating the S-Matrix
Section titled “Creating the S-Matrix”To reproduce the time-domain response within PhotonForge, we first define an S-matrix using the imported frequency-domain data. This S-matrix encapsulates the S21 transmission response of the low-pass filter and serves as the foundation for time-domain simulation.
elements = {("1", "2"): S21}baseband_freqs = freqs_matrix = pf.SMatrix(frequencies=baseband_freqs, elements=elements)Fitting the S-Matrix
Section titled “Fitting the S-Matrix”To enable time-domain simulation, we fit the frequency-domain S-matrix using a rational function approximation via pole-residue expansion. We specify a frequency-dependent delay and control the fitting accuracy using an RMS error tolerance. The fitted response is then compared against the original S21 to validate the quality of the approximation.
# Fit the S-matrix using a pole-residue model for time-domain simulationpole_res, err = pf.pole_residue_fit(s_matrix, min_poles=4)
# Evaluate the fitted S21 over the original frequency rangeS21_fit = pole_res(baseband_freqs)[("1", "2")]
# Plot magnitude and phase comparison of original vs fitted responsefig, ax = plt.subplots(1, 2, figsize=(10, 4))
# Plot magnitudeax[0].plot(freq / 1e9, np.abs(S21), label="Original")ax[0].plot(freq / 1e9, np.abs(S21_fit), "--", label="Fitted")ax[0].set_xlabel("Frequency (GHz)")ax[0].set_ylabel("Magnitude |S21|")ax[0].set_xlim(0, 200)ax[0].set_ylim(0, 1)ax[0].legend()ax[0].grid(True)
# Plot phaseax[1].plot(freq / 1e9, np.angle(S21), label="Original")ax[1].plot(freq / 1e9, np.angle(S21_fit), "--", label="Fitted")ax[1].set_xlabel("Frequency (GHz)")ax[1].set_ylabel("Phase ∠S21 (rad)")ax[1].set_xlim(0, 200)ax[1].legend()ax[1].grid(True)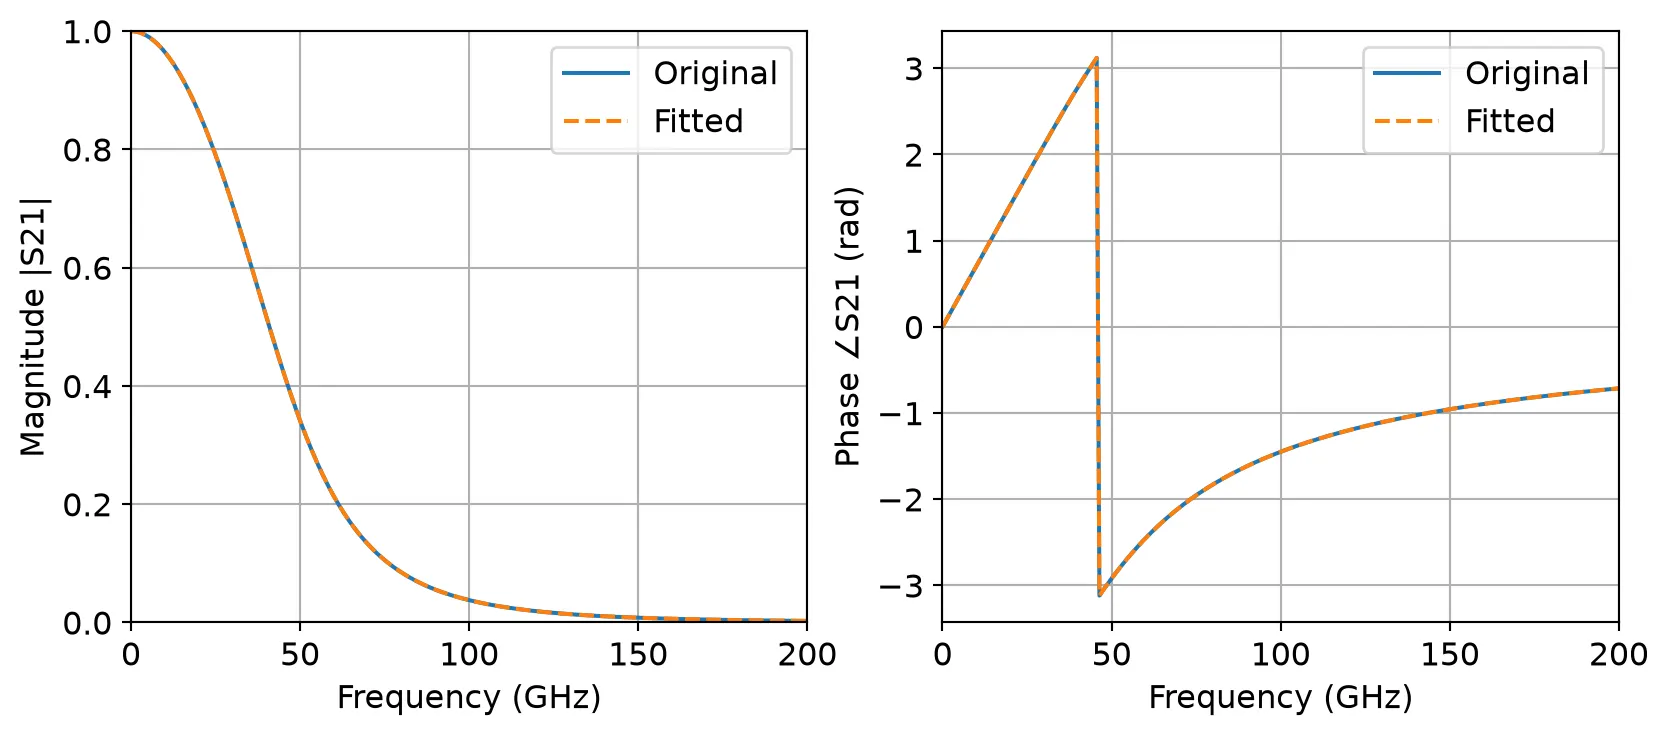
Time-Domain Response
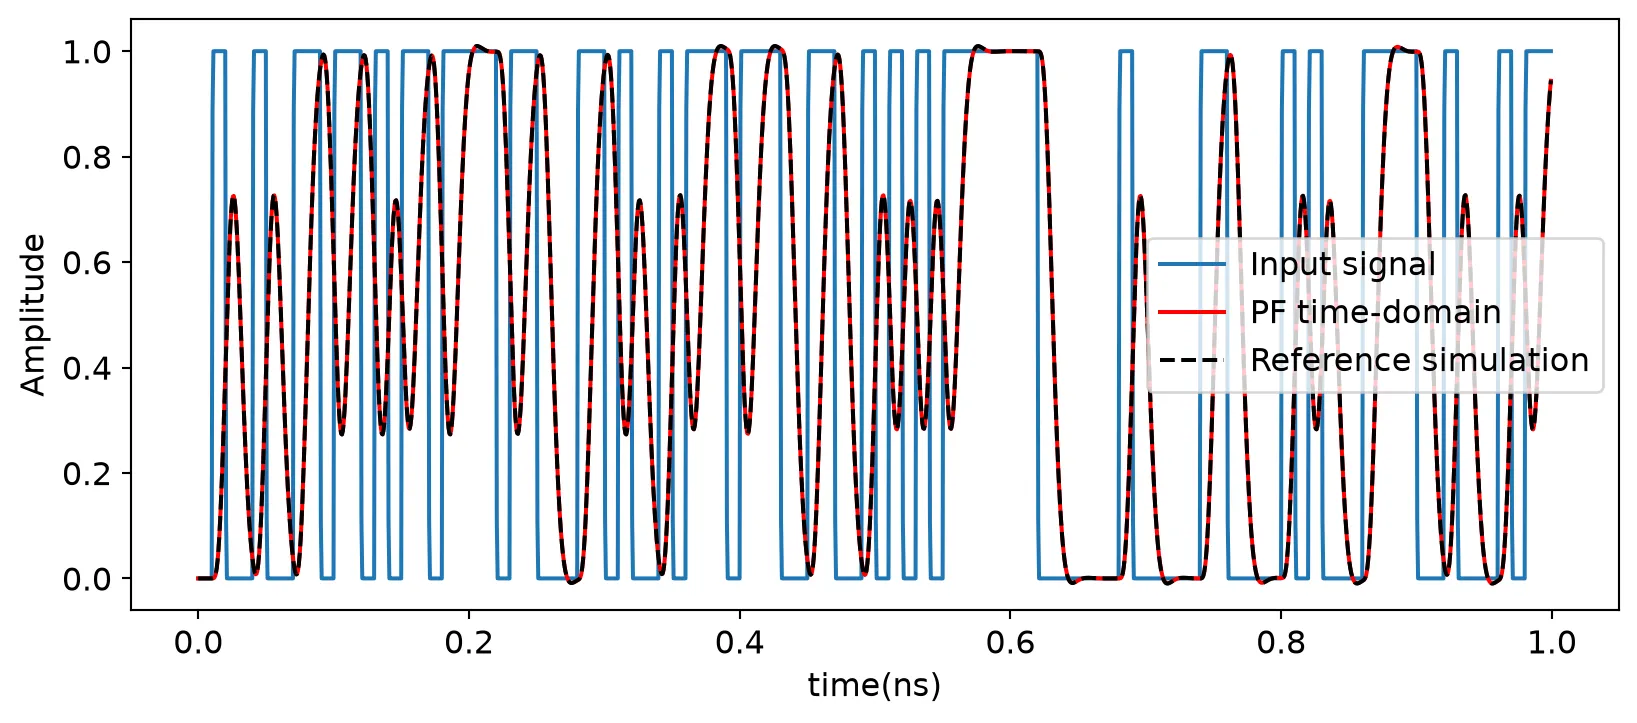
Section titled “Time-Domain Response”With the fitted pole-residue model, we simulate the time-domain behavior of the low-pass filter in PhotonForge. The simulation is driven by the input signal from the reference environment, and the result is compared with the original output waveform. This demonstrates the accuracy of PhotonForge’s time-domain engine in reproducing realistic filter responses.
# Set up time and sampling stept = timedt = t[1] - t[0]
# Create a time-domain model from the fitted pole-residue systemtime_domain_model = pf.TimeDomainModel(pole_res, time_step=dt)
# Create the input TimeSeriesinputs = pf.TimeSeries(values={"1": input_signal}, time_step=dt)
# Simulate time-domain response by stepping through input waveformreceived_signal = time_domain_model.step(inputs=inputs)["2"]
# Convert to real to avoid ComplexWarning during plottingreceived_signal = np.real(received_signal)
# Plot input and output signals for comparison%matplotlib inlineplt.figure(figsize=(10, 4))plt.plot(t[:5000] * 1e9, input_signal[:5000], label="Input signal")           # Original inputplt.plot(t[:5000] * 1e9, received_signal[:5000], "r-", label="PF time-domain")  # PF simulated outputplt.plot(t[:5000] * 1e9, output_signal[:5000], "k--", label="Reference simulation") # Reference simulation outputplt.xlabel("time(ns)")plt.ylabel("Amplitude")plt.legend()