Polarizing Beam Splitter
In this notebook, we reproduce the main simulation and design results presented in [1].
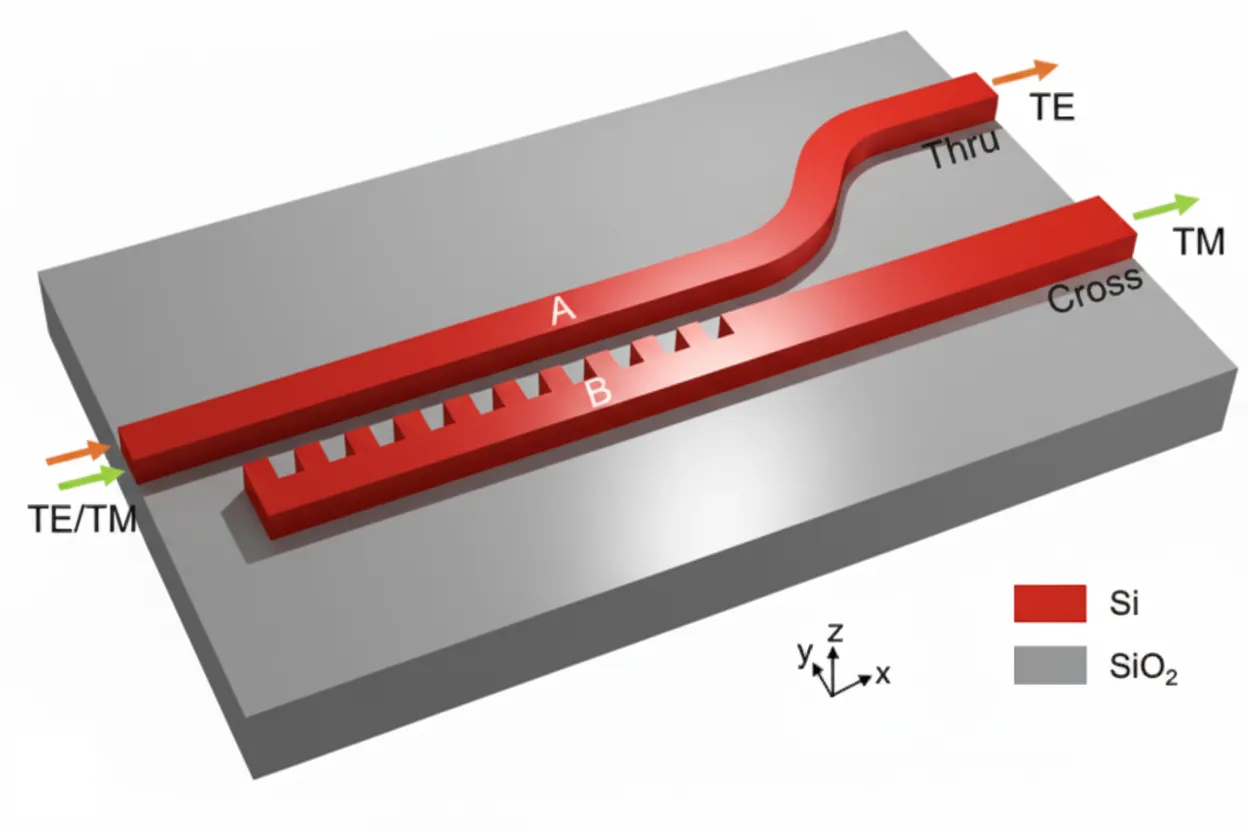
The paper introduces a polarizing beam splitter (PBS) implemented on a silicon-on-insulator (SOI) platform. The device is based on an asymmetric directional coupler (ADC) composed of a conventional strip waveguide and a subwavelength grating (SWG) waveguide. By engineering the SWG geometry, the design achieves phase matching for TM polarization while maintaining a compact footprint and broadband operation.
In this notebook, we follow a systematic workflow to reproduce and analyze the results of the SWG-assisted PBS:
- Technology setup: define the SOI platform, wavelength range, and mesh parameters.
- Port definition and mode analysis: construct and visualize the optical modes for both strip and SWG waveguides to ensure proper confinement and polarization behavior.
- Component construction: build the asymmetric directional coupler geometry with user-defined SWG parameters (period, duty cycle, and gap).
- Frequency-domain simulation: compute the scattering matrix (-parameters) to extract transmission spectra for TE and TM inputs.
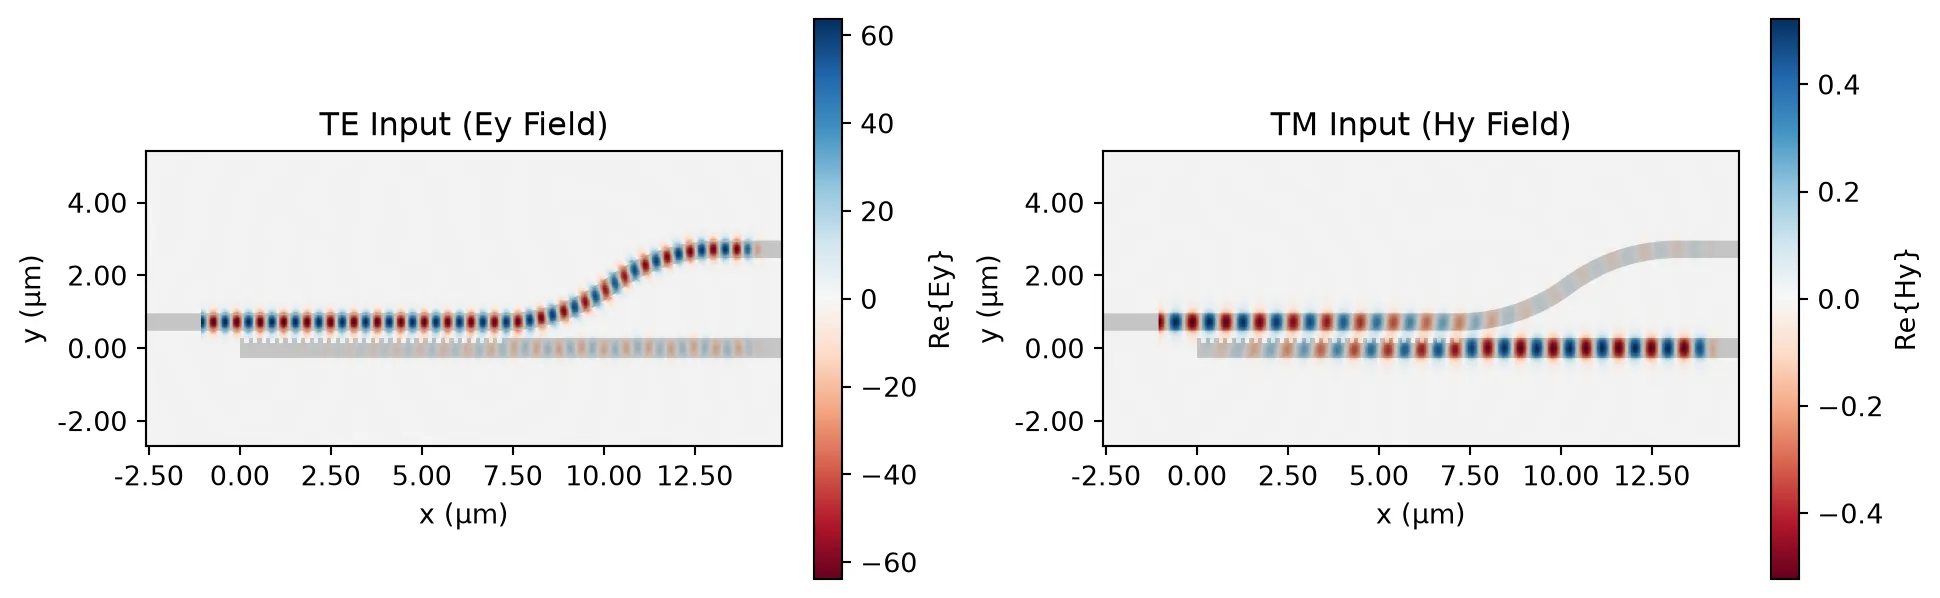
- Field visualization: plot the electric and magnetic field distributions to confirm polarization-selective coupling.
This structured approach reproduces the key experimental and simulated trends reported in the paper while maintaining flexibility for parameter exploration and design optimization.
References
- Zhang, Fang, et al. “Ultra-broadband and compact polarizing beam splitter in silicon photonics.” OSA Continuum 2020 3 (3), 560-567, doi: 10.1364/OSAC.385546.
import matplotlib.pyplot as pltimport numpy as npimport photonforge as pfimport siepic_forge as siepicimport tidy3d as tdfrom photonforge.live_viewer import LiveViewer
viewer = LiveViewer()
LiveViewer started at http://127.0.0.1:44321. Call its 'stop()' method to free the port.Technology and Simulation Setup
Section titled “Technology and Simulation Setup”We begin by defining the SiEPIC EBeam technology in PhotonForge. This technology provides a realistic silicon-on-insulator (SOI) process definition used in experimental photonic platforms. The top oxide is removed (include_top_opening=True) to match the air-clad structure used in the paper.
# Initialize the EBeam technology with top oxide removed (air cladding)tech = siepic.ebeam(top_oxide_thickness=0.0)
# Set default technology for PhotonForge simulationspf.config.default_technology = tech
# Define wavelength sweep rangewavelengths = np.linspace(1.45, 1.65, 51)freqs = pf.C_0 / wavelengths
Defining Port Specifications
Section titled “Defining Port Specifications”We next define the input/output port specifications for both the regular strip and SWG waveguides.
- The strip waveguide has a width of 0.48 µm, matching the standard single-mode silicon waveguide used in the paper.
- The SWG-equivalent waveguide has a slightly larger effective width of 0.555 µm, consistent with the optimized design parameters that achieve TM phase matching.
- Both ports support two optical modes, enabling simulation of both TE and TM fundamental modes.
- The
path_profilesparameter defines the waveguide cross-section profile used by PhotonForge to construct the port geometry.
# Define the width of the regular silicon strip waveguide (µm)w_strip = 0.48
# Define the width of the subwavelength grating (SWG) equivalent waveguide (µm)w_swg = 0.555
# Create a port specification for the strip waveguideport_spec_strip = pf.PortSpec(    description="Multi mode strip",  # descriptive label for identification    width=2.5,  # total port width (simulation window)    num_modes=2,  # number of supported optical modes    target_neff=3.5,  # target effective index for solver initialization    limits=(-1.5, 1.22),  # vertical boundaries of the simulation domain    path_profiles=[        (w_strip, 0, (1, 0))    ],  # waveguide path geometry (width, offset, direction))
# Create a port specification for the SWG (subwavelength) waveguideport_spec_swg = pf.PortSpec(    description="Multi mode swg",    width=2.5,    num_modes=2,    target_neff=3.5,    limits=(-1.5, 1.22),    path_profiles=[(w_swg, 0, (1, 0))],)
Before proceeding to coupling simulations, it is essential to inspect the mode field profiles of each port.
We visually verify that the fields are well confined within the waveguide core and decay to near-zero amplitude at the port boundaries.
# Compute modes for both ports at 1.55 µm (f = c / λ)f0 = pf.C_0 / 1.55
# Strip port modesmode_solver_strip = pf.port_modes(port_spec_strip, [f0], mesh_refinement=30)
# SWG port modesmode_solver_swg = pf.port_modes(port_spec_swg, [f0], mesh_refinement=30)
# Create a 2×2 figure layout for two modes (m=0,1) of both portsfig, axes = plt.subplots(2, 2, figsize=(10, 8), constrained_layout=True)
mode_solver_strip.plot_field("E", mode_index=0, f=f0, ax=axes[0, 0])mode_solver_strip.plot_field("H", mode_index=1, f=f0, ax=axes[0, 1])mode_solver_swg.plot_field("E", mode_index=0, f=f0, ax=axes[1, 0])mode_solver_swg.plot_field("H", mode_index=1, f=f0, ax=axes[1, 1])axes[0, 0].set_title("Strip | TE Mode")axes[0, 1].set_title("Strip | TM Mode")axes[1, 0].set_title("SWG | TE Mode")axes[1, 1].set_title("SWG | TM Mode")# Add a shared figure titlefig.suptitle("Port Mode Fields at λ = 1.55 µm", y=1.02)plt.show()
Uploading task 'Mode-ModeSolver…'Starting task 'Mode-ModeSolver': https://tidy3d.simulation.cloud/workbench?taskId=mo-35e5df16-b4ce-4e3a-99fa-da320c14c547Downloading data from 'Mode-ModeSolver'…Uploading task 'Mode-ModeSolver…'Starting task 'Mode-ModeSolver': https://tidy3d.simulation.cloud/workbench?taskId=mo-1f1e0325-9984-489c-821f-8b45bcf17b40Downloading data from 'Mode-ModeSolver'…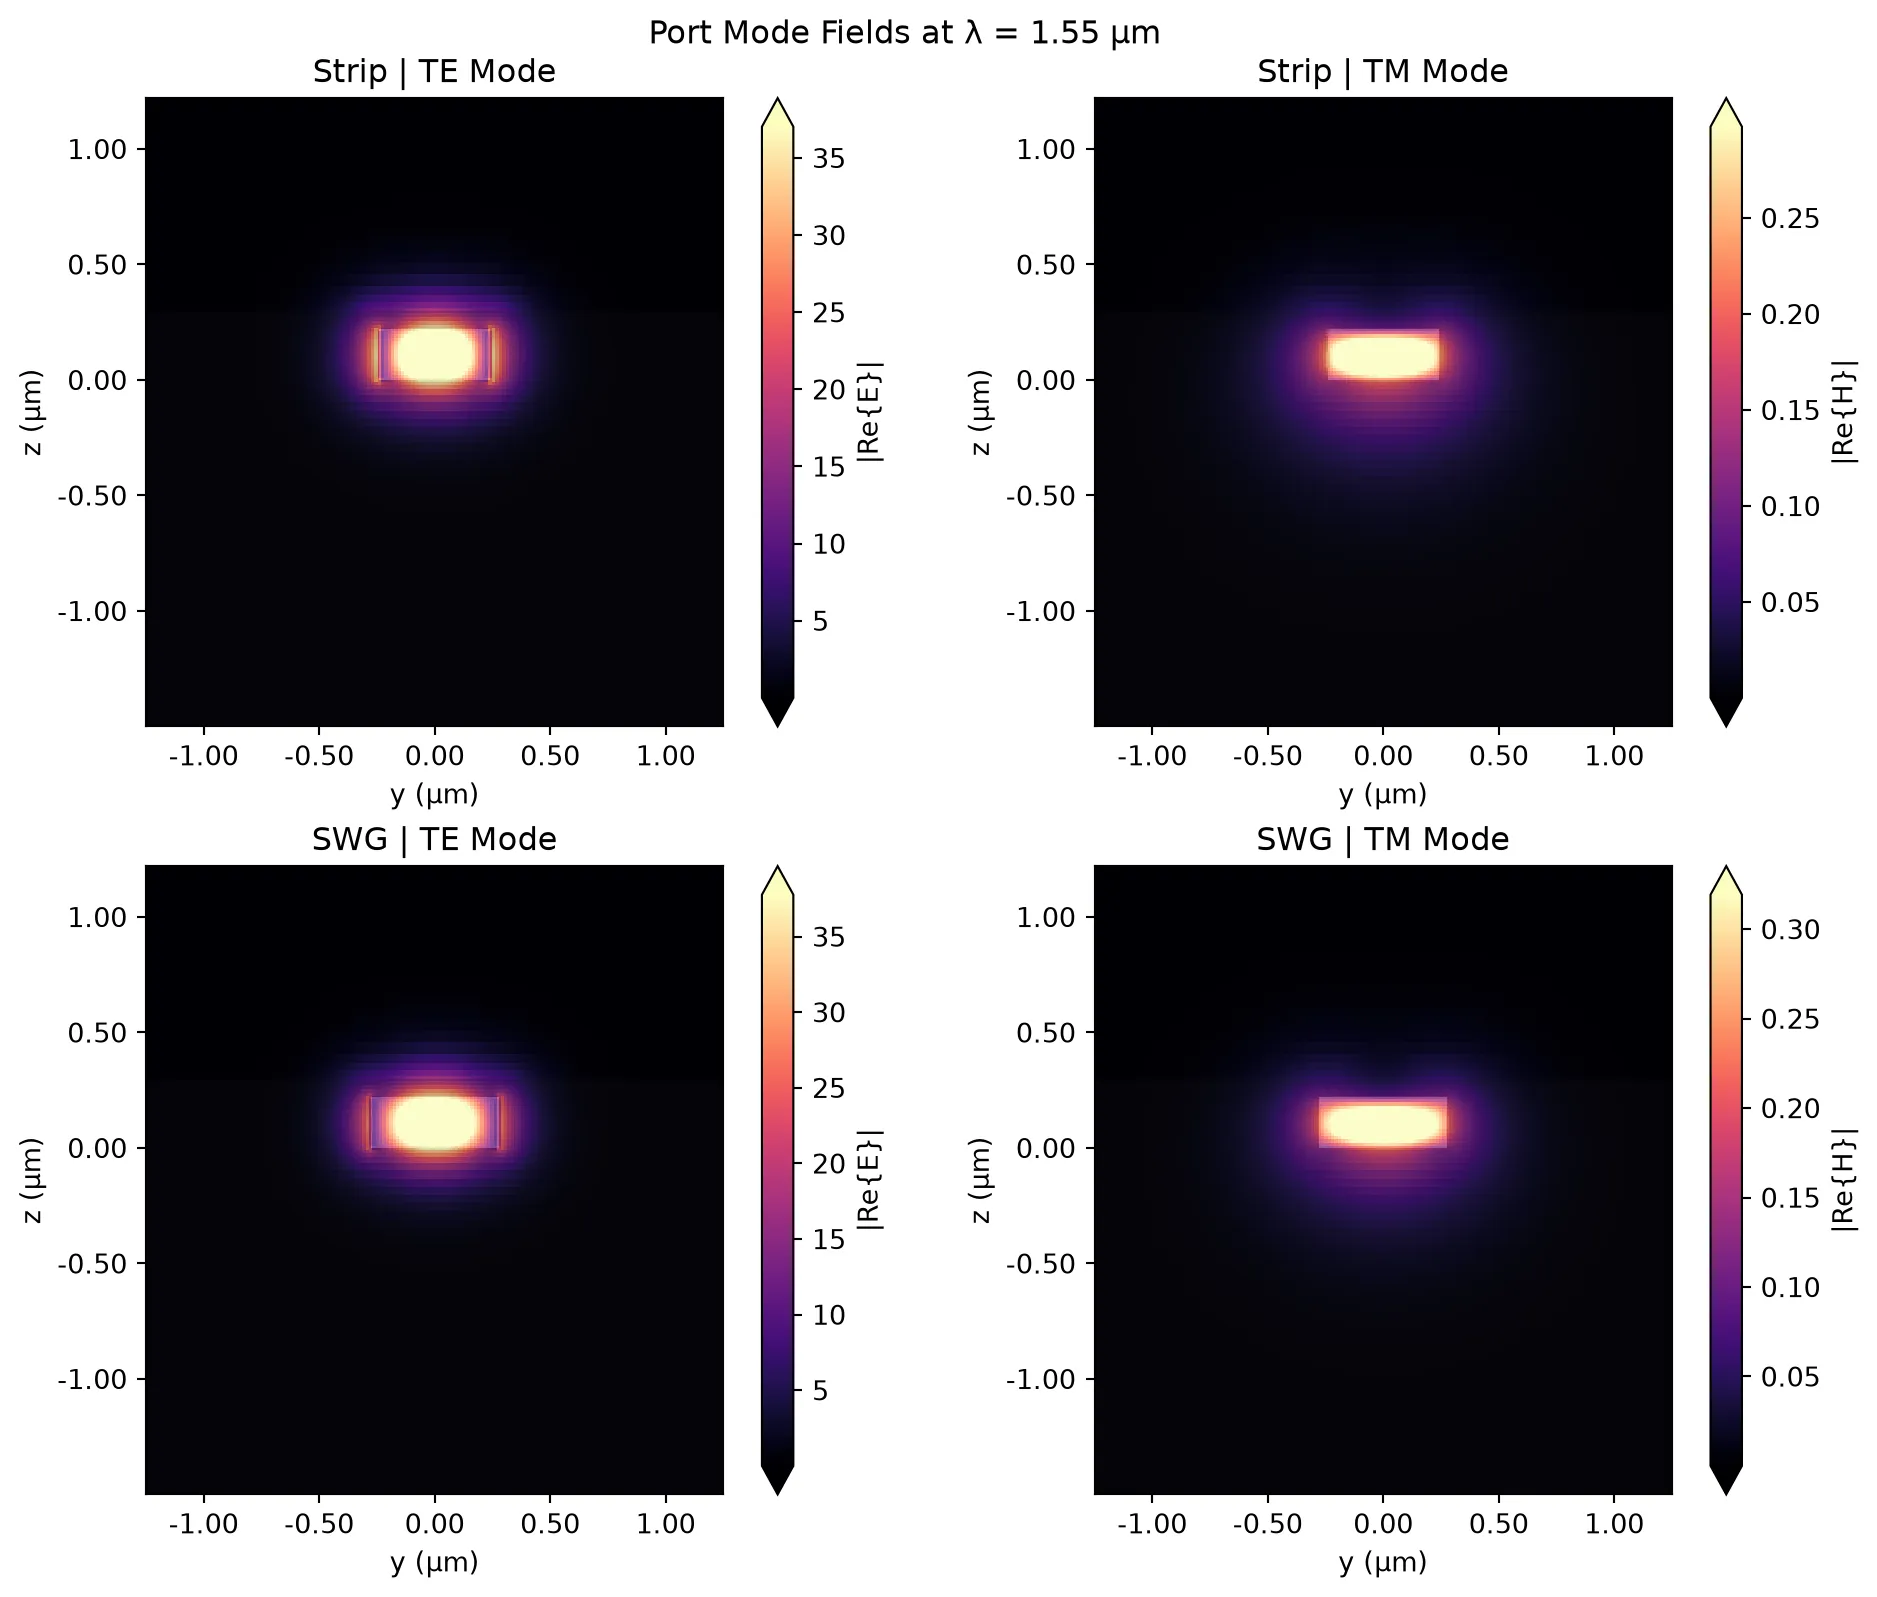
Creating PBS
Section titled “Creating PBS”We define a parametric component that constructs the SWG-assisted asymmetric coupler used as a polarizing beam splitter:
- The SWG region is generated by repeating a unit cell with period and duty cycle , producing a coupling length .
- The strip waveguide is routed to run parallel through the coupling region and then transitions via an S-bend to separate the outputs.
- Ports are detected and added using the provided
PortSpecs, allowing us to excite and monitor TE/TM modes consistently across runs. - A Tidy3D model is attached for subsequent FDTD simulations using the same geometric object.
# Define a parametric component for the SWG-assisted PBS@pf.parametric_componentdef create_pbs(    *,    spec_strip=port_spec_strip,    spec_swg=port_spec_swg,    w_corrugation=0.130,    gap=0.200,    swg_period=0.240,    swg_duty_cycle=0.5,    n_periods=30,    s_bend_length=6,    s_bend_offset=2,):    # Resolve string-based specs from the default technology if needed    if isinstance(spec_strip, str):        spec_strip = pf.config.default_technology.ports[spec_strip]    if isinstance(spec_swg, str):        spec_swg = pf.config.default_technology.ports[spec_swg]
    # Extract effective silicon widths from the provided PortSpecs    w_strip, _ = spec_strip.path_profile_for("Si")    w_swg, _ = spec_swg.path_profile_for("Si")
    # Compute total coupling length from SWG period and number of periods    coupling_length = n_periods * swg_period
    # Create one SWG unit cell component consisting of ridge + groove    unit_cell = pf.Component("SWG Period")
    # Build the ridge and groove rectangles for one period    ridge_length = swg_duty_cycle * swg_period    ridge = pf.Rectangle((0, -w_swg / 2), (ridge_length, w_swg / 2))    groove = pf.Rectangle(        (ridge_length, -w_swg / 2), (swg_period, w_swg / 2 - w_corrugation)    )
    # Add ridge and groove into the unit cell along +x    unit_cell.add((1, 0), ridge, groove)
    # Create the parent PBS component    pbs = pf.Component("PBS")
    # Instantiate the SWG array by repeating the unit cell N times    swg_array = pf.Reference(        component=unit_cell, columns=n_periods, rows=1, spacing=(swg_period, 0.0)    )
    # Add a short straight continuation for the SWG waveguide after coupling region    swg_wg = pf.Rectangle(        (coupling_length, -w_swg / 2),        (coupling_length + s_bend_length + 0.1, w_swg / 2),    )
    # Route the strip waveguide: lead-in, straight through coupler, then S-bend    strip_wg = (        pf.Path(origin=(-1.0, gap + (w_swg + w_strip) / 2), width=w_strip)        .segment(endpoint=(coupling_length + 1.0, 0), relative=True)        .s_bend(endpoint=(s_bend_length, s_bend_offset), relative=True)    )
    # Add geometry to the PBS component (placed along +x)    pbs.add((1, 0), swg_array, strip_wg, swg_wg)
    # Detect and add ports for strip (input) and SWG (output on +x boundary)    pbs.add_port(pbs.detect_ports([spec_strip]))    pbs.add_port(pbs.detect_ports([spec_swg], on_boundary="+x"))
    # Attach a Tidy3D model for simulation    pbs.add_model(        pf.Tidy3DModel(            monitors=[                td.FieldMonitor(                    name="field",                    center=(0, 0, 0.11),                    size=(td.inf, td.inf, 0),                    freqs=[pf.C_0 / 1.55],                )            ],        )    )    return pbs
# Instantiate and view the PBS component with default parameterspbs = create_pbs()viewer(pbs);fill:%23221f20;font-weight:bold;font-size:0.265900px;}.terminal{fill:none;stroke:%23805080;stroke-width:0.033238;}.dashed{stroke-dasharray:0.166188,0.099713;}.port{fill:none;stroke:%23805080;stroke-width:0.066475;}.virtual-connection{fill:none;stroke:%23907090;stroke-width:0.049856;}.layer_31_0{stroke:%238c78ef;fill:url(%23pat-layer_31_0);fill-opacity:0.492;}.label_31_0{fill:%238c78ef;}.layer_33_0{stroke:%238c78ef;fill:url(%23pat-layer_33_0);fill-opacity:0.492;}.label_33_0{fill:%238c78ef;}.layer_102_0{stroke:%238c78ef;fill:url(%23pat-layer_102_0);fill-opacity:0.492;}.label_102_0{fill:%238c78ef;}.layer_110_0{stroke:%238c78ef;fill:url(%23pat-layer_110_0);fill-opacity:0.492;}.label_110_0{fill:%238c78ef;}.layer_189_0{stroke:%23000000;fill:none;}.label_189_0{fill:%23000000;}.layer_201_0{stroke:%2300ee00;fill:url(%23pat-layer_201_0);fill-opacity:0.492;}.label_201_0{fill:%2300ee00;}.layer_401_0{stroke:%236a8ad2;fill:url(%23pat-layer_401_0);fill-opacity:0.492;}.label_401_0{fill:%236a8ad2;}.layer_202_0{stroke:%23007600;fill:url(%23pat-layer_202_0);fill-opacity:0.492;}.label_202_0{fill:%23007600;}.layer_68_0{stroke:%23008000;fill:url(%23pat-layer_68_0);fill-opacity:0.492;}.label_68_0{fill:%23008000;}.layer_5_0{stroke:%236a8ad2;fill:url(%23pat-layer_5_0);fill-opacity:0.492;}.label_5_0{fill:%236a8ad2;}.layer_998_0{stroke:%23000000;fill:none;}.label_998_0{fill:%23000000;}.layer_312_1{stroke:%2300b8b8;fill:url(%23pat-layer_312_1);fill-opacity:0.492;}.label_312_1{fill:%2300b8b8;}.layer_312_0{stroke:%2300b8b8;fill:url(%23pat-layer_312_0);fill-opacity:0.492;}.label_312_0{fill:%2300b8b8;}.layer_402_0{stroke:%23ff0000;fill:url(%23pat-layer_402_0);fill-opacity:0.492;}.label_402_0{fill:%23ff0000;}.layer_401_4{stroke:%236a8ad2;fill:url(%23pat-layer_401_4);fill-opacity:0.492;}.label_401_4{fill:%236a8ad2;}.layer_389_0{stroke:%23ff00ff;fill:url(%23pat-layer_389_0);fill-opacity:0.492;}.label_389_0{fill:%23ff00ff;}.layer_402_1{stroke:%23ff0000;fill:url(%23pat-layer_402_1);fill-opacity:0.492;}.label_402_1{fill:%23ff0000;}.layer_350_1{stroke:%23697a00;fill:url(%23pat-layer_350_1);fill-opacity:0.492;}.label_350_1{fill:%23697a00;}.layer_401_1{stroke:%236a8ad2;fill:url(%23pat-layer_401_1);fill-opacity:0.492;}.label_401_1{fill:%236a8ad2;}.layer_313_2{stroke:%2301d95b;fill:url(%23pat-layer_313_2);fill-opacity:0.492;}.label_313_2{fill:%2301d95b;}.layer_313_1{stroke:%2301d95b;fill:url(%23pat-layer_313_1);fill-opacity:0.492;}.label_313_1{fill:%2301d95b;}.layer_313_0{stroke:%2301d95b;fill:url(%23pat-layer_313_0);fill-opacity:0.492;}.label_313_0{fill:%2301d95b;}.layer_400_0{stroke:%23a96868;fill:url(%23pat-layer_400_0);fill-opacity:0.492;}.label_400_0{fill:%23a96868;}.layer_312_3{stroke:%2300b8b8;fill:url(%23pat-layer_312_3);fill-opacity:0.492;}.label_312_3{fill:%2300b8b8;}.layer_389_1{stroke:%23ff00ff;fill:url(%23pat-layer_389_1);fill-opacity:0.492;}.label_389_1{fill:%23ff00ff;}.layer_401_3{stroke:%236a8ad2;fill:url(%23pat-layer_401_3);fill-opacity:0.492;}.label_401_3{fill:%236a8ad2;}.layer_403_2{stroke:%23500080;fill:url(%23pat-layer_403_2);fill-opacity:0.492;}.label_403_2{fill:%23500080;}.layer_403_3{stroke:%23500080;fill:url(%23pat-layer_403_3);fill-opacity:0.492;}.label_403_3{fill:%23500080;}.layer_403_1{stroke:%23500080;fill:url(%23pat-layer_403_1);fill-opacity:0.492;}.label_403_1{fill:%23500080;}.layer_403_0{stroke:%23500080;fill:url(%23pat-layer_403_0);fill-opacity:0.492;}.label_403_0{fill:%23500080;}.layer_311_1{stroke:%23ac6c56;fill:url(%23pat-layer_311_1);fill-opacity:0.492;}.label_311_1{fill:%23ac6c56;}.layer_311_0{stroke:%23ac6c56;fill:url(%23pat-layer_311_0);fill-opacity:0.492;}.label_311_0{fill:%23ac6c56;}.layer_301_1{stroke:%23800057;fill:url(%23pat-layer_301_1);fill-opacity:0.492;}.label_301_1{fill:%23800057;}.layer_301_0{stroke:%23800057;fill:url(%23pat-layer_301_0);fill-opacity:0.492;}.label_301_0{fill:%23800057;}.layer_305_1{stroke:%23808080;fill:url(%23pat-layer_305_1);fill-opacity:0.492;}.label_305_1{fill:%23808080;}.layer_305_0{stroke:%23808080;fill:url(%23pat-layer_305_0);fill-opacity:0.492;}.label_305_0{fill:%23808080;}.layer_999_0{stroke:%230000ff;fill:url(%23pat-layer_999_0);fill-opacity:0.492;}.label_999_0{fill:%230000ff;}.layer_81_0{stroke:%23808080;fill:url(%23pat-layer_81_0);fill-opacity:0.492;}.label_81_0{fill:%23808080;}.layer_290_0{stroke:%23a46eda;fill:none;}.label_290_0{fill:%23a46eda;}.layer_205_0{stroke:%2349b203;fill:url(%23pat-layer_205_0);fill-opacity:0.492;}.label_205_0{fill:%2349b203;}.layer_11_0{stroke:%230000ff;fill:url(%23pat-layer_11_0);fill-opacity:0.492;}.label_11_0{fill:%230000ff;}.layer_12_0{stroke:%23a57b00;fill:url(%23pat-layer_12_0);fill-opacity:0.492;}.label_12_0{fill:%23a57b00;}.layer_13_0{stroke:%23800057;fill:url(%23pat-layer_13_0);fill-opacity:0.492;}.label_13_0{fill:%23800057;}.layer_6_0{stroke:%23ff0000;fill:url(%23pat-layer_6_0);fill-opacity:0.492;}.label_6_0{fill:%23ff0000;}.layer_1_10{stroke:%23c96585;fill:url(%23pat-layer_1_10);fill-opacity:0.492;}.label_1_10{fill:%23c96585;}.layer_1_11{stroke:%23800000;fill:url(%23pat-layer_1_11);fill-opacity:0.492;}.label_1_11{fill:%23800000;}.layer_200_0{stroke:%23ff0000;fill:url(%23pat-layer_200_0);fill-opacity:0.492;}.label_200_0{fill:%23ff0000;}.layer_1_0{stroke:%23c96585;fill:url(%23pat-layer_1_0);fill-opacity:0.492;}.label_1_0{fill:%23c96585;}.layer_2_0{stroke:%23a46eda;fill:url(%23pat-layer_2_0);fill-opacity:0.492;}.label_2_0{fill:%23a46eda;}.layer_20_0{stroke:%2353793d;fill:url(%23pat-layer_20_0);fill-opacity:0.492;}.label_20_0{fill:%2353793d;}.layer_22_0{stroke:%23ec7600;fill:url(%23pat-layer_22_0);fill-opacity:0.492;}.label_22_0{fill:%23ec7600;}.layer_24_0{stroke:%2300b8b8;fill:url(%23pat-layer_24_0);fill-opacity:0.492;}.label_24_0{fill:%2300b8b8;}.layer_21_0{stroke:%23736264;fill:url(%23pat-layer_21_0);fill-opacity:0.492;}.label_21_0{fill:%23736264;}.layer_23_0{stroke:%23697a00;fill:url(%23pat-layer_23_0);fill-opacity:0.492;}.label_23_0{fill:%23697a00;}.layer_25_0{stroke:%23008000;fill:url(%23pat-layer_25_0);fill-opacity:0.492;}.label_25_0{fill:%23008000;}.layer_350_0{stroke:%23697a00;fill:url(%23pat-layer_350_0);fill-opacity:0.492;}.label_350_0{fill:%23697a00;}.layer_10_0{stroke:%23000000;fill:none;}.label_10_0{fill:%23000000;}.layer_203_0{stroke:%23008000;fill:url(%23pat-layer_203_0);fill-opacity:0.492;}.label_203_0{fill:%23008000;}.layer_40_0{stroke:%230000ff;fill:url(%23pat-layer_40_0);fill-opacity:0.492;}.label_40_0{fill:%230000ff;}.layer_401_2{stroke:%236a8ad2;fill:url(%23pat-layer_401_2);fill-opacity:0.492;}.label_401_2{fill:%236a8ad2;}.layer_301_2{stroke:%23800057;fill:url(%23pat-layer_301_2);fill-opacity:0.492;}.label_301_2{fill:%23800057;}</style><defs><path id=%22port-symbol%22 class=%22port%22 d=%22M 0,-0.132950 L 0.199425,0 0,0.132950%22 /><path id=%22ref-port-symbol%22 class=%22port%22 style=%22stroke-opacity:0.33;%22 d=%22M 0,-0.099713 C 0.132950,-0.099713 0.132950,0.099713 0,0.099713%22 /><circle id=%22port-bend-symbol%22 style=%22stroke-width:0;stroke:none;fill:%23805080;fill-opacity:1;%22 cx=%220%22 cy=%220%22 r=%220.059828%22 /><circle id=%22connection-symbol%22 style=%22stroke-width:0;stroke:none;fill:%23907090;fill-opacity:1;%22 cx=%220%22 cy=%220%22 r=%220.069799%22 /><pattern id=%22pat-layer_31_0%22 patternUnits=%22userSpaceOnUse%22 width=%220.166188%22 height=%220.166188%22 patternTransform=%22translate(0.127085,0.157441)%22><line x1=%220%22 y1=%220%22 x2=%220.166188%22 y2=%220.166188%22 style=%22stroke:%238c78ef;stroke-width:0.016619%22 /><line x1=%22-0.083094%22 y1=%220.083094%22 x2=%220.083094%22 y2=%220.249281%22 style=%22stroke:%238c78ef;stroke-width:0.016619%22 /><line x1=%220.083094%22 y1=%22-0.083094%22 x2=%220.249281%22 y2=%220.083094%22 style=%22stroke:%238c78ef;stroke-width:0.016619%22 /></pattern><pattern id=%22pat-layer_33_0%22 patternUnits=%22userSpaceOnUse%22 width=%220.166188%22 height=%220.166188%22 patternTransform=%22translate(0.097757,0.017493)%22><line x1=%220%22 y1=%220%22 x2=%220.166188%22 y2=%220.166188%22 style=%22stroke:%238c78ef;stroke-width:0.016619%22 /><line x1=%22-0.083094%22 y1=%220.083094%22 x2=%220.083094%22 y2=%220.249281%22 style=%22stroke:%238c78ef;stroke-width:0.016619%22 /><line x1=%220.083094%22 y1=%22-0.083094%22 x2=%220.249281%22 y2=%220.083094%22 style=%22stroke:%238c78ef;stroke-width:0.016619%22 /></pattern><pattern id=%22pat-layer_102_0%22 patternUnits=%22userSpaceOnUse%22 width=%220.166188%22 height=%220.166188%22 patternTransform=%22translate(0.000000,0.008747)%22><line x1=%220%22 y1=%220%22 x2=%220.166188%22 y2=%220.166188%22 style=%22stroke:%238c78ef;stroke-width:0.016619%22 /><line x1=%22-0.083094%22 y1=%220.083094%22 x2=%220.083094%22 y2=%220.249281%22 style=%22stroke:%238c78ef;stroke-width:0.016619%22 /><line x1=%220.083094%22 y1=%22-0.083094%22 x2=%220.249281%22 y2=%220.083094%22 style=%22stroke:%238c78ef;stroke-width:0.016619%22 /></pattern><pattern id=%22pat-layer_110_0%22 patternUnits=%22userSpaceOnUse%22 width=%220.166188%22 height=%220.166188%22 patternTransform=%22translate(0.048879,0.113707)%22><line x1=%220%22 y1=%220%22 x2=%220.166188%22 y2=%220.166188%22 style=%22stroke:%238c78ef;stroke-width:0.016619%22 /><line x1=%22-0.083094%22 y1=%220.083094%22 x2=%220.083094%22 y2=%220.249281%22 style=%22stroke:%238c78ef;stroke-width:0.016619%22 /><line x1=%220.083094%22 y1=%22-0.083094%22 x2=%220.249281%22 y2=%220.083094%22 style=%22stroke:%238c78ef;stroke-width:0.016619%22 /></pattern><pattern id=%22pat-layer_201_0%22 patternUnits=%22userSpaceOnUse%22 width=%220.166188%22 height=%220.166188%22 patternTransform=%22translate(0.127085,0.061227)%22><circle cx=%220.083094%22 cy=%220.083094%22 r=%220.016619%22 style=%22stroke:none;fill:%2300ee00;fill-opacity:1.0%22 /></pattern><pattern id=%22pat-layer_401_0%22 patternUnits=%22userSpaceOnUse%22 width=%220.099713%22 height=%220.099713%22 patternTransform=%22translate(0.011731,0.015744)%22><line x1=%220%22 y1=%220%22 x2=%220.099713%22 y2=%220.099713%22 style=%22stroke:%236a8ad2;stroke-width:0.016619%22 /><line x1=%22-0.049856%22 y1=%220.049856%22 x2=%220.049856%22 y2=%220.149569%22 style=%22stroke:%236a8ad2;stroke-width:0.016619%22 /><line x1=%220.049856%22 y1=%22-0.049856%22 x2=%220.149569%22 y2=%220.049856%22 style=%22stroke:%236a8ad2;stroke-width:0.016619%22 /><line x1=%220.099713%22 y1=%220%22 x2=%220%22 y2=%220.099713%22 style=%22stroke:%236a8ad2;stroke-width:0.016619%22 /><line x1=%220.149569%22 y1=%220.049856%22 x2=%220.049856%22 y2=%220.149569%22 style=%22stroke:%236a8ad2;stroke-width:0.016619%22 /><line x1=%220.049856%22 y1=%22-0.049856%22 x2=%22-0.049856%22 y2=%220.049856%22 style=%22stroke:%236a8ad2;stroke-width:0.016619%22 /></pattern><pattern id=%22pat-layer_202_0%22 patternUnits=%22userSpaceOnUse%22 width=%220.099713%22 height=%220.099713%22 patternTransform=%22translate(0.017596,0.094464)%22><circle cx=%220.049856%22 cy=%220.049856%22 r=%220.016619%22 style=%22stroke:none;fill:%23007600;fill-opacity:1.0%22 /></pattern><pattern id=%22pat-layer_68_0%22 patternUnits=%22userSpaceOnUse%22 width=%220.166188%22 height=%220.166188%22 patternTransform=%22translate(0.000000,0.061227)%22><circle cx=%220.083094%22 cy=%220.083094%22 r=%220.016619%22 style=%22stroke:none;fill:%23008000;fill-opacity:1.0%22 /></pattern><pattern id=%22pat-layer_5_0%22 patternUnits=%22userSpaceOnUse%22 width=%220.099713%22 height=%220.099713%22 patternTransform=%22translate(0.005865,0.089216)%22><line x1=%220.049856%22 y1=%220%22 x2=%220.049856%22 y2=%220.099713%22 style=%22stroke:%236a8ad2;stroke-width:0.016619%22 /></pattern><pattern id=%22pat-layer_312_1%22 patternUnits=%22userSpaceOnUse%22 width=%220.099713%22 height=%220.099713%22 patternTransform=%22translate(0.023462,0.078720)%22><line x1=%220%22 y1=%220%22 x2=%220.099713%22 y2=%220.099713%22 style=%22stroke:%2300b8b8;stroke-width:0.016619%22 /><line x1=%22-0.049856%22 y1=%220.049856%22 x2=%220.049856%22 y2=%220.149569%22 style=%22stroke:%2300b8b8;stroke-width:0.016619%22 /><line x1=%220.049856%22 y1=%22-0.049856%22 x2=%220.149569%22 y2=%220.049856%22 style=%22stroke:%2300b8b8;stroke-width:0.016619%22 /></pattern><pattern id=%22pat-layer_312_0%22 patternUnits=%22userSpaceOnUse%22 width=%220.166188%22 height=%220.166188%22 patternTransform=%22translate(0.078206,0.104961)%22><line x1=%220.083094%22 y1=%220%22 x2=%220.083094%22 y2=%220.166188%22 style=%22stroke:%2300b8b8;stroke-width:0.016619%22 /></pattern><pattern id=%22pat-layer_402_0%22 patternUnits=%22userSpaceOnUse%22 width=%220.166188%22 height=%220.166188%22 patternTransform=%22translate(0.087982,0.122454)%22><line x1=%220.083094%22 y1=%220%22 x2=%220.083094%22 y2=%220.166188%22 style=%22stroke:%23ff0000;stroke-width:0.016619%22 /><line x1=%220%22 y1=%220.083094%22 x2=%220.166188%22 y2=%220.083094%22 style=%22stroke:%23ff0000;stroke-width:0.016619%22 /></pattern><pattern id=%22pat-layer_401_4%22 patternUnits=%22userSpaceOnUse%22 width=%220.099713%22 height=%220.099713%22 patternTransform=%22translate(0.017596,0.078720)%22><line x1=%220.049856%22 y1=%220%22 x2=%220.049856%22 y2=%220.099713%22 style=%22stroke:%236a8ad2;stroke-width:0.016619%22 /></pattern><pattern id=%22pat-layer_389_0%22 patternUnits=%22userSpaceOnUse%22 width=%220.099713%22 height=%220.099713%22 patternTransform=%22translate(0.017596,0.020992)%22><line x1=%220.049856%22 y1=%220%22 x2=%220.049856%22 y2=%220.099713%22 style=%22stroke:%23ff00ff;stroke-width:0.016619%22 /><line x1=%220%22 y1=%220.049856%22 x2=%220.099713%22 y2=%220.049856%22 style=%22stroke:%23ff00ff;stroke-width:0.016619%22 /></pattern><pattern id=%22pat-layer_402_1%22 patternUnits=%22userSpaceOnUse%22 width=%220.099713%22 height=%220.099713%22 patternTransform=%22translate(0.029327,0.089216)%22><line x1=%220%22 y1=%220%22 x2=%220.099713%22 y2=%220.099713%22 style=%22stroke:%23ff0000;stroke-width:0.016619%22 /><line x1=%22-0.049856%22 y1=%220.049856%22 x2=%220.049856%22 y2=%220.149569%22 style=%22stroke:%23ff0000;stroke-width:0.016619%22 /><line x1=%220.049856%22 y1=%22-0.049856%22 x2=%220.149569%22 y2=%220.049856%22 style=%22stroke:%23ff0000;stroke-width:0.016619%22 /><line x1=%220.099713%22 y1=%220%22 x2=%220%22 y2=%220.099713%22 style=%22stroke:%23ff0000;stroke-width:0.016619%22 /><line x1=%220.149569%22 y1=%220.049856%22 x2=%220.049856%22 y2=%220.149569%22 style=%22stroke:%23ff0000;stroke-width:0.016619%22 /><line x1=%220.049856%22 y1=%22-0.049856%22 x2=%22-0.049856%22 y2=%220.049856%22 style=%22stroke:%23ff0000;stroke-width:0.016619%22 /></pattern><pattern id=%22pat-layer_350_1%22 patternUnits=%22userSpaceOnUse%22 width=%220.099713%22 height=%220.099713%22 patternTransform=%22translate(0.087982,0.078720)%22><circle cx=%220.049856%22 cy=%220.049856%22 r=%220.016619%22 style=%22stroke:none;fill:%23697a00;fill-opacity:1.0%22 /></pattern><pattern id=%22pat-layer_401_1%22 patternUnits=%22userSpaceOnUse%22 width=%220.166188%22 height=%220.166188%22 patternTransform=%22translate(0.146636,0.052480)%22><line x1=%220%22 y1=%220%22 x2=%220.166188%22 y2=%220.166188%22 style=%22stroke:%236a8ad2;stroke-width:0.016619%22 /><line x1=%22-0.083094%22 y1=%220.083094%22 x2=%220.083094%22 y2=%220.249281%22 style=%22stroke:%236a8ad2;stroke-width:0.016619%22 /><line x1=%220.083094%22 y1=%22-0.083094%22 x2=%220.249281%22 y2=%220.083094%22 style=%22stroke:%236a8ad2;stroke-width:0.016619%22 /><line x1=%220.166188%22 y1=%220%22 x2=%220%22 y2=%220.166188%22 style=%22stroke:%236a8ad2;stroke-width:0.016619%22 /><line x1=%220.249281%22 y1=%220.083094%22 x2=%220.083094%22 y2=%220.249281%22 style=%22stroke:%236a8ad2;stroke-width:0.016619%22 /><line x1=%220.083094%22 y1=%22-0.083094%22 x2=%22-0.083094%22 y2=%220.083094%22 style=%22stroke:%236a8ad2;stroke-width:0.016619%22 /></pattern><pattern id=%22pat-layer_313_2%22 patternUnits=%22userSpaceOnUse%22 width=%220.099713%22 height=%220.099713%22 patternTransform=%22translate(0.041058,0.052480)%22><line x1=%220%22 y1=%220%22 x2=%220.099713%22 y2=%220.099713%22 style=%22stroke:%2301d95b;stroke-width:0.016619%22 /><line x1=%22-0.049856%22 y1=%220.049856%22 x2=%220.049856%22 y2=%220.149569%22 style=%22stroke:%2301d95b;stroke-width:0.016619%22 /><line x1=%220.049856%22 y1=%22-0.049856%22 x2=%220.149569%22 y2=%220.049856%22 style=%22stroke:%2301d95b;stroke-width:0.016619%22 /></pattern><pattern id=%22pat-layer_313_1%22 patternUnits=%22userSpaceOnUse%22 width=%220.166188%22 height=%220.166188%22 patternTransform=%22translate(0.107533,0.061227)%22><line x1=%220.083094%22 y1=%220%22 x2=%220.083094%22 y2=%220.166188%22 style=%22stroke:%2301d95b;stroke-width:0.016619%22 /></pattern><pattern id=%22pat-layer_313_0%22 patternUnits=%22userSpaceOnUse%22 width=%220.099713%22 height=%220.099713%22 patternTransform=%22translate(0.087982,0.020992)%22><line x1=%220.049856%22 y1=%220%22 x2=%220.049856%22 y2=%220.099713%22 style=%22stroke:%2301d95b;stroke-width:0.016619%22 /></pattern><pattern id=%22pat-layer_400_0%22 patternUnits=%22userSpaceOnUse%22 width=%220.166188%22 height=%220.166188%22 patternTransform=%22translate(0.117309,0.096214)%22><line x1=%220%22 y1=%220%22 x2=%220.166188%22 y2=%220.166188%22 style=%22stroke:%23a96868;stroke-width:0.016619%22 /><line x1=%22-0.083094%22 y1=%220.083094%22 x2=%220.083094%22 y2=%220.249281%22 style=%22stroke:%23a96868;stroke-width:0.016619%22 /><line x1=%220.083094%22 y1=%22-0.083094%22 x2=%220.249281%22 y2=%220.083094%22 style=%22stroke:%23a96868;stroke-width:0.016619%22 /><line x1=%220.166188%22 y1=%220%22 x2=%220%22 y2=%220.166188%22 style=%22stroke:%23a96868;stroke-width:0.016619%22 /><line x1=%220.249281%22 y1=%220.083094%22 x2=%220.083094%22 y2=%220.249281%22 style=%22stroke:%23a96868;stroke-width:0.016619%22 /><line x1=%220.083094%22 y1=%22-0.083094%22 x2=%22-0.083094%22 y2=%220.083094%22 style=%22stroke:%23a96868;stroke-width:0.016619%22 /></pattern><pattern id=%22pat-layer_312_3%22 patternUnits=%22userSpaceOnUse%22 width=%220.099713%22 height=%220.099713%22 patternTransform=%22translate(0.076251,0.010496)%22><line x1=%220.099713%22 y1=%220%22 x2=%220%22 y2=%220.099713%22 style=%22stroke:%2300b8b8;stroke-width:0.016619%22 /><line x1=%220.149569%22 y1=%220.049856%22 x2=%220.049856%22 y2=%220.149569%22 style=%22stroke:%2300b8b8;stroke-width:0.016619%22 /><line x1=%220.049856%22 y1=%22-0.049856%22 x2=%22-0.049856%22 y2=%220.049856%22 style=%22stroke:%2300b8b8;stroke-width:0.016619%22 /></pattern><pattern id=%22pat-layer_389_1%22 patternUnits=%22userSpaceOnUse%22 width=%220.166188%22 height=%220.166188%22 patternTransform=%22translate(0.156412,0.061227)%22><line x1=%220.083094%22 y1=%220%22 x2=%220.083094%22 y2=%220.166188%22 style=%22stroke:%23ff00ff;stroke-width:0.016619%22 /><line x1=%220%22 y1=%220.083094%22 x2=%220.166188%22 y2=%220.083094%22 style=%22stroke:%23ff00ff;stroke-width:0.016619%22 /></pattern><pattern id=%22pat-layer_401_3%22 patternUnits=%22userSpaceOnUse%22 width=%220.166188%22 height=%220.166188%22 patternTransform=%22translate(0.068430,0.104961)%22><line x1=%220%22 y1=%220.083094%22 x2=%220.166188%22 y2=%220.083094%22 style=%22stroke:%236a8ad2;stroke-width:0.016619%22 /></pattern><pattern id=%22pat-layer_403_2%22 patternUnits=%22userSpaceOnUse%22 width=%220.099713%22 height=%220.099713%22 patternTransform=%22translate(0.046924,0.062976)%22><line x1=%220%22 y1=%220%22 x2=%220.099713%22 y2=%220.099713%22 style=%22stroke:%23500080;stroke-width:0.016619%22 /><line x1=%22-0.049856%22 y1=%220.049856%22 x2=%220.049856%22 y2=%220.149569%22 style=%22stroke:%23500080;stroke-width:0.016619%22 /><line x1=%220.049856%22 y1=%22-0.049856%22 x2=%220.149569%22 y2=%220.049856%22 style=%22stroke:%23500080;stroke-width:0.016619%22 /><line x1=%220.099713%22 y1=%220%22 x2=%220%22 y2=%220.099713%22 style=%22stroke:%23500080;stroke-width:0.016619%22 /><line x1=%220.149569%22 y1=%220.049856%22 x2=%220.049856%22 y2=%220.149569%22 style=%22stroke:%23500080;stroke-width:0.016619%22 /><line x1=%220.049856%22 y1=%22-0.049856%22 x2=%22-0.049856%22 y2=%220.049856%22 style=%22stroke:%23500080;stroke-width:0.016619%22 /></pattern><pattern id=%22pat-layer_403_3%22 patternUnits=%22userSpaceOnUse%22 width=%220.166188%22 height=%220.166188%22 patternTransform=%22translate(0.039103,0.131201)%22><line x1=%220%22 y1=%220%22 x2=%220.166188%22 y2=%220.166188%22 style=%22stroke:%23500080;stroke-width:0.016619%22 /><line x1=%22-0.083094%22 y1=%220.083094%22 x2=%220.083094%22 y2=%220.249281%22 style=%22stroke:%23500080;stroke-width:0.016619%22 /><line x1=%220.083094%22 y1=%22-0.083094%22 x2=%220.249281%22 y2=%220.083094%22 style=%22stroke:%23500080;stroke-width:0.016619%22 /><line x1=%220.166188%22 y1=%220%22 x2=%220%22 y2=%220.166188%22 style=%22stroke:%23500080;stroke-width:0.016619%22 /><line x1=%220.249281%22 y1=%220.083094%22 x2=%220.083094%22 y2=%220.249281%22 style=%22stroke:%23500080;stroke-width:0.016619%22 /><line x1=%220.083094%22 y1=%22-0.083094%22 x2=%22-0.083094%22 y2=%220.083094%22 style=%22stroke:%23500080;stroke-width:0.016619%22 /></pattern><pattern id=%22pat-layer_403_1%22 patternUnits=%22userSpaceOnUse%22 width=%220.166188%22 height=%220.166188%22 patternTransform=%22translate(0.117309,0.078720)%22><line x1=%220.083094%22 y1=%220%22 x2=%220.083094%22 y2=%220.166188%22 style=%22stroke:%23500080;stroke-width:0.016619%22 /><line x1=%220%22 y1=%220.083094%22 x2=%220.166188%22 y2=%220.083094%22 style=%22stroke:%23500080;stroke-width:0.016619%22 /></pattern><pattern id=%22pat-layer_403_0%22 patternUnits=%22userSpaceOnUse%22 width=%220.099713%22 height=%220.099713%22 patternTransform=%22translate(0.093847,0.031488)%22><line x1=%220.049856%22 y1=%220%22 x2=%220.049856%22 y2=%220.099713%22 style=%22stroke:%23500080;stroke-width:0.016619%22 /><line x1=%220%22 y1=%220.049856%22 x2=%220.099713%22 y2=%220.049856%22 style=%22stroke:%23500080;stroke-width:0.016619%22 /></pattern><pattern id=%22pat-layer_311_1%22 patternUnits=%22userSpaceOnUse%22 width=%220.166188%22 height=%220.166188%22 patternTransform=%22translate(0.136860,0.034987)%22><line x1=%220%22 y1=%220%22 x2=%220.166188%22 y2=%220.166188%22 style=%22stroke:%23ac6c56;stroke-width:0.016619%22 /><line x1=%22-0.083094%22 y1=%220.083094%22 x2=%220.083094%22 y2=%220.249281%22 style=%22stroke:%23ac6c56;stroke-width:0.016619%22 /><line x1=%220.083094%22 y1=%22-0.083094%22 x2=%220.249281%22 y2=%220.083094%22 style=%22stroke:%23ac6c56;stroke-width:0.016619%22 /></pattern><pattern id=%22pat-layer_311_0%22 patternUnits=%22userSpaceOnUse%22 width=%220.099713%22 height=%220.099713%22 patternTransform=%22translate(0.005865,0.005248)%22><line x1=%220%22 y1=%220%22 x2=%220.099713%22 y2=%220.099713%22 style=%22stroke:%23ac6c56;stroke-width:0.016619%22 /><line x1=%22-0.049856%22 y1=%220.049856%22 x2=%220.049856%22 y2=%220.149569%22 style=%22stroke:%23ac6c56;stroke-width:0.016619%22 /><line x1=%220.049856%22 y1=%22-0.049856%22 x2=%220.149569%22 y2=%220.049856%22 style=%22stroke:%23ac6c56;stroke-width:0.016619%22 /></pattern><pattern id=%22pat-layer_301_1%22 patternUnits=%22userSpaceOnUse%22 width=%220.166188%22 height=%220.166188%22 patternTransform=%22translate(0.117309,0.069974)%22><line x1=%220%22 y1=%220.083094%22 x2=%220.166188%22 y2=%220.083094%22 style=%22stroke:%23800057;stroke-width:0.016619%22 /></pattern><pattern id=%22pat-layer_301_0%22 patternUnits=%22userSpaceOnUse%22 width=%220.099713%22 height=%220.099713%22 patternTransform=%22translate(0.093847,0.026240)%22><line x1=%220%22 y1=%220.049856%22 x2=%220.099713%22 y2=%220.049856%22 style=%22stroke:%23800057;stroke-width:0.016619%22 /></pattern><pattern id=%22pat-layer_305_1%22 patternUnits=%22userSpaceOnUse%22 width=%220.166188%22 height=%220.166188%22 patternTransform=%22translate(0.058654,0.122454)%22><line x1=%220.083094%22 y1=%220%22 x2=%220.083094%22 y2=%220.166188%22 style=%22stroke:%23808080;stroke-width:0.016619%22 /><line x1=%220%22 y1=%220.083094%22 x2=%220.166188%22 y2=%220.083094%22 style=%22stroke:%23808080;stroke-width:0.016619%22 /></pattern><pattern id=%22pat-layer_305_0%22 patternUnits=%22userSpaceOnUse%22 width=%220.099713%22 height=%220.099713%22 patternTransform=%22translate(0.058654,0.057728)%22><line x1=%220.049856%22 y1=%220%22 x2=%220.049856%22 y2=%220.099713%22 style=%22stroke:%23808080;stroke-width:0.016619%22 /><line x1=%220%22 y1=%220.049856%22 x2=%220.099713%22 y2=%220.049856%22 style=%22stroke:%23808080;stroke-width:0.016619%22 /></pattern><pattern id=%22pat-layer_999_0%22 patternUnits=%22userSpaceOnUse%22 width=%220.099713%22 height=%220.099713%22 patternTransform=%22translate(0.035193,0.036736)%22><line x1=%220.049856%22 y1=%220%22 x2=%220.049856%22 y2=%220.099713%22 style=%22stroke:%230000ff;stroke-width:0.016619%22 /></pattern><pattern id=%22pat-layer_81_0%22 patternUnits=%22userSpaceOnUse%22 width=%220.099713%22 height=%220.099713%22 patternTransform=%22translate(0.035193,0.089216)%22><line x1=%220.049856%22 y1=%220%22 x2=%220.049856%22 y2=%220.099713%22 style=%22stroke:%23808080;stroke-width:0.016619%22 /><line x1=%220%22 y1=%220.049856%22 x2=%220.099713%22 y2=%220.049856%22 style=%22stroke:%23808080;stroke-width:0.016619%22 /></pattern><pattern id=%22pat-layer_205_0%22 patternUnits=%22userSpaceOnUse%22 width=%220.099713%22 height=%220.099713%22 patternTransform=%22translate(0.041058,0.068224)%22><line x1=%220%22 y1=%220%22 x2=%220.099713%22 y2=%220.099713%22 style=%22stroke:%2349b203;stroke-width:0.016619%22 /><line x1=%22-0.049856%22 y1=%220.049856%22 x2=%220.049856%22 y2=%220.149569%22 style=%22stroke:%2349b203;stroke-width:0.016619%22 /><line x1=%220.049856%22 y1=%22-0.049856%22 x2=%220.149569%22 y2=%220.049856%22 style=%22stroke:%2349b203;stroke-width:0.016619%22 /><line x1=%220.099713%22 y1=%220%22 x2=%220%22 y2=%220.099713%22 style=%22stroke:%2349b203;stroke-width:0.016619%22 /><line x1=%220.149569%22 y1=%220.049856%22 x2=%220.049856%22 y2=%220.149569%22 style=%22stroke:%2349b203;stroke-width:0.016619%22 /><line x1=%220.049856%22 y1=%22-0.049856%22 x2=%22-0.049856%22 y2=%220.049856%22 style=%22stroke:%2349b203;stroke-width:0.016619%22 /></pattern><pattern id=%22pat-layer_11_0%22 patternUnits=%22userSpaceOnUse%22 width=%220.099713%22 height=%220.099713%22 patternTransform=%22translate(0.052789,0.036736)%22><line x1=%220.099713%22 y1=%220%22 x2=%220%22 y2=%220.099713%22 style=%22stroke:%230000ff;stroke-width:0.016619%22 /><line x1=%220.149569%22 y1=%220.049856%22 x2=%220.049856%22 y2=%220.149569%22 style=%22stroke:%230000ff;stroke-width:0.016619%22 /><line x1=%220.049856%22 y1=%22-0.049856%22 x2=%22-0.049856%22 y2=%220.049856%22 style=%22stroke:%230000ff;stroke-width:0.016619%22 /></pattern><pattern id=%22pat-layer_12_0%22 patternUnits=%22userSpaceOnUse%22 width=%220.099713%22 height=%220.099713%22 patternTransform=%22translate(0.093847,0.094464)%22><line x1=%220%22 y1=%220%22 x2=%220.099713%22 y2=%220.099713%22 style=%22stroke:%23a57b00;stroke-width:0.016619%22 /><line x1=%22-0.049856%22 y1=%220.049856%22 x2=%220.049856%22 y2=%220.149569%22 style=%22stroke:%23a57b00;stroke-width:0.016619%22 /><line x1=%220.049856%22 y1=%22-0.049856%22 x2=%220.149569%22 y2=%220.049856%22 style=%22stroke:%23a57b00;stroke-width:0.016619%22 /></pattern><pattern id=%22pat-layer_13_0%22 patternUnits=%22userSpaceOnUse%22 width=%220.099713%22 height=%220.099713%22 patternTransform=%22translate(0.035193,0.052480)%22><line x1=%220.099713%22 y1=%220%22 x2=%220%22 y2=%220.099713%22 style=%22stroke:%23800057;stroke-width:0.016619%22 /><line x1=%220.149569%22 y1=%220.049856%22 x2=%220.049856%22 y2=%220.149569%22 style=%22stroke:%23800057;stroke-width:0.016619%22 /><line x1=%220.049856%22 y1=%22-0.049856%22 x2=%22-0.049856%22 y2=%220.049856%22 style=%22stroke:%23800057;stroke-width:0.016619%22 /></pattern><pattern id=%22pat-layer_6_0%22 patternUnits=%22userSpaceOnUse%22 width=%220.166188%22 height=%220.166188%22 patternTransform=%22translate(0.078206,0.078720)%22><line x1=%220%22 y1=%220.083094%22 x2=%220.166188%22 y2=%220.083094%22 style=%22stroke:%23ff0000;stroke-width:0.016619%22 /></pattern><pattern id=%22pat-layer_1_10%22 patternUnits=%22userSpaceOnUse%22 width=%220.099713%22 height=%220.099713%22 patternTransform=%22translate(0.005865,0.015744)%22><line x1=%220%22 y1=%220%22 x2=%220.099713%22 y2=%220.099713%22 style=%22stroke:%23c96585;stroke-width:0.016619%22 /><line x1=%22-0.049856%22 y1=%220.049856%22 x2=%220.049856%22 y2=%220.149569%22 style=%22stroke:%23c96585;stroke-width:0.016619%22 /><line x1=%220.049856%22 y1=%22-0.049856%22 x2=%220.149569%22 y2=%220.049856%22 style=%22stroke:%23c96585;stroke-width:0.016619%22 /><line x1=%220.099713%22 y1=%220%22 x2=%220%22 y2=%220.099713%22 style=%22stroke:%23c96585;stroke-width:0.016619%22 /><line x1=%220.149569%22 y1=%220.049856%22 x2=%220.049856%22 y2=%220.149569%22 style=%22stroke:%23c96585;stroke-width:0.016619%22 /><line x1=%220.049856%22 y1=%22-0.049856%22 x2=%22-0.049856%22 y2=%220.049856%22 style=%22stroke:%23c96585;stroke-width:0.016619%22 /></pattern><pattern id=%22pat-layer_1_11%22 patternUnits=%22userSpaceOnUse%22 width=%220.166188%22 height=%220.166188%22 patternTransform=%22translate(0.136860,0.052480)%22><line x1=%220.083094%22 y1=%220%22 x2=%220.083094%22 y2=%220.166188%22 style=%22stroke:%23800000;stroke-width:0.016619%22 /><line x1=%220%22 y1=%220.083094%22 x2=%220.166188%22 y2=%220.083094%22 style=%22stroke:%23800000;stroke-width:0.016619%22 /></pattern><pattern id=%22pat-layer_200_0%22 patternUnits=%22userSpaceOnUse%22 width=%220.166188%22 height=%220.166188%22 patternTransform=%22translate(0.058654,0.131201)%22><line x1=%220%22 y1=%220%22 x2=%220.166188%22 y2=%220.166188%22 style=%22stroke:%23ff0000;stroke-width:0.016619%22 /><line x1=%22-0.083094%22 y1=%220.083094%22 x2=%220.083094%22 y2=%220.249281%22 style=%22stroke:%23ff0000;stroke-width:0.016619%22 /><line x1=%220.083094%22 y1=%22-0.083094%22 x2=%220.249281%22 y2=%220.083094%22 style=%22stroke:%23ff0000;stroke-width:0.016619%22 /><line x1=%220.166188%22 y1=%220%22 x2=%220%22 y2=%220.166188%22 style=%22stroke:%23ff0000;stroke-width:0.016619%22 /><line x1=%220.249281%22 y1=%220.083094%22 x2=%220.083094%22 y2=%220.249281%22 style=%22stroke:%23ff0000;stroke-width:0.016619%22 /><line x1=%220.083094%22 y1=%22-0.083094%22 x2=%22-0.083094%22 y2=%220.083094%22 style=%22stroke:%23ff0000;stroke-width:0.016619%22 /></pattern><pattern id=%22pat-layer_1_0%22 patternUnits=%22userSpaceOnUse%22 width=%220.099713%22 height=%220.099713%22 patternTransform=%22translate(0.041058,0.057728)%22><line x1=%220.099713%22 y1=%220%22 x2=%220%22 y2=%220.099713%22 style=%22stroke:%23c96585;stroke-width:0.016619%22 /><line x1=%220.149569%22 y1=%220.049856%22 x2=%220.049856%22 y2=%220.149569%22 style=%22stroke:%23c96585;stroke-width:0.016619%22 /><line x1=%220.049856%22 y1=%22-0.049856%22 x2=%22-0.049856%22 y2=%220.049856%22 style=%22stroke:%23c96585;stroke-width:0.016619%22 /></pattern><pattern id=%22pat-layer_2_0%22 patternUnits=%22userSpaceOnUse%22 width=%220.166188%22 height=%220.166188%22 patternTransform=%22translate(0.136860,0.026240)%22><line x1=%220%22 y1=%220%22 x2=%220.166188%22 y2=%220.166188%22 style=%22stroke:%23a46eda;stroke-width:0.016619%22 /><line x1=%22-0.083094%22 y1=%220.083094%22 x2=%220.083094%22 y2=%220.249281%22 style=%22stroke:%23a46eda;stroke-width:0.016619%22 /><line x1=%220.083094%22 y1=%22-0.083094%22 x2=%220.249281%22 y2=%220.083094%22 style=%22stroke:%23a46eda;stroke-width:0.016619%22 /></pattern><pattern id=%22pat-layer_20_0%22 patternUnits=%22userSpaceOnUse%22 width=%220.166188%22 height=%220.166188%22 patternTransform=%22translate(0.039103,0.096214)%22><line x1=%220%22 y1=%220.083094%22 x2=%220.166188%22 y2=%220.083094%22 style=%22stroke:%2353793d;stroke-width:0.016619%22 /></pattern><pattern id=%22pat-layer_22_0%22 patternUnits=%22userSpaceOnUse%22 width=%220.166188%22 height=%220.166188%22 patternTransform=%22translate(0.009776,0.122454)%22><line x1=%220%22 y1=%220%22 x2=%220.166188%22 y2=%220.166188%22 style=%22stroke:%23ec7600;stroke-width:0.016619%22 /><line x1=%22-0.083094%22 y1=%220.083094%22 x2=%220.083094%22 y2=%220.249281%22 style=%22stroke:%23ec7600;stroke-width:0.016619%22 /><line x1=%220.083094%22 y1=%22-0.083094%22 x2=%220.249281%22 y2=%220.083094%22 style=%22stroke:%23ec7600;stroke-width:0.016619%22 /><line x1=%220.166188%22 y1=%220%22 x2=%220%22 y2=%220.166188%22 style=%22stroke:%23ec7600;stroke-width:0.016619%22 /><line x1=%220.249281%22 y1=%220.083094%22 x2=%220.083094%22 y2=%220.249281%22 style=%22stroke:%23ec7600;stroke-width:0.016619%22 /><line x1=%220.083094%22 y1=%22-0.083094%22 x2=%22-0.083094%22 y2=%220.083094%22 style=%22stroke:%23ec7600;stroke-width:0.016619%22 /></pattern><pattern id=%22pat-layer_24_0%22 patternUnits=%22userSpaceOnUse%22 width=%220.166188%22 height=%220.166188%22 patternTransform=%22translate(0.146636,0.148694)%22><line x1=%220.083094%22 y1=%220%22 x2=%220.083094%22 y2=%220.166188%22 style=%22stroke:%2300b8b8;stroke-width:0.016619%22 /><line x1=%220%22 y1=%220.083094%22 x2=%220.166188%22 y2=%220.083094%22 style=%22stroke:%2300b8b8;stroke-width:0.016619%22 /></pattern><pattern id=%22pat-layer_21_0%22 patternUnits=%22userSpaceOnUse%22 width=%220.099713%22 height=%220.099713%22 patternTransform=%22translate(0.064520,0.015744)%22><line x1=%220%22 y1=%220.049856%22 x2=%220.099713%22 y2=%220.049856%22 style=%22stroke:%23736264;stroke-width:0.016619%22 /></pattern><pattern id=%22pat-layer_23_0%22 patternUnits=%22userSpaceOnUse%22 width=%220.099713%22 height=%220.099713%22 patternTransform=%22translate(0.046924,0.031488)%22><line x1=%220%22 y1=%220%22 x2=%220.099713%22 y2=%220.099713%22 style=%22stroke:%23697a00;stroke-width:0.016619%22 /><line x1=%22-0.049856%22 y1=%220.049856%22 x2=%220.049856%22 y2=%220.149569%22 style=%22stroke:%23697a00;stroke-width:0.016619%22 /><line x1=%220.049856%22 y1=%22-0.049856%22 x2=%220.149569%22 y2=%220.049856%22 style=%22stroke:%23697a00;stroke-width:0.016619%22 /><line x1=%220.099713%22 y1=%220%22 x2=%220%22 y2=%220.099713%22 style=%22stroke:%23697a00;stroke-width:0.016619%22 /><line x1=%220.149569%22 y1=%220.049856%22 x2=%220.049856%22 y2=%220.149569%22 style=%22stroke:%23697a00;stroke-width:0.016619%22 /><line x1=%220.049856%22 y1=%22-0.049856%22 x2=%22-0.049856%22 y2=%220.049856%22 style=%22stroke:%23697a00;stroke-width:0.016619%22 /></pattern><pattern id=%22pat-layer_25_0%22 patternUnits=%22userSpaceOnUse%22 width=%220.099713%22 height=%220.099713%22 patternTransform=%22translate(0.029327,0.047232)%22><line x1=%220.049856%22 y1=%220%22 x2=%220.049856%22 y2=%220.099713%22 style=%22stroke:%23008000;stroke-width:0.016619%22 /><line x1=%220%22 y1=%220.049856%22 x2=%220.099713%22 y2=%220.049856%22 style=%22stroke:%23008000;stroke-width:0.016619%22 /></pattern><pattern id=%22pat-layer_350_0%22 patternUnits=%22userSpaceOnUse%22 width=%220.166188%22 height=%220.166188%22 patternTransform=%22translate(0.019551,0.104961)%22><line x1=%220.166188%22 y1=%220%22 x2=%220%22 y2=%220.166188%22 style=%22stroke:%23697a00;stroke-width:0.016619%22 /><line x1=%220.249281%22 y1=%220.083094%22 x2=%220.083094%22 y2=%220.249281%22 style=%22stroke:%23697a00;stroke-width:0.016619%22 /><line x1=%220.083094%22 y1=%22-0.083094%22 x2=%22-0.083094%22 y2=%220.083094%22 style=%22stroke:%23697a00;stroke-width:0.016619%22 /></pattern><pattern id=%22pat-layer_203_0%22 patternUnits=%22userSpaceOnUse%22 width=%220.166188%22 height=%220.166188%22 patternTransform=%22translate(0.097757,0.087467)%22><line x1=%220.166188%22 y1=%220%22 x2=%220%22 y2=%220.166188%22 style=%22stroke:%23008000;stroke-width:0.016619%22 /><line x1=%220.249281%22 y1=%220.083094%22 x2=%220.083094%22 y2=%220.249281%22 style=%22stroke:%23008000;stroke-width:0.016619%22 /><line x1=%220.083094%22 y1=%22-0.083094%22 x2=%22-0.083094%22 y2=%220.083094%22 style=%22stroke:%23008000;stroke-width:0.016619%22 /></pattern><pattern id=%22pat-layer_40_0%22 patternUnits=%22userSpaceOnUse%22 width=%220.166188%22 height=%220.166188%22 patternTransform=%22translate(0.078206,0.026240)%22><circle cx=%220.083094%22 cy=%220.083094%22 r=%220.016619%22 style=%22stroke:none;fill:%230000ff;fill-opacity:1.0%22 /></pattern><pattern id=%22pat-layer_401_2%22 patternUnits=%22userSpaceOnUse%22 width=%220.099713%22 height=%220.099713%22 patternTransform=%22translate(0.064520,0.047232)%22><line x1=%220%22 y1=%220.049856%22 x2=%220.099713%22 y2=%220.049856%22 style=%22stroke:%236a8ad2;stroke-width:0.016619%22 /></pattern><pattern id=%22pat-layer_301_2%22 patternUnits=%22userSpaceOnUse%22 width=%220.099713%22 height=%220.099713%22 patternTransform=%22translate(0.046924,0.057728)%22><line x1=%220.049856%22 y1=%220%22 x2=%220.049856%22 y2=%220.099713%22 style=%22stroke:%23800057;stroke-width:0.016619%22 /></pattern><g id=%22C1%22 data-name=%22SWG Period%22><rect class=%22layer_1_0%22 x=%220.000000%22 y=%22-0.277500%22 width=%220.120000%22 height=%220.555000%22 /><rect class=%22layer_1_0%22 x=%220.120000%22 y=%22-0.277500%22 width=%220.120000%22 height=%220.425000%22 /></g></defs><g transform=%22scale(1 -1)%22><g id=%22C0%22 data-name=%22PBS%22><use transform=%22translate(0.000000 0.000000)%22 href=%22%23C1%22 /><use transform=%22translate(0.240000 0.000000)%22 href=%22%23C1%22 /><use transform=%22translate(0.480000 0.000000)%22 href=%22%23C1%22 /><use transform=%22translate(0.720000 0.000000)%22 href=%22%23C1%22 /><use transform=%22translate(0.960000 0.000000)%22 href=%22%23C1%22 /><use transform=%22translate(1.200000 0.000000)%22 href=%22%23C1%22 /><use transform=%22translate(1.440000 0.000000)%22 href=%22%23C1%22 /><use transform=%22translate(1.680000 0.000000)%22 href=%22%23C1%22 /><use transform=%22translate(1.920000 0.000000)%22 href=%22%23C1%22 /><use transform=%22translate(2.160000 0.000000)%22 href=%22%23C1%22 /><use transform=%22translate(2.400000 0.000000)%22 href=%22%23C1%22 /><use transform=%22translate(2.640000 0.000000)%22 href=%22%23C1%22 /><use transform=%22translate(2.880000 0.000000)%22 href=%22%23C1%22 /><use transform=%22translate(3.120000 0.000000)%22 href=%22%23C1%22 /><use transform=%22translate(3.360000 0.000000)%22 href=%22%23C1%22 /><use transform=%22translate(3.600000 0.000000)%22 href=%22%23C1%22 /><use transform=%22translate(3.840000 0.000000)%22 href=%22%23C1%22 /><use transform=%22translate(4.080000 0.000000)%22 href=%22%23C1%22 /><use transform=%22translate(4.320000 0.000000)%22 href=%22%23C1%22 /><use transform=%22translate(4.560000 0.000000)%22 href=%22%23C1%22 /><use transform=%22translate(4.800000 0.000000)%22 href=%22%23C1%22 /><use transform=%22translate(5.040000 0.000000)%22 href=%22%23C1%22 /><use transform=%22translate(5.280000 0.000000)%22 href=%22%23C1%22 /><use transform=%22translate(5.520000 0.000000)%22 href=%22%23C1%22 /><use transform=%22translate(5.760000 0.000000)%22 href=%22%23C1%22 /><use transform=%22translate(6.000000 0.000000)%22 href=%22%23C1%22 /><use transform=%22translate(6.240000 0.000000)%22 href=%22%23C1%22 /><use transform=%22translate(6.480000 0.000000)%22 href=%22%23C1%22 /><use transform=%22translate(6.720000 0.000000)%22 href=%22%23C1%22 /><use transform=%22translate(6.960000 0.000000)%22 href=%22%23C1%22 /><path class=%22layer_1_0%22 d=%22M -1.000000,0.478000 7.200000,0.478000 7.481000,0.485000 7.761000,0.508000 8.039000,0.545000 8.315000,0.598000 8.588000,0.665000 8.857000,0.746000 9.121000,0.842000 9.380000,0.952000 9.632000,1.076000 9.877000,1.213000 10.115000,1.363000 10.344000,1.526000 10.552000,1.673000 10.768000,1.809000 10.991000,1.934000 11.220000,2.046000 11.455000,2.146000 11.695000,2.233000 11.939000,2.307000 12.187000,2.368000 12.438000,2.416000 12.690000,2.450000 12.945000,2.471000 13.200000,2.478000 13.200000,2.958000 12.919000,2.950000 12.639000,2.927000 12.361000,2.890000 12.085000,2.837000 11.812000,2.770000 11.543000,2.689000 11.279000,2.593000 11.020000,2.483000 10.768000,2.359000 10.523000,2.222000 10.285000,2.072000 10.056000,1.910000 9.848000,1.762000 9.632000,1.626000 9.409000,1.501000 9.180000,1.389000 8.945000,1.289000 8.705000,1.202000 8.461000,1.128000 8.213000,1.067000 7.962000,1.019000 7.710000,0.985000 7.455000,0.964000 7.200000,0.958000 -1.000000,0.958000 z%22 /><rect class=%22layer_1_0%22 x=%227.200000%22 y=%22-0.277500%22 width=%226.100000%22 height=%220.555000%22 /><g transform=%22translate(-1.000000 0.718000) rotate(0.000000)%22><path class=%22port%22 d=%22M 0,-1.250000 V 1.250000%22 /><use href=%22%23port-symbol%22 /></g><text class=%22label%22 text-anchor=%22start%22 dominant-baseline=%22text-after-edge%22 x=%22-1.000000%22 y=%22-0.718000%22>P0</text><g transform=%22translate(13.200000 2.718000) rotate(180.000000)%22><path class=%22port%22 d=%22M 0,-1.250000 V 1.250000%22 /><use href=%22%23port-symbol%22 /></g><text class=%22label%22 text-anchor=%22end%22 dominant-baseline=%22text-before-edge%22 x=%2213.200000%22 y=%22-2.718000%22>P1</text><g transform=%22translate(13.300000 0.000500) rotate(180.000000)%22><path class=%22port%22 d=%22M 0,-1.250000 V 1.250000%22 /><use href=%22%23port-symbol%22 /></g><text class=%22label%22 text-anchor=%22end%22 dominant-baseline=%22text-before-edge%22 x=%2213.300000%22 y=%22-0.000500%22>P2</text></g></g></svg>)
%22><rect x=%22-30.00%22 y=%22-30.00%22 width=%2260.00%22 height=%2260.00%22 fill=%22%23f4f5f7%22 stroke=%22%23232530%22 stroke-width=%221%22/></g><text x=%220.00%22 y=%22-1740.00%22 font-size=%226.5%22 fill=%22%23232530%22 font-weight=%22400%22 text-anchor=%22middle%22 dominant-baseline=%22middle%22 stroke=%22%23ffffff%22 stroke-width=%222.27%22 stroke-linejoin=%22round%22 paint-order=%22stroke%22>SWG Period</text><text x=%220.00%22 y=%22-1708.20%22 font-size=%229%22 fill=%22%23232530%22 font-weight=%22400%22 text-anchor=%22middle%22 dominant-baseline=%22hanging%22 stroke=%22%23ffffff%22 stroke-width=%223.15%22 stroke-linejoin=%22round%22 paint-order=%22stroke%22>SWG_Period_1[0]</text><g transform=%22matrix(1 -0 0 1 0.000 -1620.000)%22><rect x=%22-30.00%22 y=%22-30.00%22 width=%2260.00%22 height=%2260.00%22 fill=%22%23f4f5f7%22 stroke=%22%23232530%22 stroke-width=%221%22/></g><text x=%220.00%22 y=%22-1620.00%22 font-size=%226.5%22 fill=%22%23232530%22 font-weight=%22400%22 text-anchor=%22middle%22 dominant-baseline=%22middle%22 stroke=%22%23ffffff%22 stroke-width=%222.27%22 stroke-linejoin=%22round%22 paint-order=%22stroke%22>SWG Period</text><text x=%220.00%22 y=%22-1588.20%22 font-size=%229%22 fill=%22%23232530%22 font-weight=%22400%22 text-anchor=%22middle%22 dominant-baseline=%22hanging%22 stroke=%22%23ffffff%22 stroke-width=%223.15%22 stroke-linejoin=%22round%22 paint-order=%22stroke%22>SWG_Period_1[1]</text><g transform=%22matrix(1 -0 0 1 0.000 -1500.000)%22><rect x=%22-30.00%22 y=%22-30.00%22 width=%2260.00%22 height=%2260.00%22 fill=%22%23f4f5f7%22 stroke=%22%23232530%22 stroke-width=%221%22/></g><text x=%220.00%22 y=%22-1500.00%22 font-size=%226.5%22 fill=%22%23232530%22 font-weight=%22400%22 text-anchor=%22middle%22 dominant-baseline=%22middle%22 stroke=%22%23ffffff%22 stroke-width=%222.27%22 stroke-linejoin=%22round%22 paint-order=%22stroke%22>SWG Period</text><text x=%220.00%22 y=%22-1468.20%22 font-size=%229%22 fill=%22%23232530%22 font-weight=%22400%22 text-anchor=%22middle%22 dominant-baseline=%22hanging%22 stroke=%22%23ffffff%22 stroke-width=%223.15%22 stroke-linejoin=%22round%22 paint-order=%22stroke%22>SWG_Period_1[2]</text><g transform=%22matrix(1 -0 0 1 0.000 -1380.000)%22><rect x=%22-30.00%22 y=%22-30.00%22 width=%2260.00%22 height=%2260.00%22 fill=%22%23f4f5f7%22 stroke=%22%23232530%22 stroke-width=%221%22/></g><text x=%220.00%22 y=%22-1380.00%22 font-size=%226.5%22 fill=%22%23232530%22 font-weight=%22400%22 text-anchor=%22middle%22 dominant-baseline=%22middle%22 stroke=%22%23ffffff%22 stroke-width=%222.27%22 stroke-linejoin=%22round%22 paint-order=%22stroke%22>SWG Period</text><text x=%220.00%22 y=%22-1348.20%22 font-size=%229%22 fill=%22%23232530%22 font-weight=%22400%22 text-anchor=%22middle%22 dominant-baseline=%22hanging%22 stroke=%22%23ffffff%22 stroke-width=%223.15%22 stroke-linejoin=%22round%22 paint-order=%22stroke%22>SWG_Period_1[3]</text><g transform=%22matrix(1 -0 0 1 0.000 -1260.000)%22><rect x=%22-30.00%22 y=%22-30.00%22 width=%2260.00%22 height=%2260.00%22 fill=%22%23f4f5f7%22 stroke=%22%23232530%22 stroke-width=%221%22/></g><text x=%220.00%22 y=%22-1260.00%22 font-size=%226.5%22 fill=%22%23232530%22 font-weight=%22400%22 text-anchor=%22middle%22 dominant-baseline=%22middle%22 stroke=%22%23ffffff%22 stroke-width=%222.27%22 stroke-linejoin=%22round%22 paint-order=%22stroke%22>SWG Period</text><text x=%220.00%22 y=%22-1228.20%22 font-size=%229%22 fill=%22%23232530%22 font-weight=%22400%22 text-anchor=%22middle%22 dominant-baseline=%22hanging%22 stroke=%22%23ffffff%22 stroke-width=%223.15%22 stroke-linejoin=%22round%22 paint-order=%22stroke%22>SWG_Period_1[4]</text><g transform=%22matrix(1 -0 0 1 0.000 -1140.000)%22><rect x=%22-30.00%22 y=%22-30.00%22 width=%2260.00%22 height=%2260.00%22 fill=%22%23f4f5f7%22 stroke=%22%23232530%22 stroke-width=%221%22/></g><text x=%220.00%22 y=%22-1140.00%22 font-size=%226.5%22 fill=%22%23232530%22 font-weight=%22400%22 text-anchor=%22middle%22 dominant-baseline=%22middle%22 stroke=%22%23ffffff%22 stroke-width=%222.27%22 stroke-linejoin=%22round%22 paint-order=%22stroke%22>SWG Period</text><text x=%220.00%22 y=%22-1108.20%22 font-size=%229%22 fill=%22%23232530%22 font-weight=%22400%22 text-anchor=%22middle%22 dominant-baseline=%22hanging%22 stroke=%22%23ffffff%22 stroke-width=%223.15%22 stroke-linejoin=%22round%22 paint-order=%22stroke%22>SWG_Period_1[5]</text><g transform=%22matrix(1 -0 0 1 0.000 -1020.000)%22><rect x=%22-30.00%22 y=%22-30.00%22 width=%2260.00%22 height=%2260.00%22 fill=%22%23f4f5f7%22 stroke=%22%23232530%22 stroke-width=%221%22/></g><text x=%220.00%22 y=%22-1020.00%22 font-size=%226.5%22 fill=%22%23232530%22 font-weight=%22400%22 text-anchor=%22middle%22 dominant-baseline=%22middle%22 stroke=%22%23ffffff%22 stroke-width=%222.27%22 stroke-linejoin=%22round%22 paint-order=%22stroke%22>SWG Period</text><text x=%220.00%22 y=%22-988.20%22 font-size=%229%22 fill=%22%23232530%22 font-weight=%22400%22 text-anchor=%22middle%22 dominant-baseline=%22hanging%22 stroke=%22%23ffffff%22 stroke-width=%223.15%22 stroke-linejoin=%22round%22 paint-order=%22stroke%22>SWG_Period_1[6]</text><g transform=%22matrix(1 -0 0 1 0.000 -900.000)%22><rect x=%22-30.00%22 y=%22-30.00%22 width=%2260.00%22 height=%2260.00%22 fill=%22%23f4f5f7%22 stroke=%22%23232530%22 stroke-width=%221%22/></g><text x=%220.00%22 y=%22-900.00%22 font-size=%226.5%22 fill=%22%23232530%22 font-weight=%22400%22 text-anchor=%22middle%22 dominant-baseline=%22middle%22 stroke=%22%23ffffff%22 stroke-width=%222.27%22 stroke-linejoin=%22round%22 paint-order=%22stroke%22>SWG Period</text><text x=%220.00%22 y=%22-868.20%22 font-size=%229%22 fill=%22%23232530%22 font-weight=%22400%22 text-anchor=%22middle%22 dominant-baseline=%22hanging%22 stroke=%22%23ffffff%22 stroke-width=%223.15%22 stroke-linejoin=%22round%22 paint-order=%22stroke%22>SWG_Period_1[7]</text><g transform=%22matrix(1 -0 0 1 0.000 -780.000)%22><rect x=%22-30.00%22 y=%22-30.00%22 width=%2260.00%22 height=%2260.00%22 fill=%22%23f4f5f7%22 stroke=%22%23232530%22 stroke-width=%221%22/></g><text x=%220.00%22 y=%22-780.00%22 font-size=%226.5%22 fill=%22%23232530%22 font-weight=%22400%22 text-anchor=%22middle%22 dominant-baseline=%22middle%22 stroke=%22%23ffffff%22 stroke-width=%222.27%22 stroke-linejoin=%22round%22 paint-order=%22stroke%22>SWG Period</text><text x=%220.00%22 y=%22-748.20%22 font-size=%229%22 fill=%22%23232530%22 font-weight=%22400%22 text-anchor=%22middle%22 dominant-baseline=%22hanging%22 stroke=%22%23ffffff%22 stroke-width=%223.15%22 stroke-linejoin=%22round%22 paint-order=%22stroke%22>SWG_Period_1[8]</text><g transform=%22matrix(1 -0 0 1 0.000 -660.000)%22><rect x=%22-30.00%22 y=%22-30.00%22 width=%2260.00%22 height=%2260.00%22 fill=%22%23f4f5f7%22 stroke=%22%23232530%22 stroke-width=%221%22/></g><text x=%220.00%22 y=%22-660.00%22 font-size=%226.5%22 fill=%22%23232530%22 font-weight=%22400%22 text-anchor=%22middle%22 dominant-baseline=%22middle%22 stroke=%22%23ffffff%22 stroke-width=%222.27%22 stroke-linejoin=%22round%22 paint-order=%22stroke%22>SWG Period</text><text x=%220.00%22 y=%22-628.20%22 font-size=%229%22 fill=%22%23232530%22 font-weight=%22400%22 text-anchor=%22middle%22 dominant-baseline=%22hanging%22 stroke=%22%23ffffff%22 stroke-width=%223.15%22 stroke-linejoin=%22round%22 paint-order=%22stroke%22>SWG_Period_1[9]</text><g transform=%22matrix(1 -0 0 1 0.000 -540.000)%22><rect x=%22-30.00%22 y=%22-30.00%22 width=%2260.00%22 height=%2260.00%22 fill=%22%23f4f5f7%22 stroke=%22%23232530%22 stroke-width=%221%22/></g><text x=%220.00%22 y=%22-540.00%22 font-size=%226.5%22 fill=%22%23232530%22 font-weight=%22400%22 text-anchor=%22middle%22 dominant-baseline=%22middle%22 stroke=%22%23ffffff%22 stroke-width=%222.27%22 stroke-linejoin=%22round%22 paint-order=%22stroke%22>SWG Period</text><text x=%220.00%22 y=%22-508.20%22 font-size=%229%22 fill=%22%23232530%22 font-weight=%22400%22 text-anchor=%22middle%22 dominant-baseline=%22hanging%22 stroke=%22%23ffffff%22 stroke-width=%223.15%22 stroke-linejoin=%22round%22 paint-order=%22stroke%22>SWG_Period_1[10]</text><g transform=%22matrix(1 -0 0 1 0.000 -420.000)%22><rect x=%22-30.00%22 y=%22-30.00%22 width=%2260.00%22 height=%2260.00%22 fill=%22%23f4f5f7%22 stroke=%22%23232530%22 stroke-width=%221%22/></g><text x=%220.00%22 y=%22-420.00%22 font-size=%226.5%22 fill=%22%23232530%22 font-weight=%22400%22 text-anchor=%22middle%22 dominant-baseline=%22middle%22 stroke=%22%23ffffff%22 stroke-width=%222.27%22 stroke-linejoin=%22round%22 paint-order=%22stroke%22>SWG Period</text><text x=%220.00%22 y=%22-388.20%22 font-size=%229%22 fill=%22%23232530%22 font-weight=%22400%22 text-anchor=%22middle%22 dominant-baseline=%22hanging%22 stroke=%22%23ffffff%22 stroke-width=%223.15%22 stroke-linejoin=%22round%22 paint-order=%22stroke%22>SWG_Period_1[11]</text><g transform=%22matrix(1 -0 0 1 0.000 -300.000)%22><rect x=%22-30.00%22 y=%22-30.00%22 width=%2260.00%22 height=%2260.00%22 fill=%22%23f4f5f7%22 stroke=%22%23232530%22 stroke-width=%221%22/></g><text x=%220.00%22 y=%22-300.00%22 font-size=%226.5%22 fill=%22%23232530%22 font-weight=%22400%22 text-anchor=%22middle%22 dominant-baseline=%22middle%22 stroke=%22%23ffffff%22 stroke-width=%222.27%22 stroke-linejoin=%22round%22 paint-order=%22stroke%22>SWG Period</text><text x=%220.00%22 y=%22-268.20%22 font-size=%229%22 fill=%22%23232530%22 font-weight=%22400%22 text-anchor=%22middle%22 dominant-baseline=%22hanging%22 stroke=%22%23ffffff%22 stroke-width=%223.15%22 stroke-linejoin=%22round%22 paint-order=%22stroke%22>SWG_Period_1[12]</text><g transform=%22matrix(1 -0 0 1 0.000 -180.000)%22><rect x=%22-30.00%22 y=%22-30.00%22 width=%2260.00%22 height=%2260.00%22 fill=%22%23f4f5f7%22 stroke=%22%23232530%22 stroke-width=%221%22/></g><text x=%220.00%22 y=%22-180.00%22 font-size=%226.5%22 fill=%22%23232530%22 font-weight=%22400%22 text-anchor=%22middle%22 dominant-baseline=%22middle%22 stroke=%22%23ffffff%22 stroke-width=%222.27%22 stroke-linejoin=%22round%22 paint-order=%22stroke%22>SWG Period</text><text x=%220.00%22 y=%22-148.20%22 font-size=%229%22 fill=%22%23232530%22 font-weight=%22400%22 text-anchor=%22middle%22 dominant-baseline=%22hanging%22 stroke=%22%23ffffff%22 stroke-width=%223.15%22 stroke-linejoin=%22round%22 paint-order=%22stroke%22>SWG_Period_1[13]</text><g transform=%22matrix(1 -0 0 1 0.000 -60.000)%22><rect x=%22-30.00%22 y=%22-30.00%22 width=%2260.00%22 height=%2260.00%22 fill=%22%23f4f5f7%22 stroke=%22%23232530%22 stroke-width=%221%22/></g><text x=%220.00%22 y=%22-60.00%22 font-size=%226.5%22 fill=%22%23232530%22 font-weight=%22400%22 text-anchor=%22middle%22 dominant-baseline=%22middle%22 stroke=%22%23ffffff%22 stroke-width=%222.27%22 stroke-linejoin=%22round%22 paint-order=%22stroke%22>SWG Period</text><text x=%220.00%22 y=%22-28.20%22 font-size=%229%22 fill=%22%23232530%22 font-weight=%22400%22 text-anchor=%22middle%22 dominant-baseline=%22hanging%22 stroke=%22%23ffffff%22 stroke-width=%223.15%22 stroke-linejoin=%22round%22 paint-order=%22stroke%22>SWG_Period_1[14]</text><g transform=%22matrix(1 -0 0 1 0.000 60.000)%22><rect x=%22-30.00%22 y=%22-30.00%22 width=%2260.00%22 height=%2260.00%22 fill=%22%23f4f5f7%22 stroke=%22%23232530%22 stroke-width=%221%22/></g><text x=%220.00%22 y=%2260.00%22 font-size=%226.5%22 fill=%22%23232530%22 font-weight=%22400%22 text-anchor=%22middle%22 dominant-baseline=%22middle%22 stroke=%22%23ffffff%22 stroke-width=%222.27%22 stroke-linejoin=%22round%22 paint-order=%22stroke%22>SWG Period</text><text x=%220.00%22 y=%2291.80%22 font-size=%229%22 fill=%22%23232530%22 font-weight=%22400%22 text-anchor=%22middle%22 dominant-baseline=%22hanging%22 stroke=%22%23ffffff%22 stroke-width=%223.15%22 stroke-linejoin=%22round%22 paint-order=%22stroke%22>SWG_Period_1[15]</text><g transform=%22matrix(1 -0 0 1 0.000 180.000)%22><rect x=%22-30.00%22 y=%22-30.00%22 width=%2260.00%22 height=%2260.00%22 fill=%22%23f4f5f7%22 stroke=%22%23232530%22 stroke-width=%221%22/></g><text x=%220.00%22 y=%22180.00%22 font-size=%226.5%22 fill=%22%23232530%22 font-weight=%22400%22 text-anchor=%22middle%22 dominant-baseline=%22middle%22 stroke=%22%23ffffff%22 stroke-width=%222.27%22 stroke-linejoin=%22round%22 paint-order=%22stroke%22>SWG Period</text><text x=%220.00%22 y=%22211.80%22 font-size=%229%22 fill=%22%23232530%22 font-weight=%22400%22 text-anchor=%22middle%22 dominant-baseline=%22hanging%22 stroke=%22%23ffffff%22 stroke-width=%223.15%22 stroke-linejoin=%22round%22 paint-order=%22stroke%22>SWG_Period_1[16]</text><g transform=%22matrix(1 -0 0 1 0.000 300.000)%22><rect x=%22-30.00%22 y=%22-30.00%22 width=%2260.00%22 height=%2260.00%22 fill=%22%23f4f5f7%22 stroke=%22%23232530%22 stroke-width=%221%22/></g><text x=%220.00%22 y=%22300.00%22 font-size=%226.5%22 fill=%22%23232530%22 font-weight=%22400%22 text-anchor=%22middle%22 dominant-baseline=%22middle%22 stroke=%22%23ffffff%22 stroke-width=%222.27%22 stroke-linejoin=%22round%22 paint-order=%22stroke%22>SWG Period</text><text x=%220.00%22 y=%22331.80%22 font-size=%229%22 fill=%22%23232530%22 font-weight=%22400%22 text-anchor=%22middle%22 dominant-baseline=%22hanging%22 stroke=%22%23ffffff%22 stroke-width=%223.15%22 stroke-linejoin=%22round%22 paint-order=%22stroke%22>SWG_Period_1[17]</text><g transform=%22matrix(1 -0 0 1 0.000 420.000)%22><rect x=%22-30.00%22 y=%22-30.00%22 width=%2260.00%22 height=%2260.00%22 fill=%22%23f4f5f7%22 stroke=%22%23232530%22 stroke-width=%221%22/></g><text x=%220.00%22 y=%22420.00%22 font-size=%226.5%22 fill=%22%23232530%22 font-weight=%22400%22 text-anchor=%22middle%22 dominant-baseline=%22middle%22 stroke=%22%23ffffff%22 stroke-width=%222.27%22 stroke-linejoin=%22round%22 paint-order=%22stroke%22>SWG Period</text><text x=%220.00%22 y=%22451.80%22 font-size=%229%22 fill=%22%23232530%22 font-weight=%22400%22 text-anchor=%22middle%22 dominant-baseline=%22hanging%22 stroke=%22%23ffffff%22 stroke-width=%223.15%22 stroke-linejoin=%22round%22 paint-order=%22stroke%22>SWG_Period_1[18]</text><g transform=%22matrix(1 -0 0 1 0.000 540.000)%22><rect x=%22-30.00%22 y=%22-30.00%22 width=%2260.00%22 height=%2260.00%22 fill=%22%23f4f5f7%22 stroke=%22%23232530%22 stroke-width=%221%22/></g><text x=%220.00%22 y=%22540.00%22 font-size=%226.5%22 fill=%22%23232530%22 font-weight=%22400%22 text-anchor=%22middle%22 dominant-baseline=%22middle%22 stroke=%22%23ffffff%22 stroke-width=%222.27%22 stroke-linejoin=%22round%22 paint-order=%22stroke%22>SWG Period</text><text x=%220.00%22 y=%22571.80%22 font-size=%229%22 fill=%22%23232530%22 font-weight=%22400%22 text-anchor=%22middle%22 dominant-baseline=%22hanging%22 stroke=%22%23ffffff%22 stroke-width=%223.15%22 stroke-linejoin=%22round%22 paint-order=%22stroke%22>SWG_Period_1[19]</text><g transform=%22matrix(1 -0 0 1 0.000 660.000)%22><rect x=%22-30.00%22 y=%22-30.00%22 width=%2260.00%22 height=%2260.00%22 fill=%22%23f4f5f7%22 stroke=%22%23232530%22 stroke-width=%221%22/></g><text x=%220.00%22 y=%22660.00%22 font-size=%226.5%22 fill=%22%23232530%22 font-weight=%22400%22 text-anchor=%22middle%22 dominant-baseline=%22middle%22 stroke=%22%23ffffff%22 stroke-width=%222.27%22 stroke-linejoin=%22round%22 paint-order=%22stroke%22>SWG Period</text><text x=%220.00%22 y=%22691.80%22 font-size=%229%22 fill=%22%23232530%22 font-weight=%22400%22 text-anchor=%22middle%22 dominant-baseline=%22hanging%22 stroke=%22%23ffffff%22 stroke-width=%223.15%22 stroke-linejoin=%22round%22 paint-order=%22stroke%22>SWG_Period_1[20]</text><g transform=%22matrix(1 -0 0 1 0.000 780.000)%22><rect x=%22-30.00%22 y=%22-30.00%22 width=%2260.00%22 height=%2260.00%22 fill=%22%23f4f5f7%22 stroke=%22%23232530%22 stroke-width=%221%22/></g><text x=%220.00%22 y=%22780.00%22 font-size=%226.5%22 fill=%22%23232530%22 font-weight=%22400%22 text-anchor=%22middle%22 dominant-baseline=%22middle%22 stroke=%22%23ffffff%22 stroke-width=%222.27%22 stroke-linejoin=%22round%22 paint-order=%22stroke%22>SWG Period</text><text x=%220.00%22 y=%22811.80%22 font-size=%229%22 fill=%22%23232530%22 font-weight=%22400%22 text-anchor=%22middle%22 dominant-baseline=%22hanging%22 stroke=%22%23ffffff%22 stroke-width=%223.15%22 stroke-linejoin=%22round%22 paint-order=%22stroke%22>SWG_Period_1[21]</text><g transform=%22matrix(1 -0 0 1 0.000 900.000)%22><rect x=%22-30.00%22 y=%22-30.00%22 width=%2260.00%22 height=%2260.00%22 fill=%22%23f4f5f7%22 stroke=%22%23232530%22 stroke-width=%221%22/></g><text x=%220.00%22 y=%22900.00%22 font-size=%226.5%22 fill=%22%23232530%22 font-weight=%22400%22 text-anchor=%22middle%22 dominant-baseline=%22middle%22 stroke=%22%23ffffff%22 stroke-width=%222.27%22 stroke-linejoin=%22round%22 paint-order=%22stroke%22>SWG Period</text><text x=%220.00%22 y=%22931.80%22 font-size=%229%22 fill=%22%23232530%22 font-weight=%22400%22 text-anchor=%22middle%22 dominant-baseline=%22hanging%22 stroke=%22%23ffffff%22 stroke-width=%223.15%22 stroke-linejoin=%22round%22 paint-order=%22stroke%22>SWG_Period_1[22]</text><g transform=%22matrix(1 -0 0 1 0.000 1020.000)%22><rect x=%22-30.00%22 y=%22-30.00%22 width=%2260.00%22 height=%2260.00%22 fill=%22%23f4f5f7%22 stroke=%22%23232530%22 stroke-width=%221%22/></g><text x=%220.00%22 y=%221020.00%22 font-size=%226.5%22 fill=%22%23232530%22 font-weight=%22400%22 text-anchor=%22middle%22 dominant-baseline=%22middle%22 stroke=%22%23ffffff%22 stroke-width=%222.27%22 stroke-linejoin=%22round%22 paint-order=%22stroke%22>SWG Period</text><text x=%220.00%22 y=%221051.80%22 font-size=%229%22 fill=%22%23232530%22 font-weight=%22400%22 text-anchor=%22middle%22 dominant-baseline=%22hanging%22 stroke=%22%23ffffff%22 stroke-width=%223.15%22 stroke-linejoin=%22round%22 paint-order=%22stroke%22>SWG_Period_1[23]</text><g transform=%22matrix(1 -0 0 1 0.000 1140.000)%22><rect x=%22-30.00%22 y=%22-30.00%22 width=%2260.00%22 height=%2260.00%22 fill=%22%23f4f5f7%22 stroke=%22%23232530%22 stroke-width=%221%22/></g><text x=%220.00%22 y=%221140.00%22 font-size=%226.5%22 fill=%22%23232530%22 font-weight=%22400%22 text-anchor=%22middle%22 dominant-baseline=%22middle%22 stroke=%22%23ffffff%22 stroke-width=%222.27%22 stroke-linejoin=%22round%22 paint-order=%22stroke%22>SWG Period</text><text x=%220.00%22 y=%221171.80%22 font-size=%229%22 fill=%22%23232530%22 font-weight=%22400%22 text-anchor=%22middle%22 dominant-baseline=%22hanging%22 stroke=%22%23ffffff%22 stroke-width=%223.15%22 stroke-linejoin=%22round%22 paint-order=%22stroke%22>SWG_Period_1[24]</text><g transform=%22matrix(1 -0 0 1 0.000 1260.000)%22><rect x=%22-30.00%22 y=%22-30.00%22 width=%2260.00%22 height=%2260.00%22 fill=%22%23f4f5f7%22 stroke=%22%23232530%22 stroke-width=%221%22/></g><text x=%220.00%22 y=%221260.00%22 font-size=%226.5%22 fill=%22%23232530%22 font-weight=%22400%22 text-anchor=%22middle%22 dominant-baseline=%22middle%22 stroke=%22%23ffffff%22 stroke-width=%222.27%22 stroke-linejoin=%22round%22 paint-order=%22stroke%22>SWG Period</text><text x=%220.00%22 y=%221291.80%22 font-size=%229%22 fill=%22%23232530%22 font-weight=%22400%22 text-anchor=%22middle%22 dominant-baseline=%22hanging%22 stroke=%22%23ffffff%22 stroke-width=%223.15%22 stroke-linejoin=%22round%22 paint-order=%22stroke%22>SWG_Period_1[25]</text><g transform=%22matrix(1 -0 0 1 0.000 1380.000)%22><rect x=%22-30.00%22 y=%22-30.00%22 width=%2260.00%22 height=%2260.00%22 fill=%22%23f4f5f7%22 stroke=%22%23232530%22 stroke-width=%221%22/></g><text x=%220.00%22 y=%221380.00%22 font-size=%226.5%22 fill=%22%23232530%22 font-weight=%22400%22 text-anchor=%22middle%22 dominant-baseline=%22middle%22 stroke=%22%23ffffff%22 stroke-width=%222.27%22 stroke-linejoin=%22round%22 paint-order=%22stroke%22>SWG Period</text><text x=%220.00%22 y=%221411.80%22 font-size=%229%22 fill=%22%23232530%22 font-weight=%22400%22 text-anchor=%22middle%22 dominant-baseline=%22hanging%22 stroke=%22%23ffffff%22 stroke-width=%223.15%22 stroke-linejoin=%22round%22 paint-order=%22stroke%22>SWG_Period_1[26]</text><g transform=%22matrix(1 -0 0 1 0.000 1500.000)%22><rect x=%22-30.00%22 y=%22-30.00%22 width=%2260.00%22 height=%2260.00%22 fill=%22%23f4f5f7%22 stroke=%22%23232530%22 stroke-width=%221%22/></g><text x=%220.00%22 y=%221500.00%22 font-size=%226.5%22 fill=%22%23232530%22 font-weight=%22400%22 text-anchor=%22middle%22 dominant-baseline=%22middle%22 stroke=%22%23ffffff%22 stroke-width=%222.27%22 stroke-linejoin=%22round%22 paint-order=%22stroke%22>SWG Period</text><text x=%220.00%22 y=%221531.80%22 font-size=%229%22 fill=%22%23232530%22 font-weight=%22400%22 text-anchor=%22middle%22 dominant-baseline=%22hanging%22 stroke=%22%23ffffff%22 stroke-width=%223.15%22 stroke-linejoin=%22round%22 paint-order=%22stroke%22>SWG_Period_1[27]</text><g transform=%22matrix(1 -0 0 1 0.000 1620.000)%22><rect x=%22-30.00%22 y=%22-30.00%22 width=%2260.00%22 height=%2260.00%22 fill=%22%23f4f5f7%22 stroke=%22%23232530%22 stroke-width=%221%22/></g><text x=%220.00%22 y=%221620.00%22 font-size=%226.5%22 fill=%22%23232530%22 font-weight=%22400%22 text-anchor=%22middle%22 dominant-baseline=%22middle%22 stroke=%22%23ffffff%22 stroke-width=%222.27%22 stroke-linejoin=%22round%22 paint-order=%22stroke%22>SWG Period</text><text x=%220.00%22 y=%221651.80%22 font-size=%229%22 fill=%22%23232530%22 font-weight=%22400%22 text-anchor=%22middle%22 dominant-baseline=%22hanging%22 stroke=%22%23ffffff%22 stroke-width=%223.15%22 stroke-linejoin=%22round%22 paint-order=%22stroke%22>SWG_Period_1[28]</text><g transform=%22matrix(1 -0 0 1 0.000 1740.000)%22><rect x=%22-30.00%22 y=%22-30.00%22 width=%2260.00%22 height=%2260.00%22 fill=%22%23f4f5f7%22 stroke=%22%23232530%22 stroke-width=%221%22/></g><text x=%220.00%22 y=%221740.00%22 font-size=%226.5%22 fill=%22%23232530%22 font-weight=%22400%22 text-anchor=%22middle%22 dominant-baseline=%22middle%22 stroke=%22%23ffffff%22 stroke-width=%222.27%22 stroke-linejoin=%22round%22 paint-order=%22stroke%22>SWG Period</text><text x=%220.00%22 y=%221771.80%22 font-size=%229%22 fill=%22%23232530%22 font-weight=%22400%22 text-anchor=%22middle%22 dominant-baseline=%22hanging%22 stroke=%22%23ffffff%22 stroke-width=%223.15%22 stroke-linejoin=%22round%22 paint-order=%22stroke%22>SWG_Period_1[29]</text><g fill=%22none%22 stroke-width=%222%22></g></svg>)
Transmission for TM and TE Inputs
Section titled “Transmission for TM and TE Inputs”We compute -parameters over the wavelength sweep and plot transmission in dB as :
- The left panel shows TM input with cross and thru responses, including a small inset emphasizing the cross band.
- The right panel shows TE input with cross and thru responses.
s_matrix = pbs.s_matrix(freqs, model_kwargs={"inputs": ["P0"]})Uploading task 'P0@0…'Uploading task 'P0@1…'Starting task 'P0@0': https://tidy3d.simulation.cloud/workbench?taskId=fdve-1ce4e54d-dc0a-48ac-a14d-49a7e60b0aceStarting task 'P0@1': https://tidy3d.simulation.cloud/workbench?taskId=fdve-fedbe98a-fe3c-4476-8115-44bbca7f302bDownloading data from 'P0@0'…Downloading data from 'P0@1'…# Define key mapping for S-parametersk_te_thru = ("P0@0", "P1@0") # TE input → throughk_te_cross = ("P0@0", "P2@0") # TE input → crossk_tm_thru = ("P0@1", "P1@1") # TM input → throughk_tm_cross = ("P0@1", "P2@1") # TM input → cross
# Helper to convert complex S-parameter to transmission in dBdef s_to_db(s): """ Return 10*log10(|S|^2) with small floor for numerical stability. """ return 10.0 * np.log10(np.abs(s) ** 2 + 1e-18)
# Extract wavelength axis in nmwl_nm = wavelengths * 1e3
# Create side-by-side plots for TM input and TE inputfig, axes = plt.subplots(1, 2, figsize=(10, 4), constrained_layout=True)
# TM input: plot cross and thruax_tm = axes[0]ax_tm.plot(wl_nm, s_to_db(s_matrix[k_tm_cross]), label="cross", linewidth=2)ax_tm.plot(wl_nm, s_to_db(s_matrix[k_tm_thru]), label="thru", linewidth=2)ax_tm.set_xlabel("Wavelength (nm)")ax_tm.set_ylabel("Transmission (dB)")ax_tm.set_title("TM input")ax_tm.legend(loc="center", frameon=False)
# Optional inset for TM cross near 1450–1650 nmfrom mpl_toolkits.axes_grid1.inset_locator import inset_axes
axins = inset_axes(ax_tm, width="30%", height="30%", loc="lower left", borderpad=2)axins.plot(wl_nm, s_to_db(s_matrix[k_tm_cross]), linewidth=1.5)axins.set_xticks([1450, 1550, 1650])axins.set_yticks([-2, -1, 0])axins.set_title("cross", fontsize=9, pad=2)
# TE input: plot cross and thruax_te = axes[1]ax_te.plot(wl_nm, s_to_db(s_matrix[k_te_cross]), label="cross", linewidth=2)ax_te.plot(wl_nm, s_to_db(s_matrix[k_te_thru]), label="thru", linewidth=2)ax_te.set_xlabel("Wavelength (nm)")ax_te.set_ylabel("Transmission (dB)")ax_te.set_title("TE input")ax_te.legend(loc="center", frameon=False)
# Add an overall style tweakfor ax in axes.ravel(): ax.grid(True, alpha=0.2)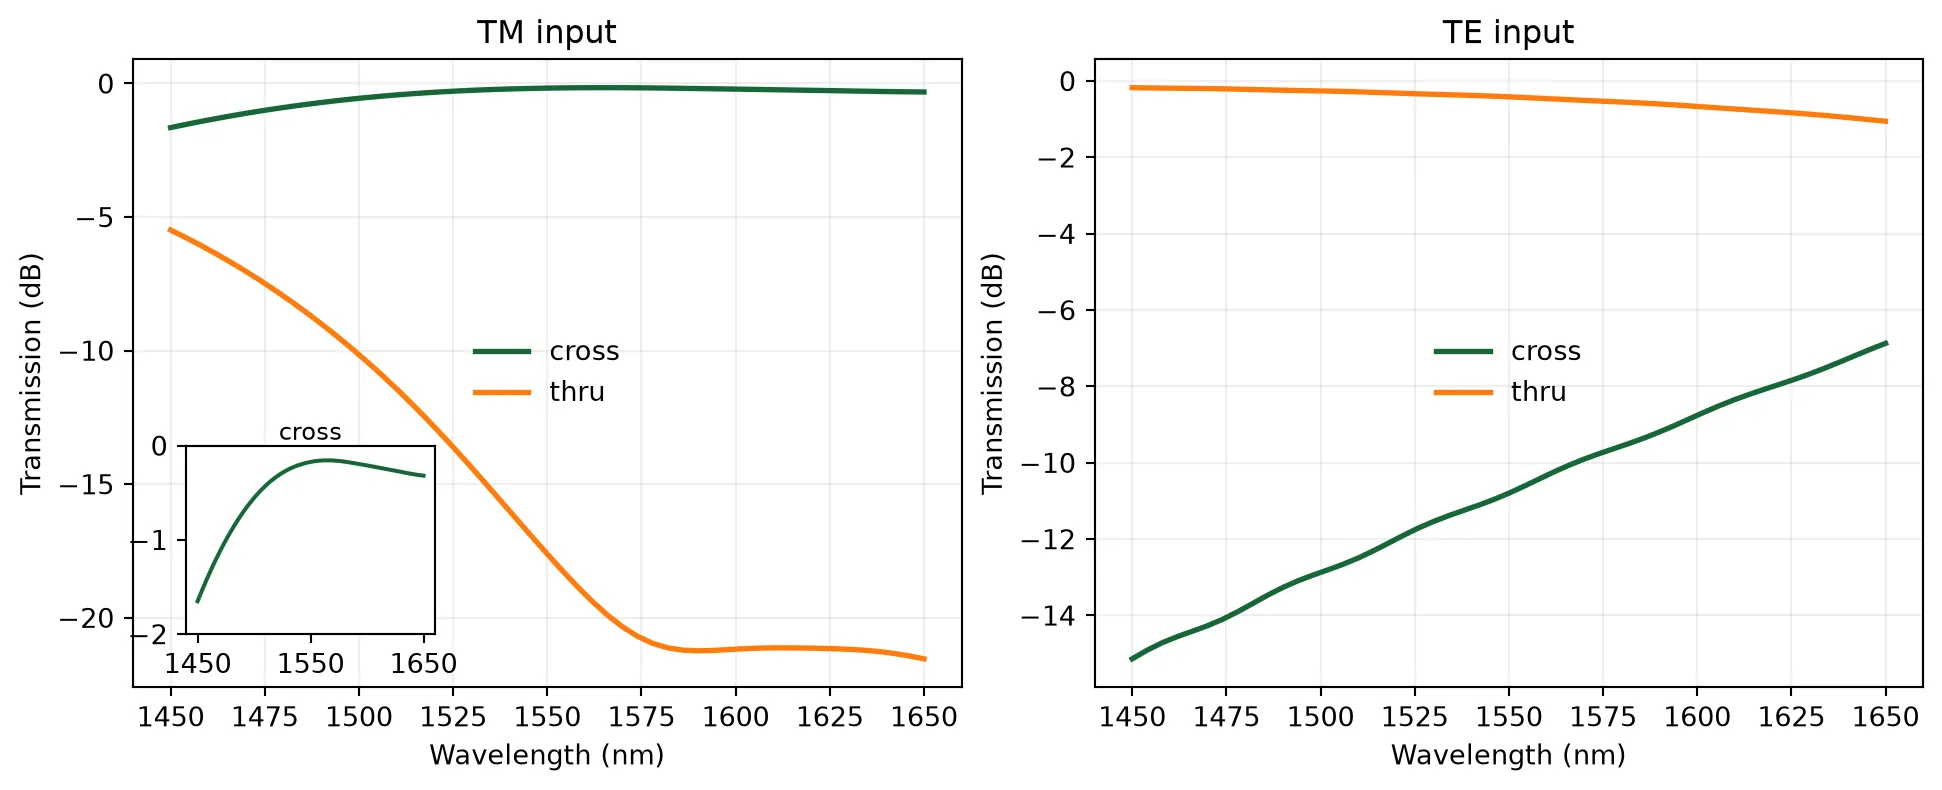
Finally, we visualize the simulated field distributions of the polarizing beam splitter.
# Retrieve simulation field data for PBS modelsim_data_pbs = pbs.active_model.batch_data(pbs, freqs, inputs=["P0"])
# Create a 1×2 subplot figurefig, axes = plt.subplots(1, 2, figsize=(10, 3), constrained_layout=True)
# Plot Ey field for TE input (P0@0)ax0 = sim_data_pbs["P0@0"].plot_field("field", "Ey", ax=axes[0], robust=False)axes[0].set_title("TE Input (Ey Field)")
# Plot Hy field for TM input (P0@1)ax1 = sim_data_pbs["P0@1"].plot_field("field", "Hy", ax=axes[1], robust=False)axes[1].set_title("TM Input (Hy Field)")plt.show()
14:29:53 -03 Loading simulation from local cache. View cached task using web UI at 'https://tidy3d.simulation.cloud/workbench?taskId=fdve-1ce4e54d-dc0 a-48ac-a14d-49a7e60b0ace'.
             Loading simulation from local cache. View cached task using web UI
             at
             'https://tidy3d.simulation.cloud/workbench?taskId=fdve-fedbe98a-fe3
             c-4476-8115-44bbca7f302b'.