

Link Simulation
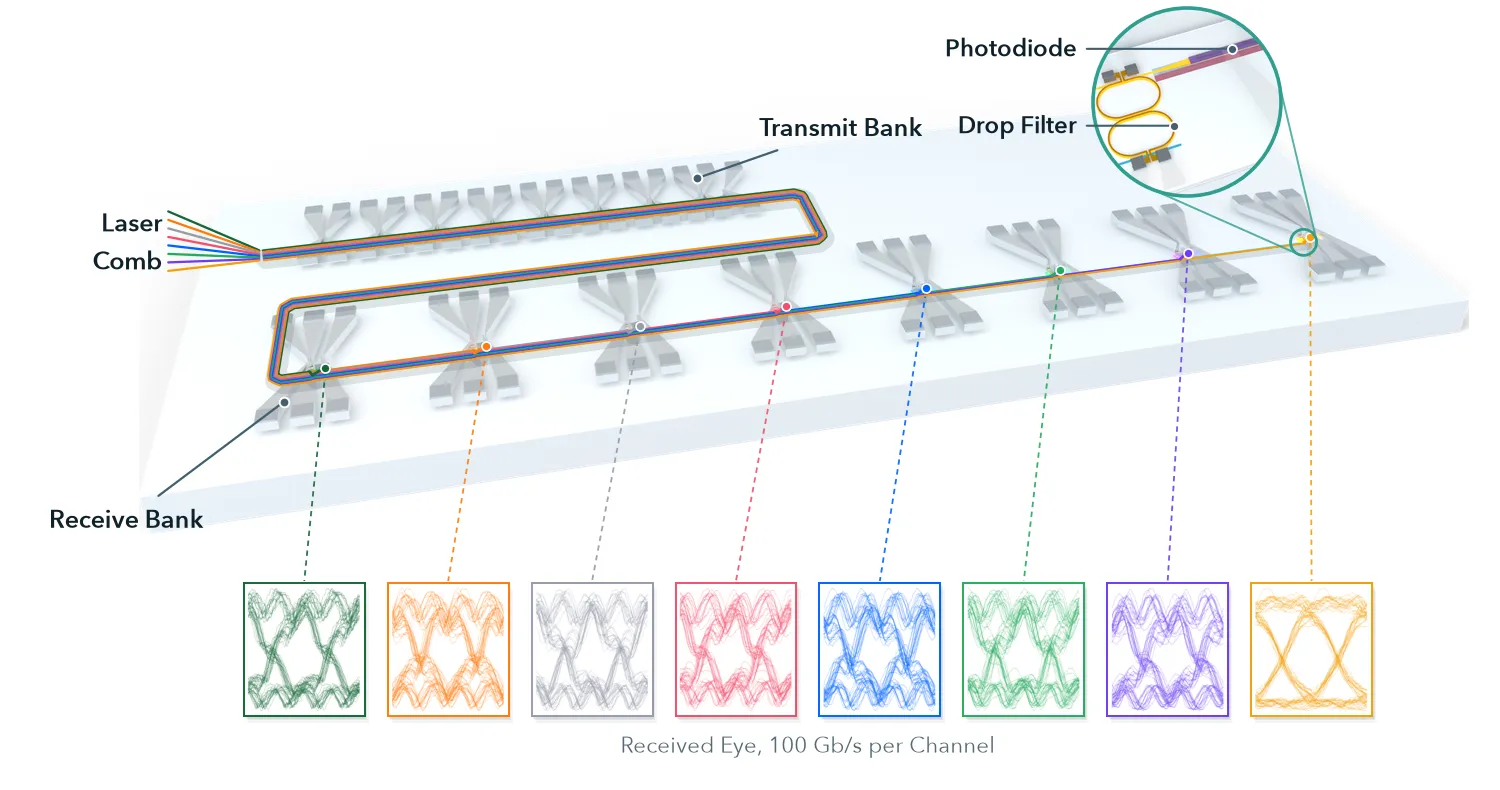
The chip the series arrives at, with the part this notebook works on marked:
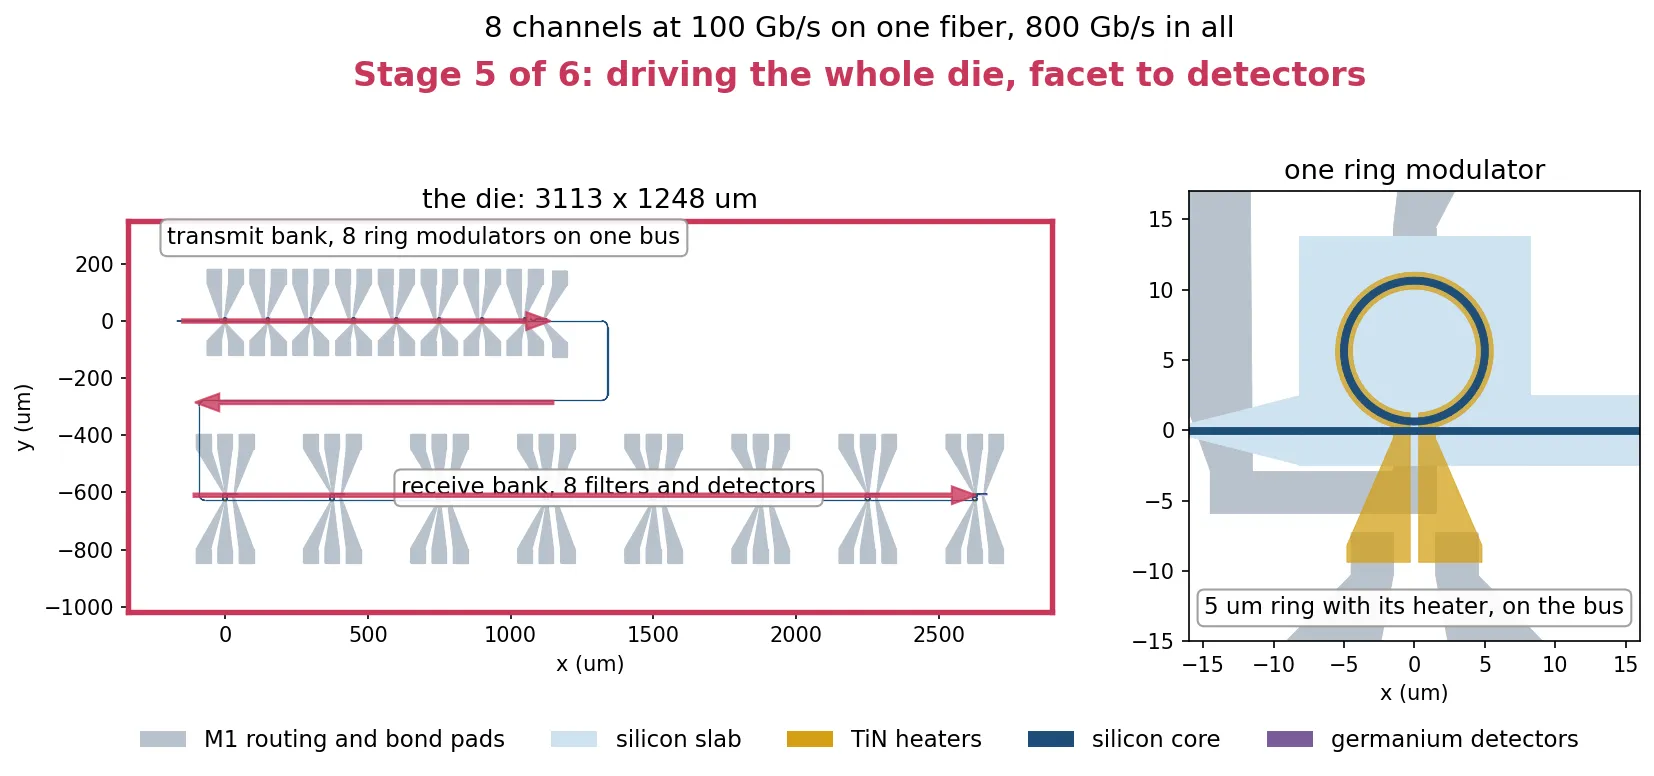
This notebook drives the eight-channel microring transceiver laid out in Chip Layout with real data and measures what comes out of it.
A comb of eight carriers enters the facet. Eight ring modulators, one per carrier, impress a
100 Gb/s pattern on each. The light crosses the die, eight coupled-ring drop filters separate the
channels again, and eight photodiodes convert them back to voltage. The simulation is post
layout: the component that is driven is the same chip object that produced the mask and passed
the design rule check, with every route, taper, tap and bond-pad cell in place.
Three quantities have to be fixed before any of that can run.
The modulator bias detuning. A ring modulator transmits a minimum at resonance, and the slope of its transmission is zero there, so a ring driven exactly on resonance produces almost no modulation. The drive has to sit where the slope is steep, on the side of the resonance. How far to the side follows from the resonance shape, and the first cell below checks that the drive is small enough for that answer to hold.
The heater setting for all sixteen rings. The drawn ring sizes place each resonance near its channel but not on it, and the modulators additionally have to sit at the bias detuning above. Both corrections come from the heaters, whose efficiency was measured in Wavelength Plan and Thermal Budget.
The receiver bandwidth. The drop filters have to reject the neighbouring channel 200 GHz away and pass a 100 Gb/s signal at the same time. Component Library sizes them against both, and the last section here checks the finished chip against the same two numbers. That requirement came from this notebook: a filter chosen on crosstalk alone closed the eye, and only a link simulation showed it.
from runpy import run_path
# Optical_IO_Chip.qmd defines what this notebook builds on: everything measured so far.# Its shared cells are generated into the module below; see# docs/scripts/generate_notebook_modules.py.globals().update(    {k: v for k, v in run_path("misc/optical_io_chip.py").items() if not k.startswith("_")})
Operating point and simulation settings
Section titled “Operating point and simulation settings”The numbers below fall into three groups: the thermal calibration constants measured elsewhere, the optical and electrical operating point of the link, and the time step.
The thermal constants are read from misc/thermal_budget.npz, written by
Wavelength Plan and Thermal Budget, so that this notebook does
not repeat a HEAT solve. Two of them matter here: how many kelvin a milliwatt of heater power
produces, and how many gigahertz a kelvin moves a resonance on each of the two waveguides.
The time step is set by the ring, not by the data. A time-domain circuit has to resolve the round trip inside the cavity, so the step is a fraction of that round trip, and the number of samples per bit follows from it rather than being chosen.
# Load the thermal results measured in Optical_IO_Thermal.ipynbbudget = np.load("misc/thermal_budget.npz")
# Take the heater efficiency, in kelvin of ring rise per milliwattk_per_mw = float(budget["k_per_mw"])
# Convert that to a resonance shift per milliwatt, for each waveguide typeghz_per_mw_rib = k_per_mw * ghz_per_k_ribghz_per_mw_strip = k_per_mw * ghz_per_k_strip
t_ref = 293.0  # Temperature the component models were built at, K
# Calculate one round trip inside the modulator ringtau_rt = 2 * np.pi * r_target * b["n_group"] / pf.C_0
# Set the time step to a quarter of a round trip, fine enough for the cavitydt = tau_rt / 4
bit_rate = 100e9  # Line rate per channelui = int(round(1 / bit_rate / dt))  # Number of samples per bitbit_rate = 1 / (ui * dt)  # Actual rate, after rounding to a whole sample count
z0 = 50.0  # Source impedance of the electrical portssq = np.sqrt(z0)  # Electrical wave amplitudes are volts over sqrt(z0)
v_drive = 3.0  # Modulator peak-to-peak drive voltagep_line = 2e-3  # Input laser power per comb line: +3 dBm
# Work out how far the drive itself moves the resonancedrive_shift = (    f0    * abs(mod_kwargs["dn_dv"] * v_drive + mod_kwargs["dn_dv2"] * v_drive**2)    / b["n_group"])
print(f"{'heater efficiency':24s} {k_per_mw:8.2f} K/mW")print(f"{'modulator tuning':24s} {ghz_per_mw_rib:8.1f} GHz/mW")print(f"{'filter tuning':24s} {ghz_per_mw_strip:8.1f} GHz/mW")print(f"{'modulator linewidth':24s} {fwhm*1e-9:8.0f} GHz")print(f"{'channel grid':24s} {channel_grid*1e-9:8.0f} GHz")print(f"{'time step':24s} {dt*1e15:8.2f} fs")print(f"{'samples per bit':24s} {ui:8d}")print(f"{'line rate':24s} {bit_rate*1e-9:8.1f} Gb/s")print(    f"{'drive moves resonance':24s} {drive_shift*1e-9:8.0f} GHz "    f"= {drive_shift/fwhm:.2f} linewidths")
heater efficiency 3.57 K/mWmodulator tuning 33.2 GHz/mWfilter tuning 30.8 GHz/mWmodulator linewidth 114 GHzchannel grid 200 GHztime step 101.60 fssamples per bit 98line rate 100.4 Gb/sdrive moves resonance 13 GHz = 0.11 linewidthsThe drive moves the resonance by about a tenth of a linewidth, which is what the next section needs to know: the bias point below is derived for a drive small enough not to move the resonance at all.
Choosing the modulator bias detuning
Section titled “Choosing the modulator bias detuning”For a drive that does not move the resonance, the optimum bias is where the transmission slope is steepest. For a Lorentzian dip that is its inflection point, at
which is the starting point used in the optical peaking example. The laser sits below the resonance, so each modulator is calibrated to hold its resonance that far above its own comb line.
A tenth of a linewidth of drive-induced shift is inside the range the formula is written for, so it is used as it stands. What says whether that was the right call is the eight eyes measured further down, and those are measured on the chip with all eight channels present. A sweep of one modulator on a bench cannot settle it: moving the bias further out improves a single ring, and at the same time raises the carrier of every neighbour, which is what the chip is actually limited by.
The two sides of the resonance are not equivalent either. A ring modulator chirps as it switches, because depleting the junction changes the loss as well as the index, and the sign of that interference depends on which side the laser sits. The laser is placed on the low-frequency side, which is the side the resonance itself moves toward as the junction depletes.
# Set the bias at the steepest slope, below the resonancesmall_signal = fwhm / (2 * np.sqrt(3))bias_detune = -small_signal
print(    f"bias detuning {bias_detune*1e-9:.1f} GHz " f"= {bias_detune/fwhm:+.3f} linewidths")
bias detuning -33.0 GHz = -0.289 linewidthsThe drive pattern and the eye metric
Section titled “The drive pattern and the eye metric”Every channel is driven with a maximal-length sequence of 31 bits, repeated three times, with the first period discarded so the cavities have filled before anything is measured. The pattern is short deliberately: run time scales with it, and the level transitions the eye is made of all appear within one period.
Two details of the eye metric matter. The two logic levels are separated using the bits that were sent, not by splitting the samples at their own average, which fails once the eye is nearly closed. And the sampling instant is searched rather than assumed, because the cavity and the 60 GHz detector together delay the waveform by a large part of a bit period, and the routing adds several whole bits on top. A real receiver recovers that instant from the data.
n_pattern = 31  # Bits in one period of the drive patternn_reps = 3  # Periods per runn_bits = n_reps * n_pattern  # Bits per runn_steps = n_bits * ui  # Total time steps per runrise = max(1, int(round(0.3 * ui)))  # Rise and fall time, as a fraction of a bit
def prbs5(shift=0):    """Generate the 31 bit maximal sequence of x^5 + x^3 + 1, rotated by shift."""    reg, out = 0x1F, []    for _ in range(n_pattern):        bit = ((reg >> 4) ^ (reg >> 2)) & 1        reg = ((reg << 1) | bit) & 0x1F        out.append(bit)    return np.roll(np.array(out), shift)
def nrz(bits):    """Convert a bit sequence to a drive waveform with finite edges."""    # Hold each bit for one symbol period    level = np.repeat(np.tile(bits, n_reps), ui).astype(float)
    # Smooth the steps into ramps of the chosen rise time    return np.convolve(level, np.ones(rise) / rise, mode="same") * v_drive
def eye_fold(v):    """Fold a trace into overlapping two-bit segments for an eye diagram."""    # Slide the window one bit at a time, so every transition lands mid trace    n = len(v) // ui - 1    return np.stack([v[k * ui : (k + 2) * ui] for k in range(n)])
def eye_q(v, bits, max_lag=24, instant=False):    """Measure eye quality: level separation over level spread."""    # Cut the trace into symbol periods    keep = len(v) // ui    blocks = v[: keep * ui].reshape(-1, ui)    sent_all = np.tile(bits, n_reps)[-keep:]
    # Search over whole-bit lag as well, since the chip delays by several bits    best, best_k = 0.0, 0    for lag in range(max_lag):        sent = np.roll(sent_all, lag)        hi, lo = blocks[sent == 1], blocks[sent == 0]        if len(hi) < 2 or len(lo) < 2:            continue        q = np.abs(hi.mean(axis=0) - lo.mean(axis=0)) / (            hi.std(axis=0) + lo.std(axis=0) + 1e-18        )        k = int(np.argmax(q))        if q[k] > best:            best, best_k = float(q[k]), k
    # Return the sampling instant too, which is what an eye is centred on    return (best, best_k) if instant else best
Setting the sixteen heaters
Section titled “Setting the sixteen heaters”Each ring now has a target. A modulator has to sit at the measured bias detuning above its carrier. A filter has to sit centred on its carrier, where its drop port peaks.
Three facts make this a chip-level problem rather than sixteen independent ones.
The drawn sizes put each resonance near its channel but not on it, because the ring radii were snapped to the layout grid.
A heater can only heat, so it can only pull a resonance down in frequency. Every ring therefore has to start above where it must end up.
The comb is a rigid grid with one global position. A single laser offset has to give all sixteen rings room to be pulled down, and the ring furthest from its target sets that offset for everybody.
The heater setting itself enters the model as a temperature. The ring models carry a thermo-optic coefficient, so setting the ring temperature moves the resonance exactly as the heater would, and the same value feeds the frequency-domain model and the time stepper.
The calibration is measured rather than calculated. Each resonance is found on the cell that was actually built, the temperature is corrected, and it is measured again. This avoids two traps: a closed-form resonance formula holding the index fixed ignores dispersion, and a coupled pair has a flat passband whose peak is not a stable landmark, so filters are aligned by the centre of their passband instead.
One detail below is worth more than it looks. Every ring and every pass is measured on one shared frequency grid. PhotonForge solves a component’s port modes at each frequency it is asked for and caches the result on the frequency value, not on the component, so a grid centred on each channel in turn would pay a fresh mode solve per channel per pass. On this chip that one change is the difference between a section that takes minutes and one that takes an hour, and it changes no answer.
# Aim each modulator's resonance one bias detuning above its own comb linebias_offset = -bias_detune
search = 400e9  # Half-width of the resonance search window, Hzscan = np.arange(channel_freqs.min() - 600e9, channel_freqs.max() + 600e9, 5e9)print(    f"one scan of {len(scan)} frequencies, "    f"{(scan[1]-scan[0])*1e-9:.0f} GHz apart, for all sixteen rings")
def dip_of(cell, key, guess, span=search):    """Find the transmission minimum nearest a first estimate."""    t = np.abs(cell.s_matrix(scan, show_progress=False)[key]) ** 2    near = np.abs(scan - guess) < span    return float(scan[np.flatnonzero(near)[np.argmin(t[near])]])
def band_centre_of(cell, key, guess, span=search):    """Find the centre of a filter passband, as the midpoint of everything    above half its peak."""    t = np.abs(cell.s_matrix(scan, show_progress=False)[key]) ** 2    near = np.abs(scan - guess) < span    f, w = scan[near], t[near]    inband = f[w >= 0.5 * w.max()]    return float(0.5 * (inband.min() + inband.max()))
# Build one ring at a given temperature, for both device typesdef warm_modulator(i, warm):    """Modulator for channel i with its heater raising it warm kelvin."""    return microring_modulator(        **{**mod_kwargs, "ring_radius": mod_radius[i], "temperature": t_ref + warm}    )
def warm_filter(i, warm):    """Coupled-ring filter for channel i, likewise."""    return two_ring_filter(        **{            **dict(second_order.parametric_kwargs),            "coupling_length": drop_lc[i],            "n_eff": n_eff_strip,            "temperature": t_ref + warm,        }    )
# Measure where every cold resonance actually sitsmod_res = np.array(    [        dip_of(modulators[i], ("P0@0", "P1@0"), channel_freqs[i])        for i in range(n_channels)    ])flt_res = np.array(    [        band_centre_of(filters[i], ("in@0", "drop@0"), channel_freqs[i])        for i in range(n_channels)    ])print("cold resonances found")
# Offset the whole comb by what the most demanding ring needsneed = np.concatenate([channel_freqs - mod_res + bias_offset, channel_freqs - flt_res])comb_offset = need.max() + 5e9  # 5 GHz of margin, so no heater sits at zerolaser_freqs = channel_freqs - comb_offset
# Estimate how far each heater has to pull its ringmod_shift = mod_res - (laser_freqs + bias_offset)flt_shift = flt_res - laser_freqs
# Convert that shift to the temperature which produces itmod_warm = mod_shift * 1e-9 / ghz_per_k_ribflt_warm = flt_shift * 1e-9 / ghz_per_k_strip
# Measure the warmed cell, correct the temperature, and measure againfor sweep in range(2):    mod_err, flt_err = [], []    for i in range(n_channels):        want = laser_freqs[i] + bias_offset        got = dip_of(warm_modulator(i, mod_warm[i]), ("P0@0", "P1@0"), want, span=150e9)        mod_err.append(got - want)        got = band_centre_of(            warm_filter(i, flt_warm[i]), ("in@0", "drop@0"), laser_freqs[i], span=150e9        )        flt_err.append(got - laser_freqs[i])        print(f"  pass {sweep}, channel {i} measured", flush=True)
    print(        f"pass {sweep}: worst residual, modulator "        f"{np.abs(mod_err).max()*1e-9:5.1f} GHz, filter "        f"{np.abs(flt_err).max()*1e-9:5.1f} GHz"    )
    # Fold the measured error back into the temperature    mod_warm = mod_warm + np.array(mod_err) * 1e-9 / ghz_per_k_rib    flt_warm = flt_warm + np.array(flt_err) * 1e-9 / ghz_per_k_strip
# Convert each temperature into the heater power it costsmod_mw = mod_warm / k_per_mwflt_mw = flt_warm / k_per_mw
print()print(f"bias offset  {bias_offset*1e-9:.1f} GHz, resonance above the carrier")print(f"comb offset  {comb_offset*1e-9:.1f} GHz, common to all eight lines")print()print(    f"{'ch':>3s} {'laser THz':>10s} {'mod K':>7s} {'mod mW':>7s} "    f"{'flt K':>7s} {'flt mW':>7s}")for i in range(n_channels):    print(        f"{i:3d} {laser_freqs[i]*1e-12:10.4f} {mod_warm[i]:7.2f} "        f"{mod_mw[i]:7.2f} {flt_warm[i]:7.2f} {flt_mw[i]:7.2f}"    )print()print(    f"tuning power {mod_mw.sum():.1f} mW transmit, {flt_mw.sum():.1f} mW "    f"receive, {mod_mw.sum()+flt_mw.sum():.1f} mW total")print(f"per ring     {np.concatenate([mod_mw, flt_mw]).mean():.2f} mW average")
one scan of 520 frequencies, 5 GHz apart, for all sixteen ringscold resonances found pass 0, channel 0 measured pass 0, channel 1 measured pass 0, channel 2 measured pass 0, channel 3 measured pass 0, channel 4 measured pass 0, channel 5 measured pass 0, channel 6 measured pass 0, channel 7 measuredpass 0: worst residual, modulator 0.0 GHz, filter 2.0 GHz pass 1, channel 0 measured pass 1, channel 1 measured pass 1, channel 2 measured pass 1, channel 3 measured pass 1, channel 4 measured pass 1, channel 5 measured pass 1, channel 6 measured pass 1, channel 7 measuredpass 1: worst residual, modulator 0.0 GHz, filter 3.0 GHz
bias offset 33.0 GHz, resonance above the carriercomb offset 48.0 GHz, common to all eight lines
ch laser THz mod K mod mW flt K flt mW 0 192.6665 0.54 0.15 5.09 1.43 1 192.8665 1.07 0.30 5.96 1.67 2 193.0665 1.61 0.45 5.67 1.59 3 193.2665 2.15 0.60 5.67 1.59 4 193.4665 0.54 0.15 5.38 1.51 5 193.6665 1.07 0.30 5.38 1.51 6 193.8665 2.15 0.60 5.67 1.59 7 194.0665 2.68 0.75 5.67 1.59
tuning power 3.3 mW transmit, 12.5 mW receive, 15.8 mW totalper ring 0.99 mW averageThe first pass already lands every ring within the scan step, and the second returns the same numbers. That is not luck: the cold resonance is measured rather than predicted, and a ring model’s resonance moves exactly linearly with its temperature, so one measurement and one division is the whole correction. The second pass is the check that says so, and it costs nothing now that the grid is shared. Either way the residual is far inside both the modulator linewidth and the filter passband, so every ring is on its channel.
The filters cost more power than the modulators, for two reasons. Their straight sections were snapped to a coarser grid, so they start further from their targets, and they carry the full comb offset while the modulators get part of it back as their bias detuning.
The milliwatt figures use the kelvin per milliwatt measured on the modulator’s heater, which is the only one Wavelength Plan and Thermal Budget solved. A filter heater is narrower, and a narrower heater puts the same power into a smaller volume directly over the mode, so its real efficiency is a little better and these numbers are an upper bound. The calibration itself is unaffected, because it works in temperature.
The plots below show the result directly: eight modulator resonances, each sitting the bias detuning above its carrier, and eight filter passbands, each centred on one.
# Build the calibrated cells once, for the plots and the chip alikemods_cal = [warm_modulator(i, mod_warm[i]) for i in range(n_channels)]flts_cal = [warm_filter(i, flt_warm[i]) for i in range(n_channels)]
# Scan a window spanning all eight channels, with room either sidespan = np.linspace(laser_freqs.min() - 300e9, laser_freqs.max() + 300e9, 401)
fig, ax = plt.subplots(2, 1, figsize=(10, 5.5), sharex=True, tight_layout=True)
# Plot each modulator's through-port transmissionfor i in range(n_channels):    t = np.abs(mods_cal[i].s_matrix(span, show_progress=False)[("P0@0", "P1@0")]) ** 2    ax[0].plot((span - f0) * 1e-12, 10 * np.log10(t), lw=1)
# Plot each filter's drop-port transmissionfor i in range(n_channels):    d = np.abs(flts_cal[i].s_matrix(span, show_progress=False)[("in@0", "drop@0")]) ** 2    ax[1].plot((span - f0) * 1e-12, 10 * np.log10(d), lw=1)
# Mark the comb lines, which is what both rows are aligned tofor a in ax:    for fl in laser_freqs:        a.axvline((fl - f0) * 1e-12, color="gray", ls=":", lw=0.8)    a.grid(True, alpha=0.3)ax[0].set(    ylabel="through (dB)",    ylim=(-25, 2),    title="calibrated modulators, biased off their carriers",)ax[1].set(    xlabel="frequency offset from the design carrier (THz)",    ylabel="drop (dB)",    ylim=(-40, 2),    title="calibrated demultiplexer, centred on the carriers",)plt.show()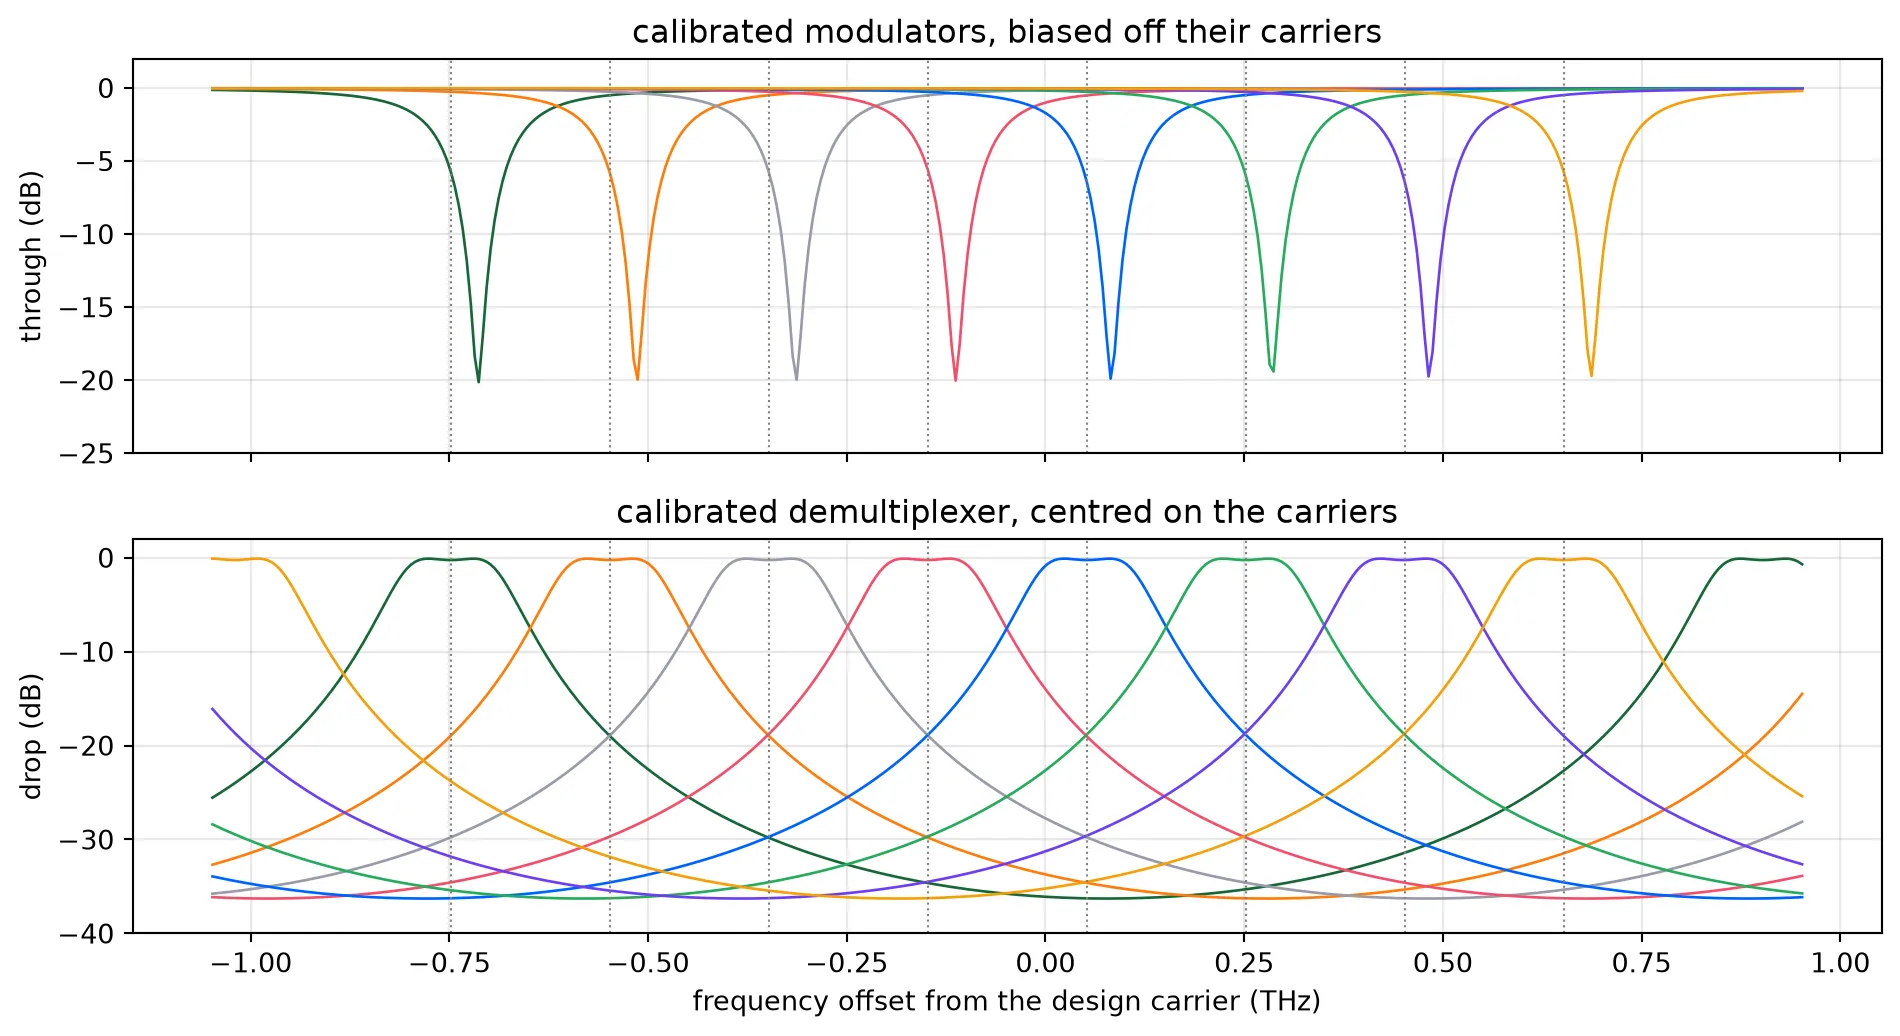
Simulating the full chip
Section titled “Simulating the full chip”The calibration is applied by rebuilding the chip with the warmed rings. The bank and die assembly from Chip Layout is reused directly, so what is simulated has the same routes, tapers, monitor tap, bond pads and hierarchy as the mask, with only the ring temperatures changed.
All eight channels are modulated at once, in a single run. The stimulus is a comb of eight
tones on the fibre port and eight independent drive patterns, one per modulator, stepped together
through one ts.step call. Each channel carries a different rotation of the sequence, so
neighbours are never sending the same bits at the same time, and the eight detectors are read
together. The eye diagrams below therefore already contain whatever the other seven channels do to
each one: carrier crosstalk through the filters, and any interaction between modulators sharing the
bus.
# Rebuild both banks with the calibrated rings and assemble the dietx_cal, _, _ = build_tx_bank([mrm_with_bond_pads(modulator=m) for m in mods_cal])rx_cal, _, _ = build_rx_bank([filter_with_bond_pads(filter_cell=f) for f in flts_cal])chip_cal = assemble_chip(tx_cal, rx_cal)
print(    f"simulating {chip_cal.name}, footprint "    f"{chip_cal.size()[0]:.0f} x {chip_cal.size()[1]:.0f} um")
# One rotation of the pattern per channel, so the lanes are decorrelatedlane_bits = {i: prbs5(shift=7 * i) for i in range(n_channels)}
# Put the carrier in the middle of the comb so the baseband spans it evenlyf_carrier = laser_freqs[n_channels // 2]
# Build the input comb as a sum of tones about the carriert = np.arange(n_steps) * dtcomb = sum(    np.sqrt(p_line) * np.exp(-2j * np.pi * (fl - f_carrier) * t) for fl in laser_freqs)
# Feed the comb to the fibre port and its own pattern to each drive portinputs = {"FIBER@0": np.asarray(comb, dtype=complex)}for i in range(n_channels):    inputs[f"DRIVE{i}@0"] = nrz(lane_bits[i]) / sq
# Step the whole chipts = chip_cal.setup_time_stepper(    time_step=dt, carrier_frequency=f_carrier, show_progress=True)out = ts.step(inputs=pf.TimeSeries(inputs, dt), show_progress=True)
# Discard the first pattern period, during which the cavities fillrx = {i: (np.real(out[f"RX{i}@0"]) * sq)[n_pattern * ui :] for i in range(n_channels)}
print()print(f"{'ch':>3s} {'mean mV':>9s} {'eye Q':>7s}")for i in range(n_channels):    print(f"{i:3d} {rx[i].mean()*1e3:9.3f} {eye_q(rx[i], lane_bits[i]):7.2f}")
simulating optical_io_chip, footprint 3113 x 1248 umUploading task 'Mode-Ribwaveguideon90nmslabTE500nm…'Uploading task 'Mode-Ribwaveguideon90nmslabTE500nm…'Uploading task 'Mode-StripwaveguideTE500nm…'Uploading task 'Mode-StripwaveguideTE500nm…'Starting task 'Mode-Ribwaveguideon90nmslabTE500nm': https://tidy3d.simulation.cloud/workbench?taskId=mo-5b403463-34dd-42ad-9173-dd80d904ec12Starting task 'Mode-Ribwaveguideon90nmslabTE500nm': https://tidy3d.simulation.cloud/workbench?taskId=mo-91e192e3-b5ee-4b59-8ce8-c9a5cd996c69Downloading data from 'Mode-Ribwaveguideon90nmslabTE500nm'…Downloading data from 'Mode-Ribwaveguideon90nmslabTE500nm'…Starting task 'Mode-StripwaveguideTE500nm': https://tidy3d.simulation.cloud/workbench?taskId=mo-82c8e5bd-d8b2-4139-9027-169e15e7c5d7Starting task 'Mode-StripwaveguideTE500nm': https://tidy3d.simulation.cloud/workbench?taskId=mo-dc7774cd-0598-4bcd-a203-2a56cefad1aaUploading task 'Mode-StripwaveguideTE500nm…'Uploading task 'Mode-StripwaveguideTE500nm…'Downloading data from 'Mode-StripwaveguideTE500nm'…Downloading data from 'Mode-StripwaveguideTE500nm'…Starting task 'Mode-StripwaveguideTE500nm': https://tidy3d.simulation.cloud/workbench?taskId=mo-8d8e2eb8-e80b-4ef5-b0cb-859a681e1ff1Starting task 'Mode-StripwaveguideTE500nm': https://tidy3d.simulation.cloud/workbench?taskId=mo-9fa7b336-21bc-45a7-a2f8-f3a34977e2e0Downloading data from 'Mode-StripwaveguideTE500nm'…Downloading data from 'Mode-StripwaveguideTE500nm'…
ch mean mV eye Q 0 168.008 7.51 1 155.512 4.89 2 158.163 5.63 3 162.952 5.34 4 121.218 5.27 5 124.855 6.39 6 93.403 4.72 7 98.909 6.70Every channel receives power and every channel carries its own data, so the wavelength plan, the calibration and the routing are all consistent.
What sets the eye quality here is no longer the receive filter, which passes the signal with room to spare. It is the other seven channels. Each one is rejected by the figure measured at the end of this notebook, not removed, and seven of them arrive together, so the crosstalk that reaches a detector sits only about ten decibels below the channel it is trying to read. Neither a filter response on its own nor a single modulator driven into a bare photodiode shows that.
probe_ch = n_channels // 2  # Channel used for the single-lane comparison
# Build a time axis two bit periods wide, centred on a transitiont_eye = (np.arange(2 * ui) - ui) * dt * 1e12
# One eye per channel, in two rows of fourfig, ax = plt.subplots(2, 4, figsize=(13, 6), tight_layout=True)for i, a in enumerate(ax.ravel()):
    # Roll each trace so the sampling instant lands in the middle    q, k = eye_q(rx[i], lane_bits[i], instant=True)
    # Overlay every two-bit segment of the detected trace    a.plot(        t_eye, eye_fold(np.roll(rx[i], -k)).T * 1e3, color="#1f4e79", lw=0.8, alpha=0.45    )    a.grid(True, alpha=0.2)    a.set(title=f"channel {i} (Q = {q:.2f})")for a in ax[1]:    a.set_xlabel("time (ps)")for a in ax[:, 0]:    a.set_ylabel("detected voltage (mV)")plt.show()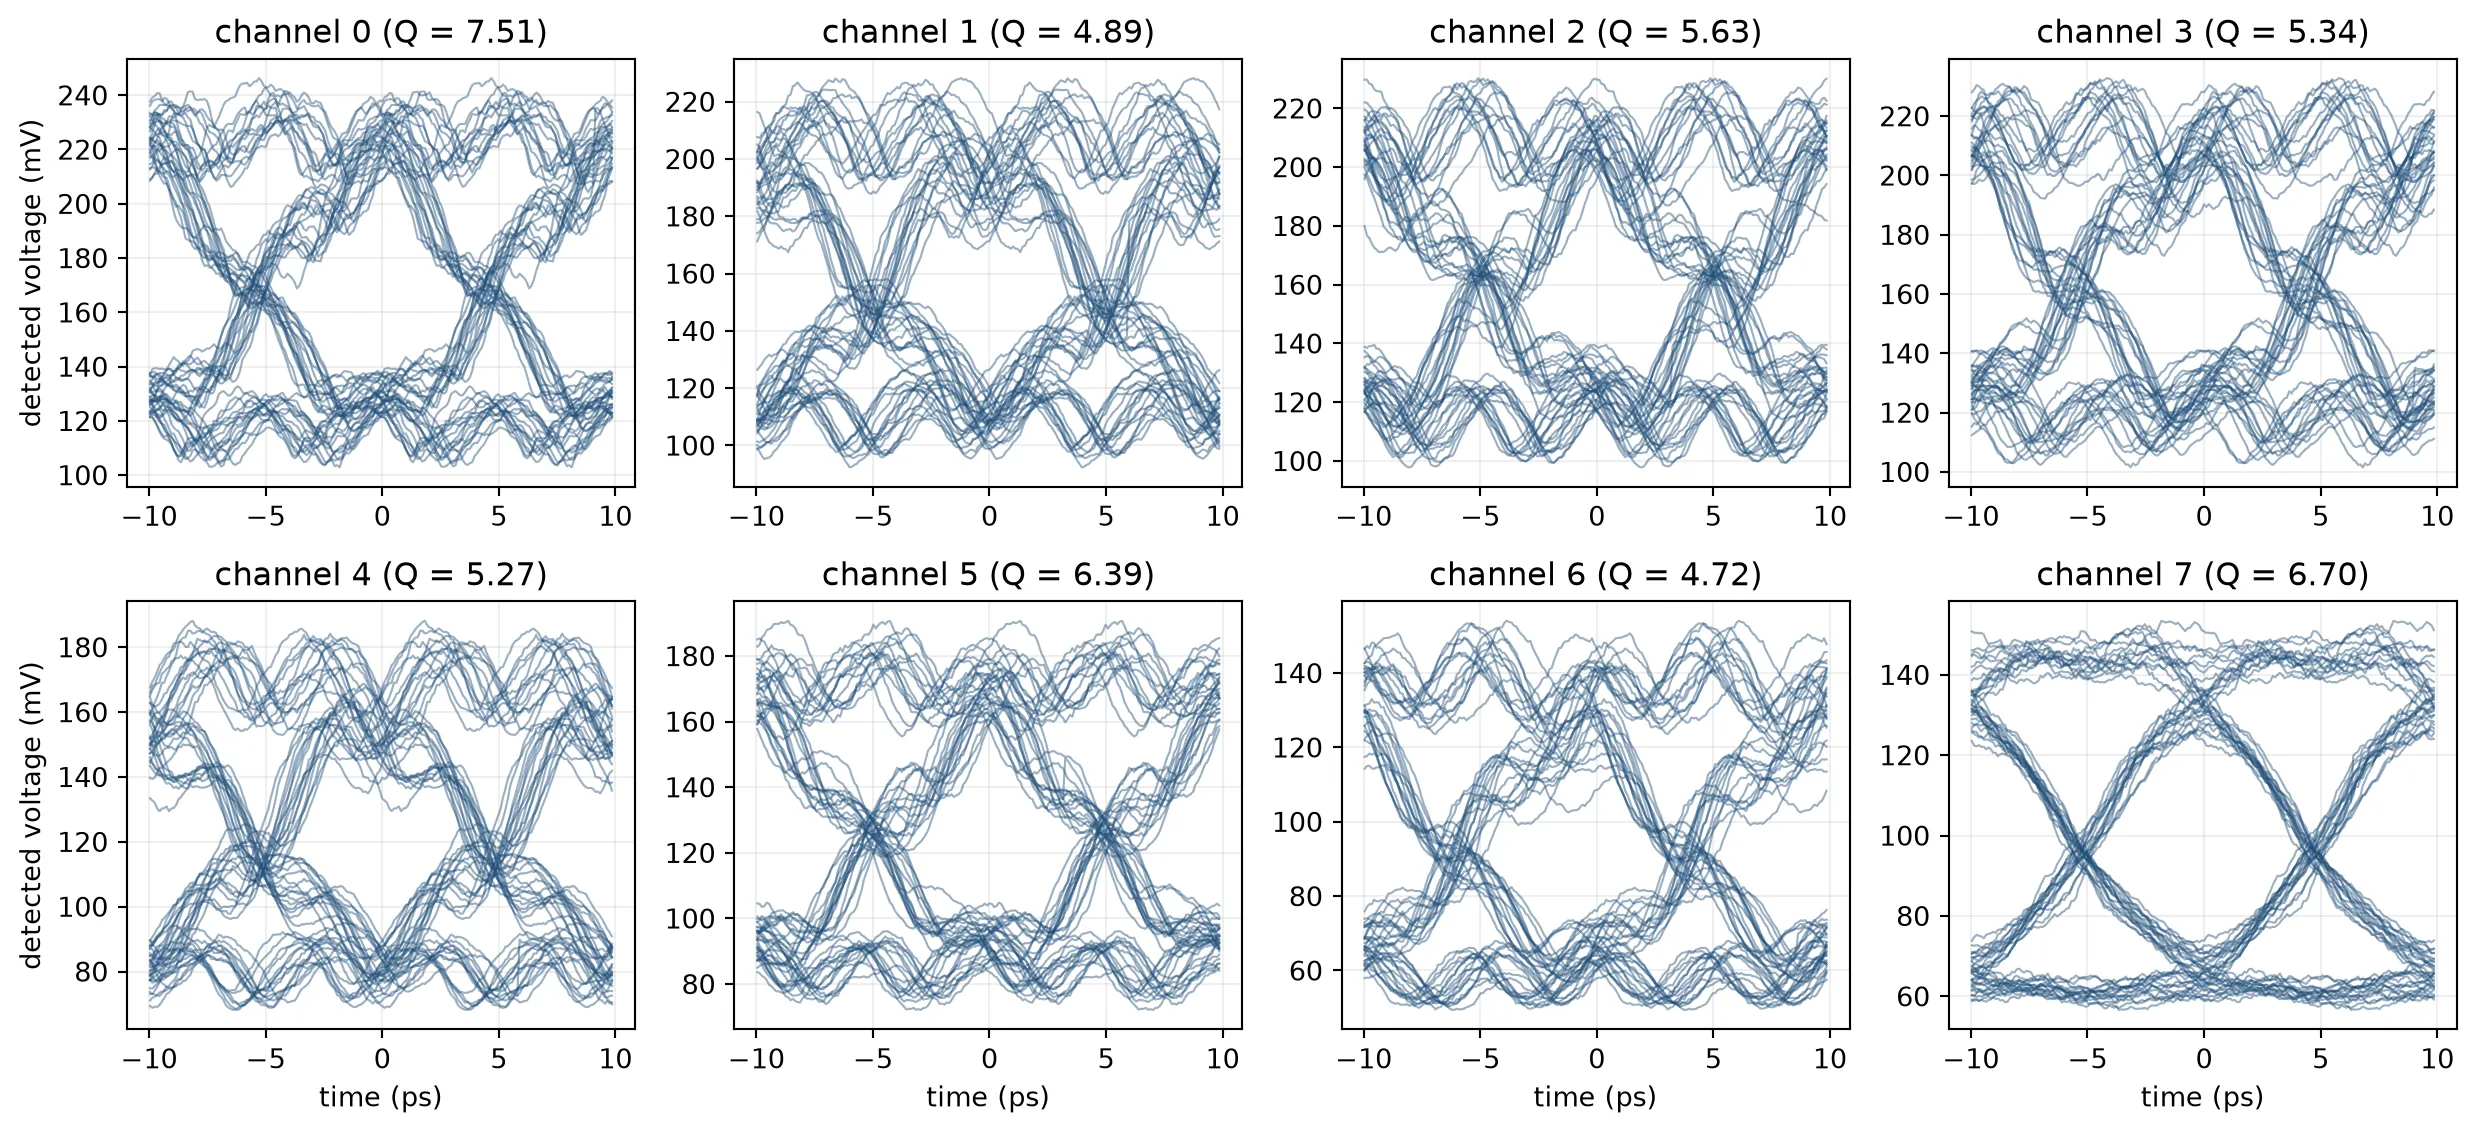
What the other seven channels cost
Section titled “What the other seven channels cost”The eyes above are measured with every channel modulating. Two more runs separate what the neighbours cost by modulating from what they cost by being there at all. The first keeps the full comb and drives one lane, holding the other seven at zero. The second also removes the other seven carriers, leaving one tone and one modulated channel.
def drive_chip(carriers, lanes):    """Drive the calibrated chip and return one channel's detected trace.
    'carriers' is the optical input, 'lanes' the channels that modulate.    """    inputs = {"FIBER@0": np.asarray(carriers, dtype=complex)}    for i in range(n_channels):        pattern = nrz(lane_bits[i]) if i in lanes else np.zeros(n_steps)        inputs[f"DRIVE{i}@0"] = pattern / sq
    # A fresh stepper each time, so no state carries over between runs    stepper = chip_cal.setup_time_stepper(        time_step=dt, carrier_frequency=f_carrier, show_progress=True    )    detected = stepper.step(inputs=pf.TimeSeries(inputs, dt), show_progress=True)    return (np.real(detected[f"RX{probe_ch}@0"]) * sq)[n_pattern * ui :]
# One tone on the probe channel, instead of the eight-line combone_tone = np.sqrt(p_line) * np.exp(    -2j * np.pi * (laser_freqs[probe_ch] - f_carrier) * t)
traces = {    "eight carriers, eight modulating": rx[probe_ch],    "eight carriers, one modulating": drive_chip(comb, {probe_ch}),    "one carrier, one modulating": drive_chip(one_tone, {probe_ch}),}
print(f"channel {probe_ch}")print(f"{'':36s} {'eye Q':>7s} {'mean mV':>9s}")for label, trace in traces.items():    print(        f"{label:36s} {eye_q(trace, lane_bits[probe_ch]):7.2f} "        f"{trace.mean()*1e3:9.1f}"    )
channel 4 eye Q mean mVeight carriers, eight modulating 5.27 121.2eight carriers, one modulating 5.19 121.0one carrier, one modulating 7.68 118.2# The three eyes side by side, on shared axesfig, ax = plt.subplots(1, 3, figsize=(13, 3.6), tight_layout=True, sharey=True)for a, (label, trace) in zip(ax, traces.items()): q, k = eye_q(trace, lane_bits[probe_ch], instant=True) a.plot( t_eye, eye_fold(np.roll(trace, -k)).T * 1e3, color="#1f4e79", alpha=0.25, lw=0.7 ) a.set_title(f"{label}\nQ = {q:.2f}", fontsize=9) a.set_xlabel("time (ps)") a.grid(alpha=0.3)ax[0].set_ylabel("detected (mV)")plt.show()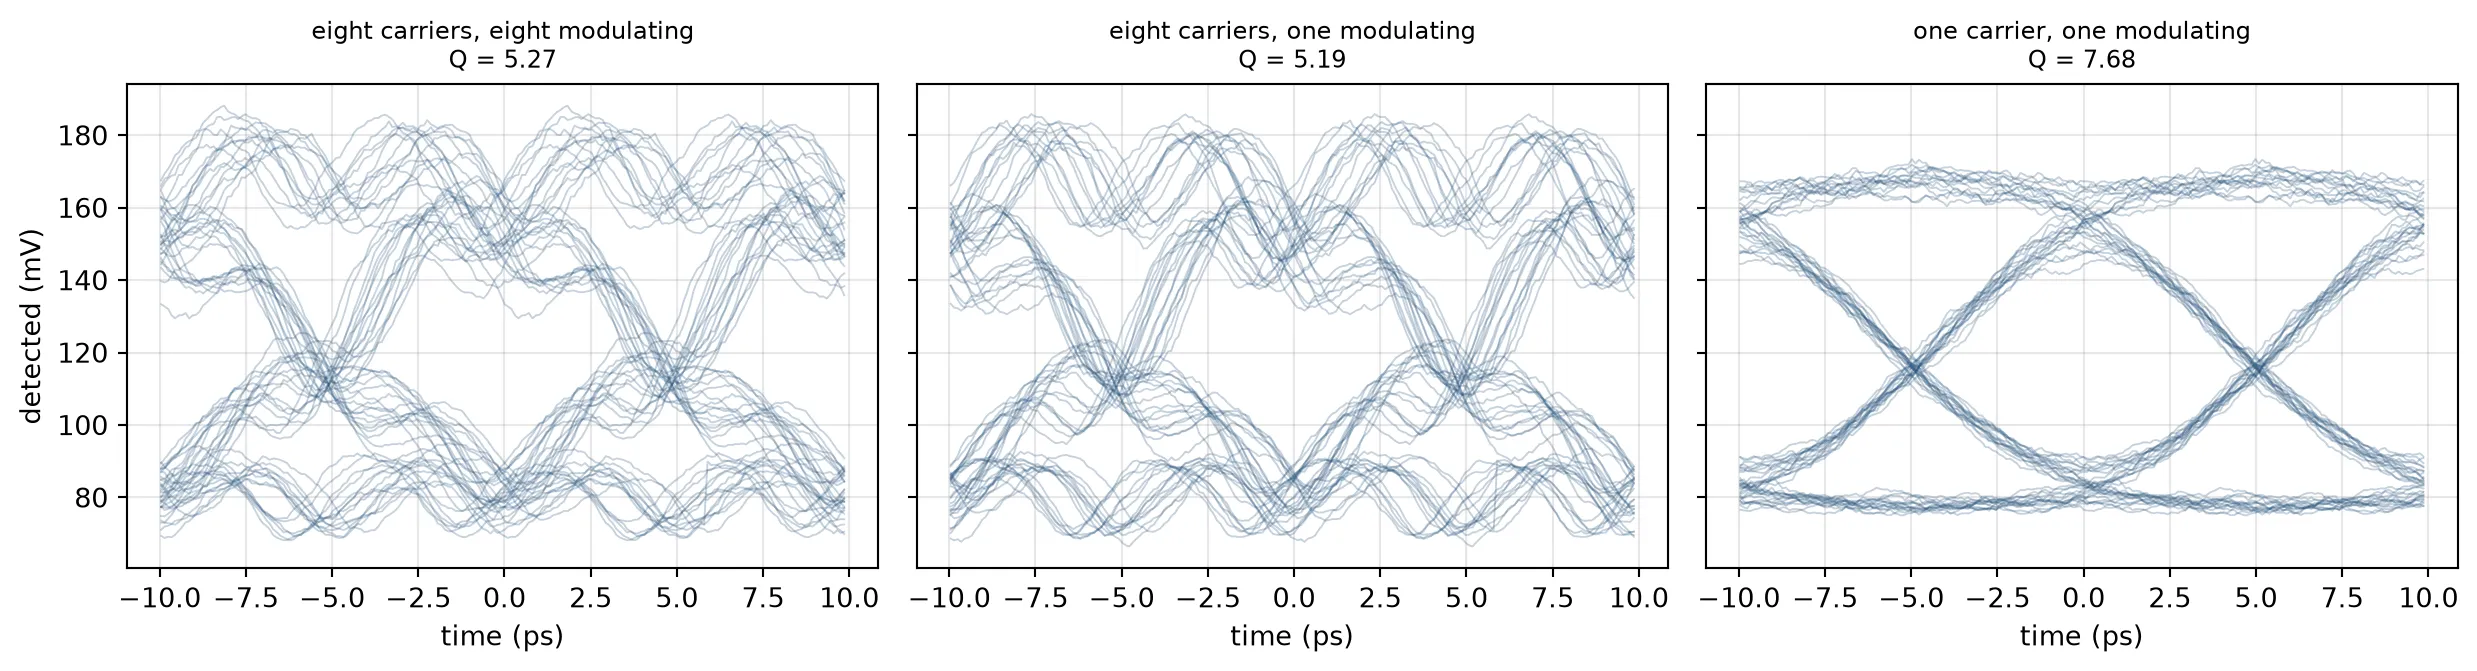
Modulating the neighbours does not measurably change the eye. What costs is their presence: removing the other seven carriers takes this channel from Q 5.1 to Q 7.7.
The reason is that a photodiode adds fields, not powers. The leaked carriers raise the mean by about 3 mV, which is their power at the 18.6 dB of rejection measured below. They also beat against the wanted signal, and that term goes as the square root of the two powers, so an 18.6 dB power leak is a 9.3 dB beat. It lands at the 200 GHz channel spacing, where the first-order 60 GHz detector still passes about a quarter of it.
The beat is visible in the first two eyes: the traces carry an oscillation about 5 ps long, which is one period at the channel spacing, so the rails are rippled rather than blurred. The third eye has nothing left to beat against, and its rails are flat.
That also explains why modulation makes no difference. The beat follows the leaked carrier amplitude, which is there whether or not the neighbour carries data.
The chip’s own spectrum
Section titled “The chip’s own spectrum”Everything above was measured on a waveform. The same calibrated chip can also be swept, which puts every resonance and every laser line on one axis and shows where the light actually goes.
The figure has three rows.
The receive bus, from the fibre to the far end. Each channel puts two notches on it rather than one, which is not obvious and is worth an explanation. The third row gives it.
Every channel output, all eight on one axis. The photodiodes take the drop ports, so those are not available as optical outputs on the chip that was driven. The same chip is therefore assembled once more with the detectors left off, which exposes each channel’s drop directly. Nothing else about it changes, so this is the same eight paths the waveform took.
One channel, magnified, with the bus trace laid over the two rings’ own through responses. This is the row that says which notch is which.
# Sweep the same assembled chip from the fibre port, on the calibration's gridprobe = scan[np.abs(scan - laser_freqs.mean()) < 0.5 * channel_span + 400e9]s_chip = chip_cal.s_matrix(    probe, model_kwargs={"inputs": ["FIBER"]}, show_progress=True)
# Rebuild the chip without detectors, so each drop becomes an optical portrx_probe, _, _ = build_rx_bank(    [filter_with_bond_pads(filter_cell=f, detector=False) for f in flts_cal],    name="rx_bank_probe",)s_probe = assemble_chip(tx_cal, rx_probe, name="optical_io_chip_probe").s_matrix(    probe, model_kwargs={"inputs": ["FIBER"]}, show_progress=True)
# Take the light left on the receive bus once all eight have been droppedthru = np.abs(s_chip[("FIBER@0", "RX_THRU@0")]) ** 2
# Cut one channel's worth of frequency out, for the magnified rowmid = n_channels // 2near = np.abs(probe - laser_freqs[mid]) < 0.7 * channel_gridoff = (probe[near] - laser_freqs[mid]) * 1e-9
fig, ax = plt.subplots(3, 1, figsize=(11, 9.5), tight_layout=True)
# Plot the receive bus end to endax[0].plot((probe - f0) * 1e-12, 10 * np.log10(thru), lw=1.8, color="#1f4e79")
# Plot fibre to each channel's own output, all eight togetherfor i in range(n_channels):    out = np.abs(s_probe[("FIBER@0", f"RX{i}@0")]) ** 2    ax[1].plot((probe - f0) * 1e-12, 10 * np.log10(out), lw=1.6, label=f"ch {i}")ax[1].legend(fontsize=8, ncol=8, loc="lower center")
# Mark the comb on both wide rowsfor a in ax[:2]:    for fl in laser_freqs:        a.axvline((fl - f0) * 1e-12, color="crimson", lw=0.7, alpha=0.7)
    # Hold the view to the comb, clear of the free spectral range repeats    a.set_xlim(        (laser_freqs.min() - f0 - 250e9) * 1e-12,        (laser_freqs.max() - f0 + 250e9) * 1e-12,    )
# Plot the same bus trace over one channel, against what each ring does aloneax[2].plot(    off,    10 * np.log10(thru[near] / thru.max()),    lw=2.4,    color="#1f4e79",    label="the receive bus",)mod_t = (    np.abs(mods_cal[mid].s_matrix(probe[near], show_progress=False)[("P0@0", "P1@0")])    ** 2)flt_t = (    np.abs(flts_cal[mid].s_matrix(probe[near], show_progress=False)[("in@0", "thru@0")])    ** 2)ax[2].plot(    off,    10 * np.log10(mod_t),    lw=1.6,    ls="--",    color="#c8385a",    label="its modulator alone",)ax[2].plot(    off, 10 * np.log10(flt_t), lw=1.6, ls=":", color="#3aa596", label="its filter alone")ax[2].axvline(0, color="crimson", lw=0.9, label="the laser line")ax[2].legend(fontsize=9, loc="lower right")
# Print where each ring actually puts its notchprint(    f"filter notches at {off[off < 0][np.argmin(flt_t[off < 0])]:+.0f} and "    f"{off[off > 0][np.argmin(flt_t[off > 0])]:+.0f} GHz from the line")print(    f"modulator dip at {off[np.argmin(mod_t)]:+.0f} GHz, "    f"{10*np.log10(mod_t.min()):.1f} dB deep")
for a in ax:    a.grid(True, alpha=0.25)ax[0].set(    ylabel="bus transmission (dB)",    ylim=(-45, 2),    title="fibre to the far end of the receive bus",)ax[1].set(    ylabel="channel output (dB)",    ylim=(-45, 2),    title="fibre to each of the eight channel outputs",)ax[2].set(    xlabel=f"offset from channel {mid}'s laser line (GHz)",    ylabel="normalised (dB)",    ylim=(-40, 2),    title="one channel, magnified: which notch belongs to which ring",)plt.show()
# Print what is left of each comb line, and what reaches its own detectorprint(f"{'ch':>3s} {'left on the bus':>16s} {'at its output':>14s}")for i in range(n_channels):    out = np.abs(s_probe[("FIBER@0", f"RX{i}@0")]) ** 2    print(        f"{i:3d} {10*np.log10(np.interp(laser_freqs[i], probe, thru)/thru.max()):13.1f} dB"        f" {10*np.log10(np.interp(laser_freqs[i], probe, out)):11.1f} dB"    )
Uploading task 'Mode-Ribwaveguideon90nmslabTE500nm…'Uploading task 'Mode-Ribwaveguideon90nmslabTE500nm…'Uploading task 'Mode-StripwaveguideTE500nm…'Uploading task 'Mode-StripwaveguideTE500nm…'Uploading task 'Mode-StripwaveguideTE500nm…'Uploading task 'Mode-StripwaveguideTE500nm…'Starting task 'Mode-Ribwaveguideon90nmslabTE500nm': https://tidy3d.simulation.cloud/workbench?taskId=mo-e7061a66-3744-4ac7-b7ae-9a64c4ecc452Starting task 'Mode-StripwaveguideTE500nm': https://tidy3d.simulation.cloud/workbench?taskId=mo-934a1d0d-b533-496b-b0a0-62e55792bbc1Starting task 'Mode-Ribwaveguideon90nmslabTE500nm': https://tidy3d.simulation.cloud/workbench?taskId=mo-c196f68d-5651-4455-9d32-4b7f9776cf0eStarting task 'Mode-StripwaveguideTE500nm': https://tidy3d.simulation.cloud/workbench?taskId=mo-2f831df2-7a37-4eb9-9b82-9ad2f3cd26feStarting task 'Mode-StripwaveguideTE500nm': https://tidy3d.simulation.cloud/workbench?taskId=mo-f7a23b6a-0ccd-4805-869d-71d835b57565Starting task 'Mode-StripwaveguideTE500nm': https://tidy3d.simulation.cloud/workbench?taskId=mo-927aa946-5522-4f06-a9bb-ca690fc3d92cDownloading data from 'Mode-Ribwaveguideon90nmslabTE500nm'…Downloading data from 'Mode-StripwaveguideTE500nm'…Downloading data from 'Mode-Ribwaveguideon90nmslabTE500nm'…Downloading data from 'Mode-StripwaveguideTE500nm'…Downloading data from 'Mode-StripwaveguideTE500nm'…Downloading data from 'Mode-StripwaveguideTE500nm'…filter notches at -27 and +28 GHz from the linemodulator dip at +33 GHz, -19.4 dB deep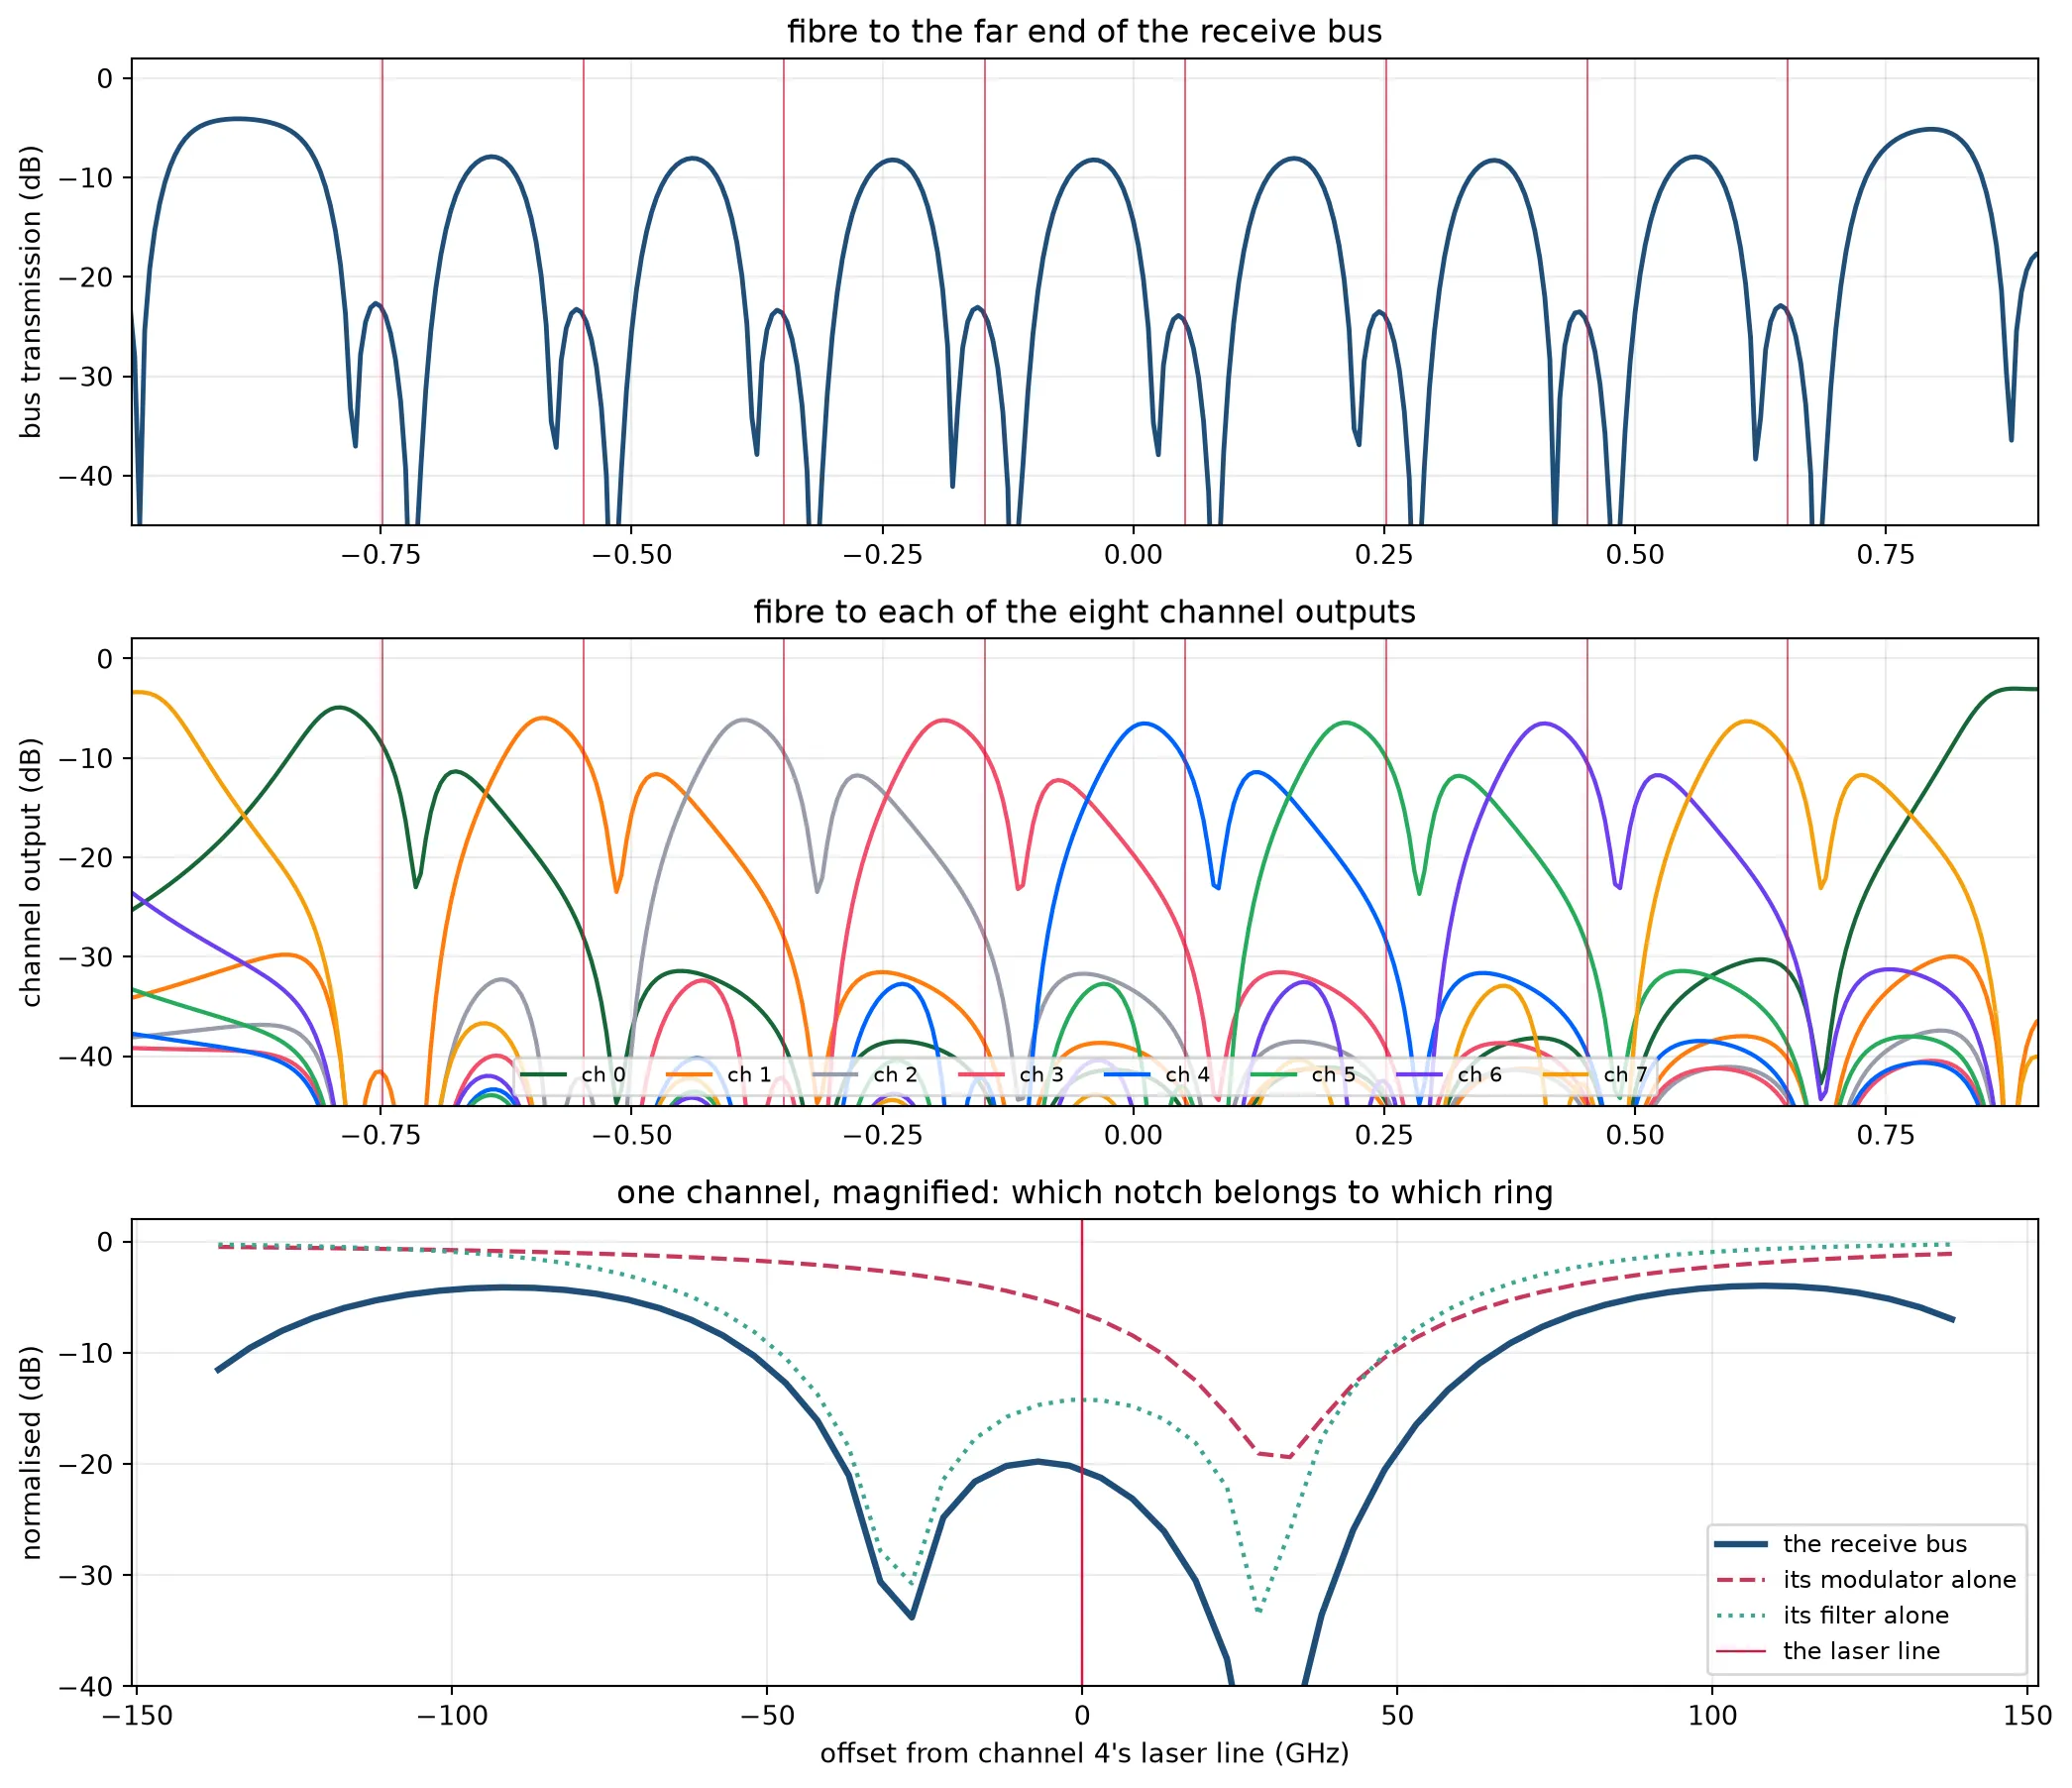
ch left on the bus at its output 0 -19.2 dB -8.7 dB 1 -19.8 dB -9.4 dB 2 -19.9 dB -9.5 dB 3 -19.8 dB -9.5 dB 4 -20.6 dB -10.4 dB 5 -20.1 dB -10.0 dB 6 -20.5 dB -10.4 dB 7 -19.5 dB -9.6 dBThe magnified row answers the question the wide one raises, and the answer is not the obvious one. Both notches belong to the filter.
A series-coupled pair has two supermodes, so it drops over a band rather than at a line, and its through port has two minima, one at each edge of that band. They are what the wide row shows, and they are deep because at those two frequencies the filter has taken almost everything off the bus. The modulator is the shallow feature between them, about 20 dB deep and parked the bias detuning above the line so that its flank rather than its floor does the modulating. On the bus it is swallowed by the filter’s own notch.
This is worth knowing before a measurement rather than after one. A probe station sweeping the through port of one of these channels sees a pair of notches per channel, and reading either of them as a resonance to be centred on the laser would put the filter in the wrong place.
The middle row is the demultiplexer doing its job seen end to end: eight passbands, each on its own line, each carrying the loss of the facet, the modulators it passed, the monitor tap and the millimetres of routing between the banks.
Demultiplexer bandwidth against the data rate
Section titled “Demultiplexer bandwidth against the data rate”The receive filter has to satisfy two requirements that act on the same quantity. It must be narrow enough that the neighbouring channel, 200 GHz away, is rejected, and wide enough that a 100 Gb/s signal passes without distortion. The measurement below puts both on one axis: the drop response of the calibrated filter, with the signal bandwidth shaded and the neighbouring channel positions marked.
# Sweep one calibrated filter's drop, out past the neighbouring channelsprobe = laser_freqs[n_channels // 2] + np.linspace(-1.5, 1.5, 121) * channel_griddrop = (    np.abs(        flts_cal[n_channels // 2].s_matrix(probe, show_progress=False)[            ("in@0", "drop@0")        ]    )    ** 2)
# Take everything within 3 dB of the peak, whose span is the passbandinband = probe[drop >= 0.5 * drop.max()]width = inband.max() - inband.min()
# Sample at the channel itself and at its neighbourcentre = int(np.argmin(np.abs(probe - laser_freqs[n_channels // 2])))adjacent = int(np.argmin(np.abs(probe - laser_freqs[n_channels // 2] - channel_grid)))
fig, ax = plt.subplots(figsize=(7.5, 3.4), tight_layout=True)
# Plot the drop response against offset from the channelax.plot((probe - laser_freqs[n_channels // 2]) * 1e-9, 10 * np.log10(drop), lw=1.3)
# Shade the bandwidth a 100 Gb/s NRZ signal occupiesax.axvspan(    -bit_rate * 1e-9 / 2,    bit_rate * 1e-9 / 2,    color="tab:orange",    alpha=0.18,    label=f"{bit_rate*1e-9:.0f} Gb/s signal",)for sign in (-1, 1):    ax.axvline(        sign * channel_grid * 1e-9,        color="crimson",        ls="--",        lw=1,        label="neighbouring channel" if sign > 0 else None,    )ax.set(    xlabel="offset from the channel (GHz)",    ylabel="drop transmission (dB)",    ylim=(-45, 2),    title="demultiplexer passband and the signal it carries",)ax.legend(fontsize=8)ax.grid(True, alpha=0.3)plt.show()
print(f"passband, 3 dB width    {width*1e-9:6.0f} GHz")print(f"signal bandwidth        {bit_rate*1e-9:6.0f} GHz")print(f"rejection one channel away {10*np.log10(drop[centre]/drop[adjacent]):5.1f} dB")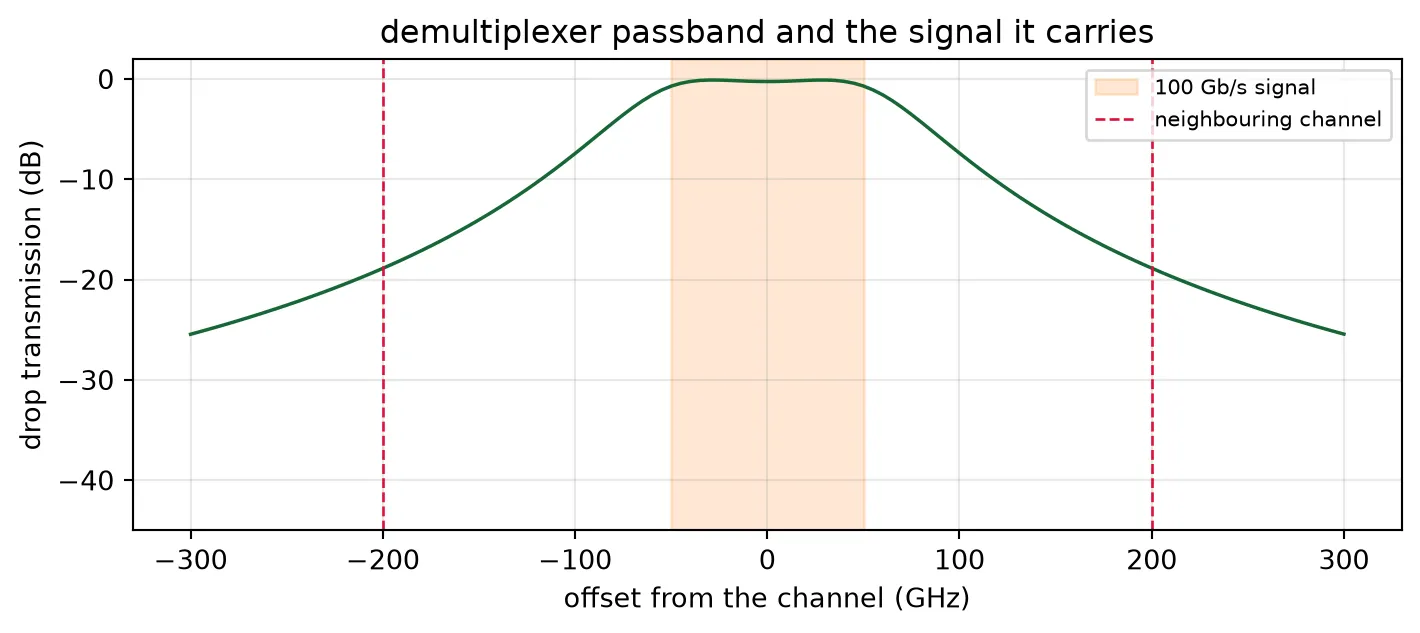
passband, 3 dB width 140 GHzsignal bandwidth 100 GHzrejection one channel away 18.6 dBBoth requirements are satisfied, with little to spare. The passband is wider than the signal, so the signal passes, and the neighbouring channel is close to 20 dB down.
This is the requirement that a link simulation creates. An earlier version of this filter was a cascade of two independent add-drop rings, and it was chosen on its crosstalk figure alone: 74 GHz of passband with 21.7 dB of rejection. On paper that is the better filter. Driven with data it closed the eye on every channel, because a 74 GHz passband removes most of the spectrum of a 100 Gb/s signal, and no frequency-domain check of the filter, the modulator or the layout showed it.
The reason a cascade cannot do better is its shape. Two add-drop rings in series multiply two Lorentzians, so the skirts still fall at one ring’s rate: every gigahertz of passband bought back costs the rejection it bought. Coupling the two rings to each other makes the filter second order instead. Its skirts fall twice as fast, so the same rejection arrives at nearly twice the width, which is what the eyes above are worth.
What limits the link now is the rejection rather than the passband. Seven neighbours arrive at the figure printed above, and that, not the modulator and not the routing, is what sets the eye quality the chip reaches. A third ring, or a wider channel grid, is where the next improvement comes from.
Link budget
Section titled “Link budget”Each term below was measured somewhere in the series. The optical budget is a product of scalars, so the power it predicts at the detector can be compared with the power the time-domain run delivered.
# Measure one biased modulator's loss at its own carrier, undrivenf_ch = [laser_freqs[n_channels // 2]]tx_il = -10 * np.log10(    np.abs(        mods_cal[n_channels // 2].s_matrix(f_ch, show_progress=False)[("P0@0", "P1@0")]    )[0]    ** 2)
# Measure what the same carrier loses passing the other sevenidle_il = sum(    -10    * np.log10(        np.abs(mods_cal[i].s_matrix(f_ch, show_progress=False)[("P0@0", "P1@0")])[0]        ** 2    )    for i in range(n_channels)    if i != n_channels // 2)
# Measure the loss at the centre of the filter that drops this channelrx_il = -10 * np.log10(drop[centre])
# Measure the waveguide length between the banks, which carries the routing losslink_um = sum(    pf.route_length(r.component)    for r in chip_cal.references    if "route" in str(r.component.parametric_function or ""))
terms = [    ("comb line at the facet", 10 * np.log10(p_line * 1e3), "dBm"),    ("facet coupling", -1.5, "dB"),    ("its own modulator", -tx_il, "dB"),    ("seven idle modulators", -idle_il, "dB"),    ("monitor tap", -0.05, "dB"),    (f"on-chip link, {link_um:.0f} um", -scattering_db_cm * 1e-4 * link_um, "dB"),    ("demultiplexer drop", -rx_il, "dB"),]total = sum(v for _, v, _ in terms)
print(f"{'term':28s} {'value':>9s}")for name, v, unit in terms:    print(f"{name:28s} {v:9.2f} {unit}")print("-" * 40)print(f"{'received power':28s} {total:9.2f} dBm")
# Compare the budget with the run, through the detector responsivity and gainp_rx = 10 ** (total / 10) * 1e-3print()print(f"budget predicts   {p_rx*0.9*1e6:8.2f} uA")print(f"simulation gives  {rx[n_channels//2].mean()/1e3*1e6:8.2f} uA")
term valuecomb line at the facet 3.01 dBmfacet coupling -1.50 dBits own modulator -6.42 dBseven idle modulators -1.10 dBmonitor tap -0.05 dBon-chip link, 2352 um -0.47 dBdemultiplexer drop -0.26 dB----------------------------------------received power -6.79 dBm
budget predicts 188.48 uAsimulation gives 121.22 uAThe two disagree, and the direction is informative. The budget is a single-frequency calculation on an undriven chip: it takes each modulator’s transmission at its bias point and multiplies. In the run every modulator is swinging, this channel’s and the seven it passes on the way out, and the mean transmission of a ring sweeping across its own flank is not the transmission at the bias point. A budget made of scalars has nowhere to put that.
Power and energy per bit
Section titled “Power and energy per bit”The optical power is set by the comb, the electrical power by the drivers and the heaters.
# Add up the aggregate rate across all channelsline_rate = n_channels * bit_rate
# Work out the driver power, a CV^2/4 cost per channel on a random patternp_driver = 0.25 * c_junction * 1e-15 * v_drive**2 * bit_rate * n_channels
# Take the heater power from the calibration abovep_tuning = (mod_mw.sum() + flt_mw.sum()) * 1e-3
# Add up the optical power launched into the chipp_optical = n_channels * p_line
print(f"{'':22s} {'mW':>9s} {'fJ/bit':>9s}")for name, p in (    ("comb, on chip", p_optical),    ("drivers", p_driver),    ("heaters", p_tuning),):    print(f"{name:22s} {p*1e3:9.2f} {p/line_rate*1e15:9.1f}")print("-" * 42)total_p = p_optical + p_driver + p_tuningprint(f"{'total':22s} {total_p*1e3:9.2f} {total_p/line_rate*1e15:9.1f}")print()print(f"per channel {bit_rate*1e-9:.1f} Gb/s, {line_rate*1e-12:.3f} Tb/s per fibre")
mW fJ/bitcomb, on chip 16.00 19.9drivers 32.97 41.0heaters 15.78 19.6------------------------------------------total 64.75 80.6
per channel 100.4 Gb/s, 0.803 Tb/s per fibreSummary
Section titled “Summary”An eight-channel microring transceiver on 220 nm silicon, simulated post layout from the same component that produced the mask.
| Line rate | 8 channels at 100 Gb/s on a 200 GHz grid |
| Die | 3113 x 1248 um, 3.88 mm2, design rule clean |
| Modulator | 5 um ring, 113 GHz linewidth, biased 0.289 linewidths off resonance |
| Demultiplexer | two series-coupled racetracks per channel, flat top |
| Tuning | measured heater efficiency, sixteen rings calibrated by temperature |
| Monitor | one 1 percent tap and photodiode at the transmit output |
Four solvers fed one circuit. FDTD set the coupling gaps and the waveguide transitions, mode solving gave every index and the thermo-optic shift, CHARGE gave the junction its efficiency and its loss, HEAT gave the kelvin per milliwatt the tuning budget rests on, and the circuit simulator turned all of it into a waveform.
Two results could only come from the link, and neither is visible in a layout or in a frequency-domain check of any single component.
The wavelength plan had been drawn with a fixed index where the group index was needed, which placed the eight resonances on the wrong comb spacing.
The demultiplexer had to be redesigned. Selected on its crosstalk figure alone, it was a cascade of two independent rings whose passband was narrower than the data rate it carried, and it closed the eye on every channel. A crosstalk figure carries no information about data rate. Coupling the two rings to each other makes the filter second order, which allows one passband to be wide enough for the signal and steep enough for the neighbour.