Supersonic Aerodynamics of a Hammerhead Launch Vehicle#
Introduction#
This validation study aims to assess the accuracy of Flexcompute’s Flow360 solver in predicting supersonic fluid behavior, including shock formation, shock–boundary-layer interaction, and other flow features critical to the design of transonic and supersonic vehicles.
With the advent of reusable launch vehicles and cost-effective supersonic flight, supersonic computational fluid dynamics has gained renewed interest. Reusability has enabled more frequent design iterations, tighter performance margins, and increased reliance on numerical prediction earlier in the design cycle, where rapid turnaround and computational efficiency are often as important as absolute fidelity.
Operating in the transonic and supersonic regimes introduces flow phenomena that are both highly nonlinear and strongly coupled, including shock-induced separation, large pressure gradients, and unsteady wake interactions. These effects can have a significant impact on aerodynamic loads and stability characteristics, particularly for configurations featuring geometric discontinuities such as payload fairings, steps, or diameter changes. Accurately capturing these phenomena places stringent requirements on numerical methods, turbulence modeling, and grid resolution.
A key objective of this work is to demonstrate that these critical supersonic flow features and aerodynamic trends can be captured accurately using Flow360. Specifically, the analysis focuses on steady RANS simulations. This study highlights Flow360’s ability to deliver reliable aerodynamic predictions at a fraction of the computational cost typically associated with high-fidelity supersonic simulations.
This study contributes to that effort by evaluating Flow360’s ability to reproduce key supersonic aerodynamic trends and flow features for a representative Hammerhead Launch Vehicle, using published experimental data as a reference.
In addition to assessing the solver’s predictive capabilities, this analysis also evaluates the robustness of Flow360’s automated meshing algorithm and its ability to generate meshes that are high-quality, and computationally efficient for complex supersonic configurations, reinforcing its suitability for rapid design iteration and parametric studies.
To guide the reader through the validation process, this document is structured into the following sections:
Geometry and Setup – Definition of the hammerhead launch vehicle configuration.
Meshing Strategy – Description of the meshing approach, including refinement strategies based on flow conditions.
Simulation Parameters – Summary of solver configuration, turbulence modeling, and boundary condition definitions.
Results and Validation - Visualizations, aerodynamic coefficients and comparison with experimental data.
Geometry and Setup#
The geometry used in this validation study corresponds to a representative hammerhead launch vehicle configuration, based on the Taurus design described by Langone et al [1]. The vehicle features an axisymmetric, multi-stage body with a large-diameter payload fairing mounted above smaller-diameter upper stages, forming the characteristic hammerhead geometry.
The configuration consists of a first-stage booster with a constant diameter, followed by an interstage that tapers to a smaller diameter upper stage stack. The payload section is modeled as a biconic fairing with a maximum diameter significantly larger than that of the underlying stages, introducing a rearward-facing step at the fairing interface. This geometric discontinuity is known to generate strong shock–boundary-layer interactions and separated flow regions in the transonic and supersonic regimes, making it a particularly challenging and relevant validation case.
All geometric dimensions, reference lengths, and the reference area are taken directly from the published paper to ensure consistency with the experimental data used for validation. Forces and moments are nondimensionalized using the reference area corresponding to the maximum vehicle cross-sectional area and a reference length equal to the first-stage diameter, following the conventions defined in the reference paper.
By relying on a well-documented, publicly available geometry, this case minimizes uncertainties related to geometric modeling. As a result, any discrepancies between the numerical and experimental results can be attributed primarily to modeling assumptions, meshing strategy, and experimental uncertainties rather than differences in configuration. This provides a reliable and consistent foundation for validation.
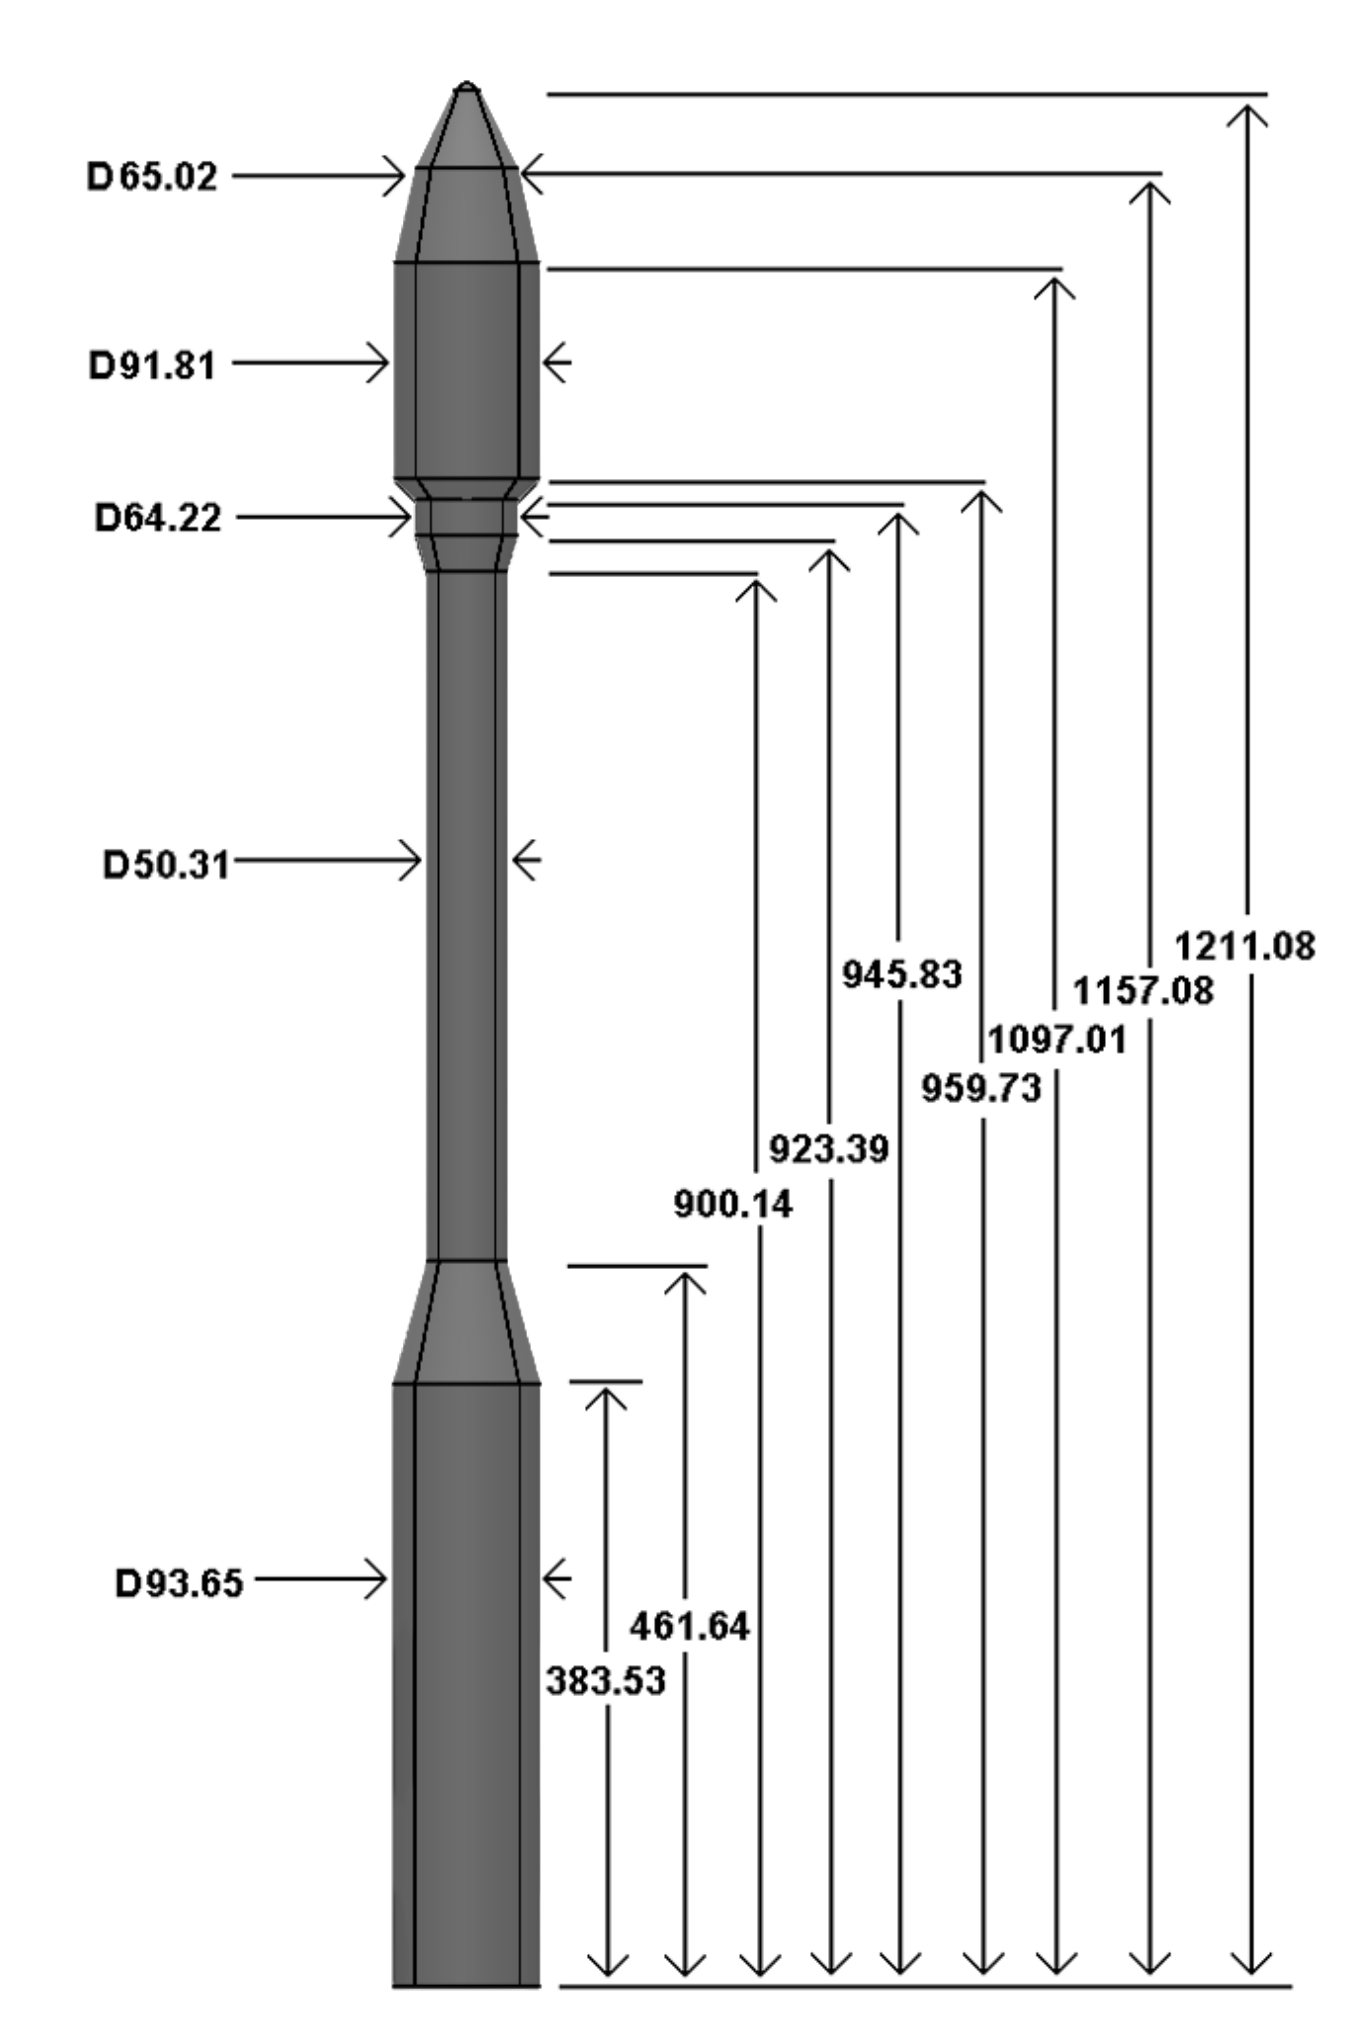
Flow360 visualization of the Taurus Rocket with measurements annotations in inches, per [1].#
Meshing Strategy#
The mesh was generated with Flow360’s automated meshing workflow keeping in mind the dominant flow features associated with transonic and supersonic flow. The following key objectives guided the mesh definition process:
Surface resolution: a global maximum surface edge length was prescribed to ensure adequate resolution of the vehicle surface while maintaining computational efficiency. Additional localized surface refinement was applied in regions of strong geometric curvature, specifically at the nose, along the biconic payload fairing, and at cone–cylinder junctions. In these regions, the curvature resolution angle was reduced and the maximum surface edge length was locally tightened to increase surface mesh density, ensuring accurate representation of curvature-driven flow features and shock formation.
Boundary-layer resolution: the first boundary-layer cell height was selected to target wall-resolved simulations with a nondimensional wall distance \(y^{+}\) smaller than 1 over the vehicle surface. The first-layer thickness was computed based on the highest freestream velocity considered in the study, ensuring sufficient near-wall resolution across all simulated flow conditions. The chosen settings guarantee conservative wall resolution under the most demanding conditions.
Volume growth and near-body refinement: a low boundary-layer growth rate was used to smoothly transition from the near-wall region into the outer flow, preserving resolution across the boundary layer and wake.
The resulting mesh contains approximately 32 million nodes, striking a balance between numerical accuracy and computational efficiency. The final surface and volume meshing parameters used for this validation case are summarized in the figure below.
Section |
Parameter |
Value |
Units |
|---|---|---|---|
Surface mesh |
Surface edge growth rate |
1.2 |
— |
Surface max edge length |
8 |
inch |
|
Max Curvature resolution angle |
2 |
° |
|
Volume mesh |
Boundary layer growth rate |
1.1 |
— |
Boundary layer first layer thickness |
4e-5 |
inch |
|
Surface Refinements |
— |
||
Nose max edge length |
0.35 |
inch |
|
Nose surface curvature resolution |
01 |
° |
|
Conical Sections max edge length |
1.5 |
inch |
|
Conical Sections curvature resolution |
1 |
° |
The following figure presents a slice of the volume mesh along the symmetry plane and a series of detailed surface-mesh close-ups:
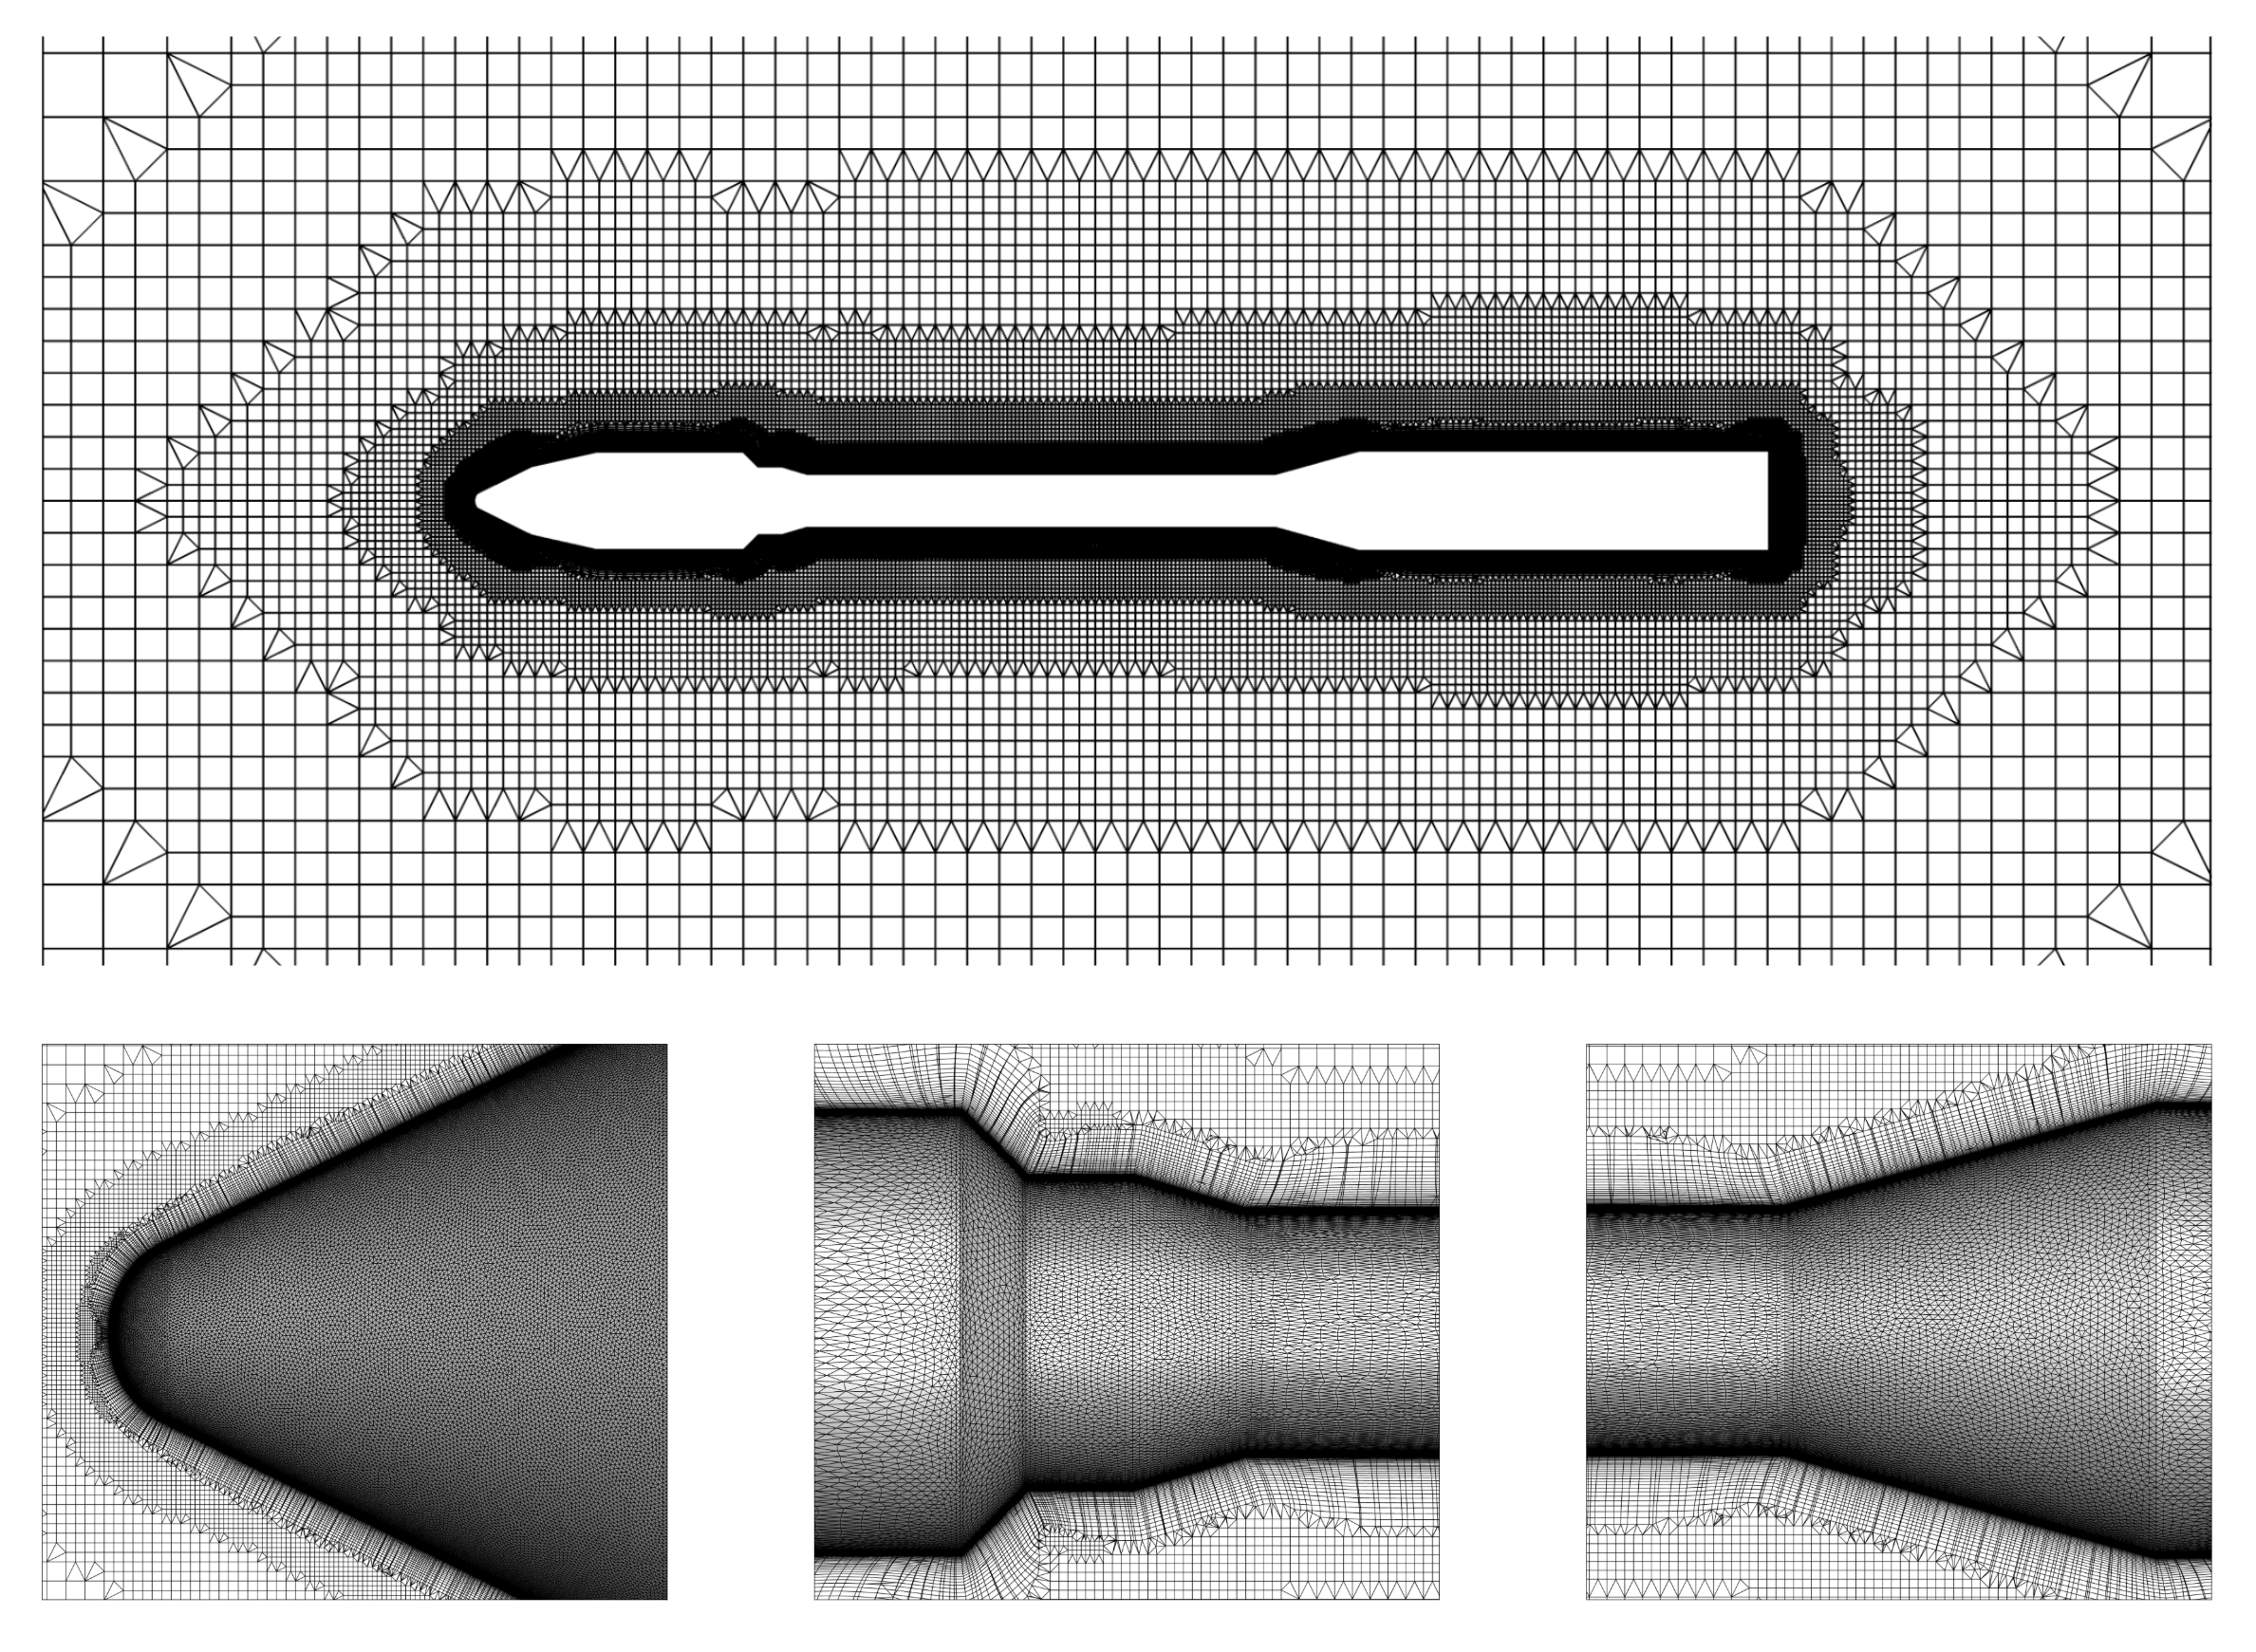
Overview of surface and volume mesh.#
Simulation Parameters#
To ensure a consistent basis for comparison, the numerical simulations were performed at the same freestream conditions reported in the wind-tunnel experiments [1]. The computational domain was generated using an automated procedure and extended to a size approximately 100 times larger than the largest length of the vehicle, minimizing errors associated with wave reflections at the far-field boundaries.
The tested freestream conditions are listed below:
Test |
I |
II |
III |
|---|---|---|---|
Mach Number |
1.187 |
2.410 |
4.752 |
Pressure (psf) |
1449 |
525.2 |
103.8 |
Temperature (R) |
443.6 |
271.9 |
111.6 |
Density (kg/m³) |
0.981 |
0.580 |
0.279 |
Reynolds number (10⁶/ft) |
7.13 |
10.3 |
16.0 |
Angle of attack (°) |
2 |
2 |
2 |
Solver parameters were selected and tuned to ensure accurate representation of the strongly compressible flow phenomena present under these conditions.
Section |
Parameter |
Value |
Units |
|---|---|---|---|
Geometry |
Reference area |
6888.5 |
inch² |
Operating Condition |
Medium |
Air |
— |
Velocity magnitude |
Case dependent |
Mach |
|
Reference velocity magnitude |
Case dependent |
Mach |
|
Angle of attack |
2 |
° |
|
Solver |
Compressible |
— |
|
Flow solver |
Mode |
Steady |
— |
Max steps |
4000 |
— |
|
CFL type |
Adaptive CFL |
— |
|
Turbulence Model |
Model |
Spalart-Allmaras |
— |
Absolute tolerance |
1e-8 |
— |
|
Navier-Stokes Solver |
Absolute tolerance |
1e-10 |
— |
Kappa MUSCL |
-1 |
— |
Results and Validation#
This section presents the validation of the aerodynamic results for the rocket configuration against the reference data [1]. The analysis focuses on two primary nondimensional coefficients used in the original work: the axial force coefficient, \(C_A\), and the normal force coefficient, \(C_N\). These quantities provide a consistent basis for assessing the aerodynamic performance of the vehicle across the range of operating conditions considered. In addition to the integrated force coefficients, selected flow-field visualizations are included to illustrate the converged solutions and to support a qualitative discussion of the underlying flow physics.
To remain consistent with the reference methodology, the axial force coefficient is evaluated by replacing the base pressure with the freestream pressure, thereby excluding the contribution of the base surface from the total axial force. All reported forces are computed as averages over the final 10% of the pseudo steps in each simulation. This averaging procedure mitigates residual oscillations associated with convergence and ensures that the presented aerodynamic coefficients accurately reflect the converged flow solution.
Aerodynamic Coefficients#
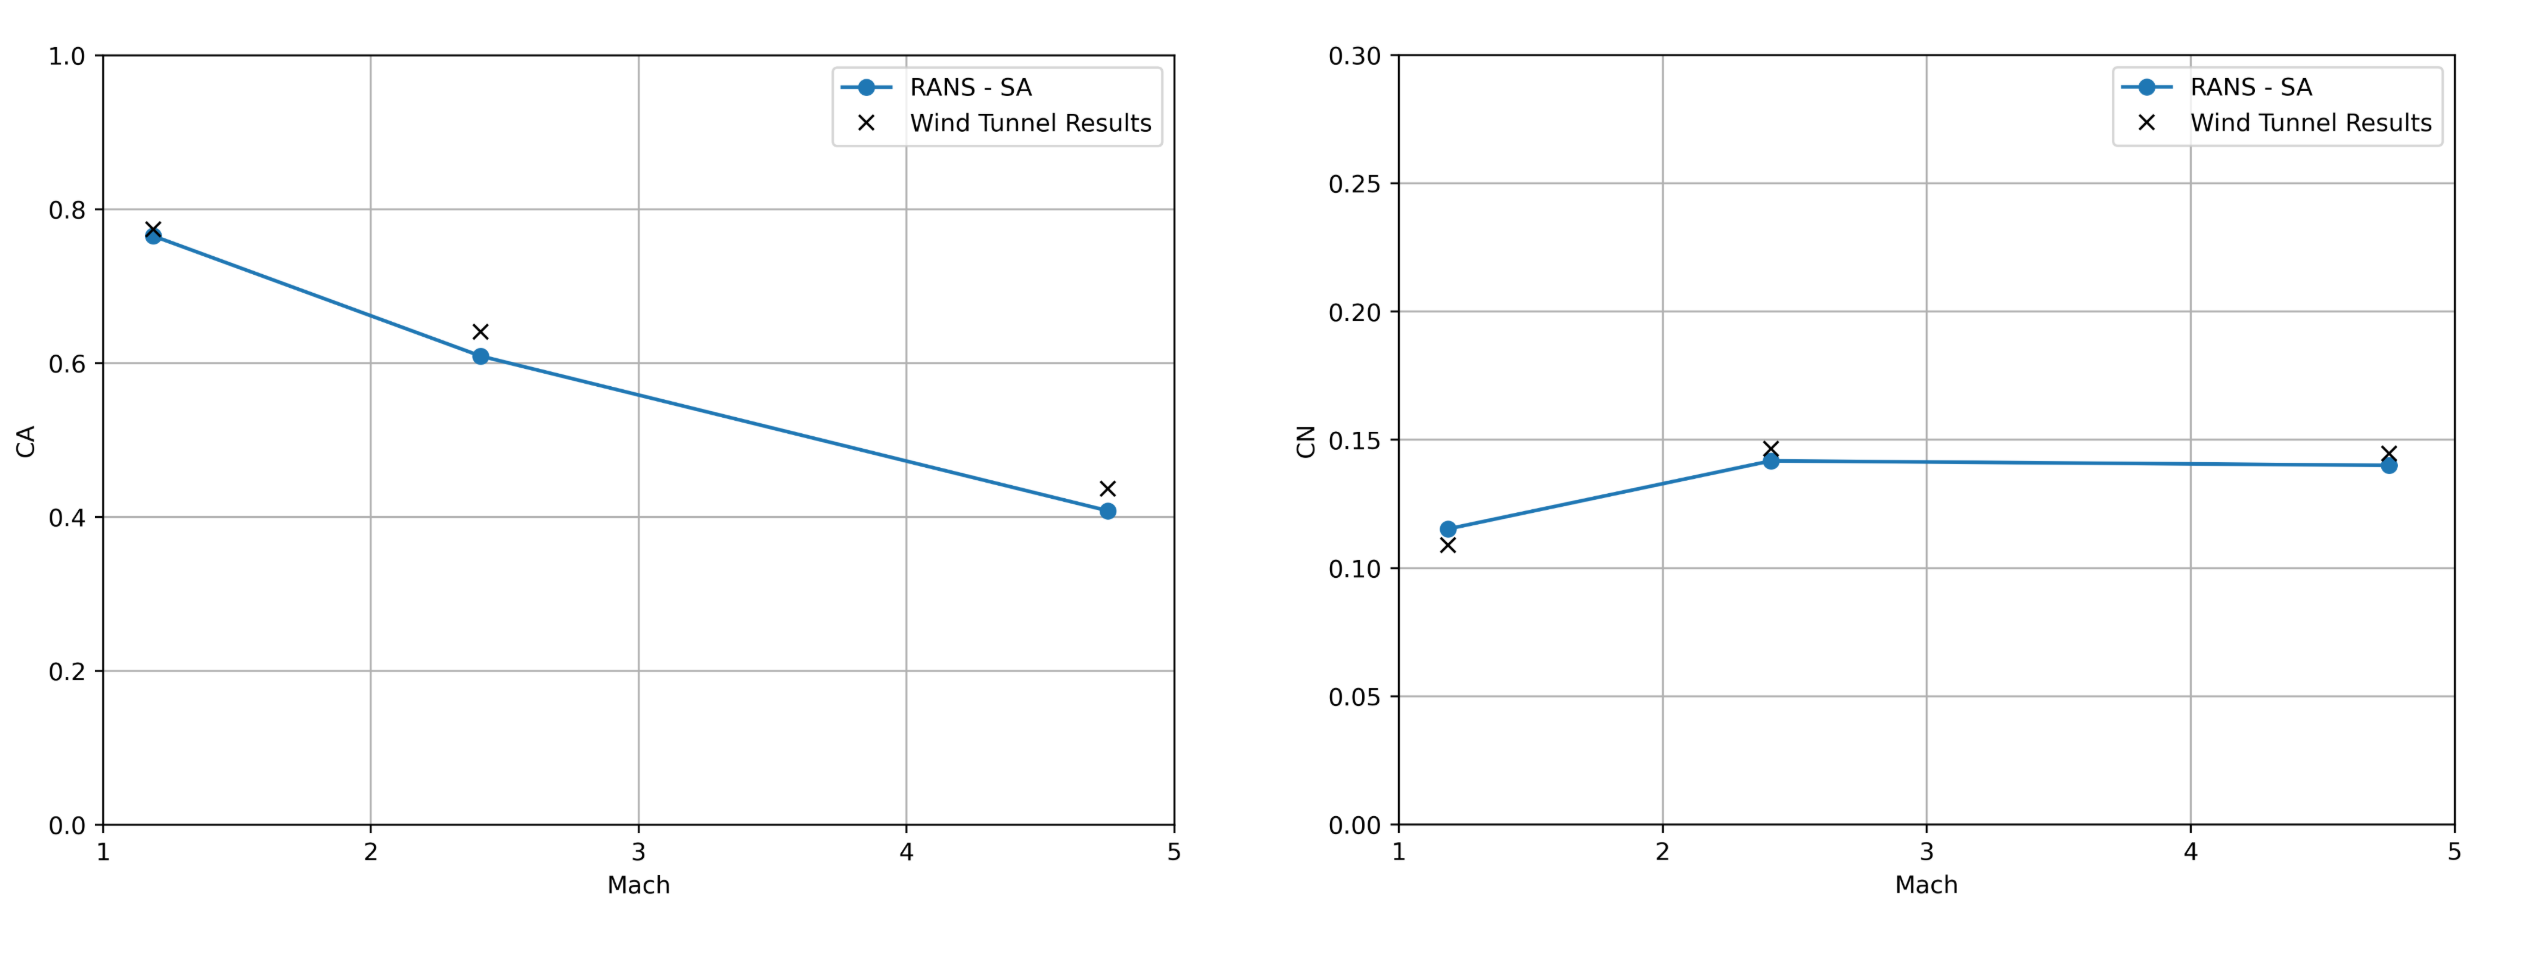
\(C_A\) and \(C_N\) as a function of \(Mach\).#
Flow360 shows good agreement with the experimental data across the full Mach number range.
The axial force coefficient, \(C_A\), shows good agreement with the experimental data for the two lower Mach number cases, with errors on the order of 1–6%. The present results fall within the error bounds documented in the literature for this configuration.
The normal force coefficient, \(C_N\), is predicted with a consistent level of accuracy across the Mach number range, with deviations from the experimental values remaining within approximately 3–6% for all three cases. This agreement is consistent with prior numerical results.
Test |
I |
II |
III |
|---|---|---|---|
Mach Number |
1.187 |
2.410 |
4.752 |
CA (%) |
-1.10 |
-4.96 |
-6.57 |
CN (%) |
5.74 |
-3.22 |
-3.15 |
Overall, the results demonstrate that the solver accurately captures the aerodynamic behavior of the configuration across the full Mach number range considered. Showcasing Flow360’s robustness in modeling supersonic phenomena with a relatively coarse mesh.
Flowfield Visualizations#
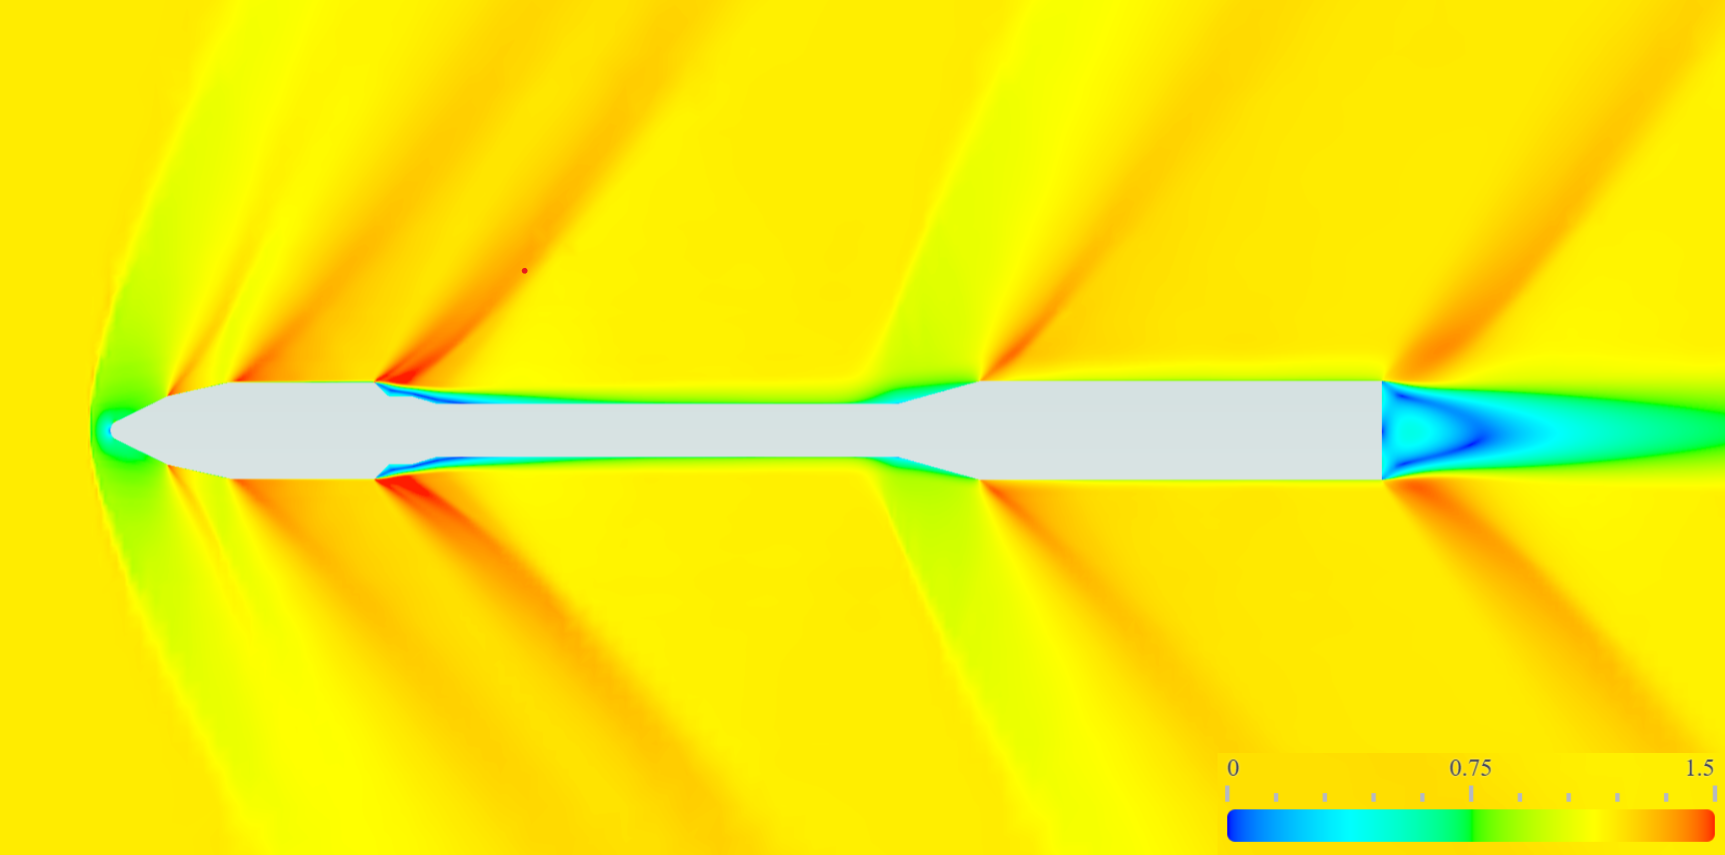
This section presents representative visualizations highlighting Flow360’s capability to model and visualize shock-wave structures.
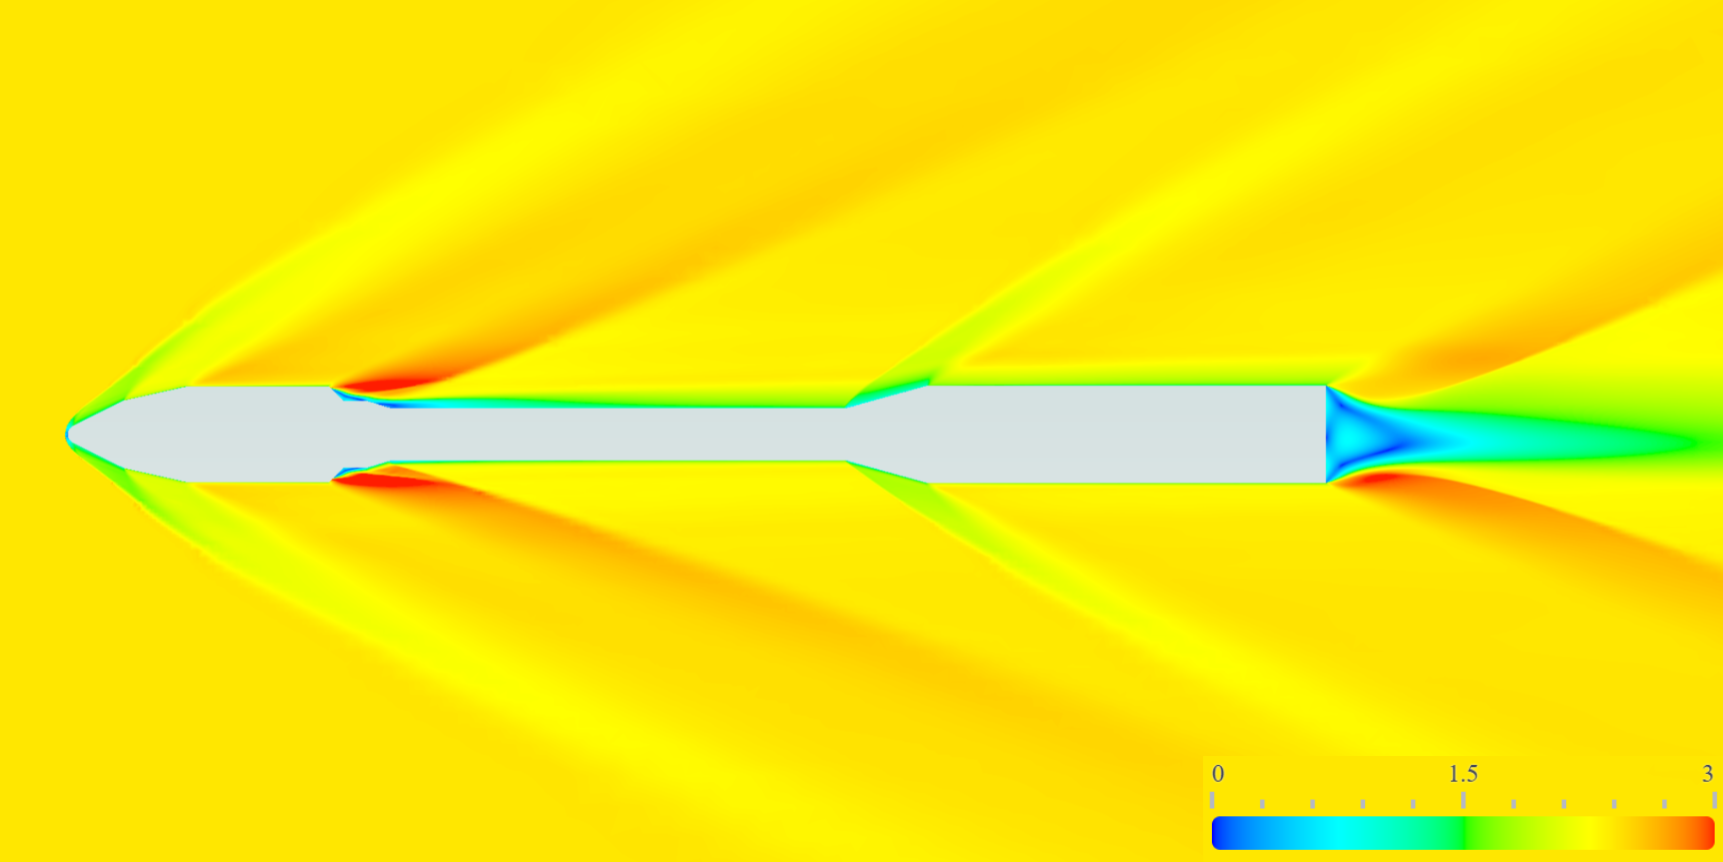
Freestream Mach 1.87, flow field colored by Mach number.#
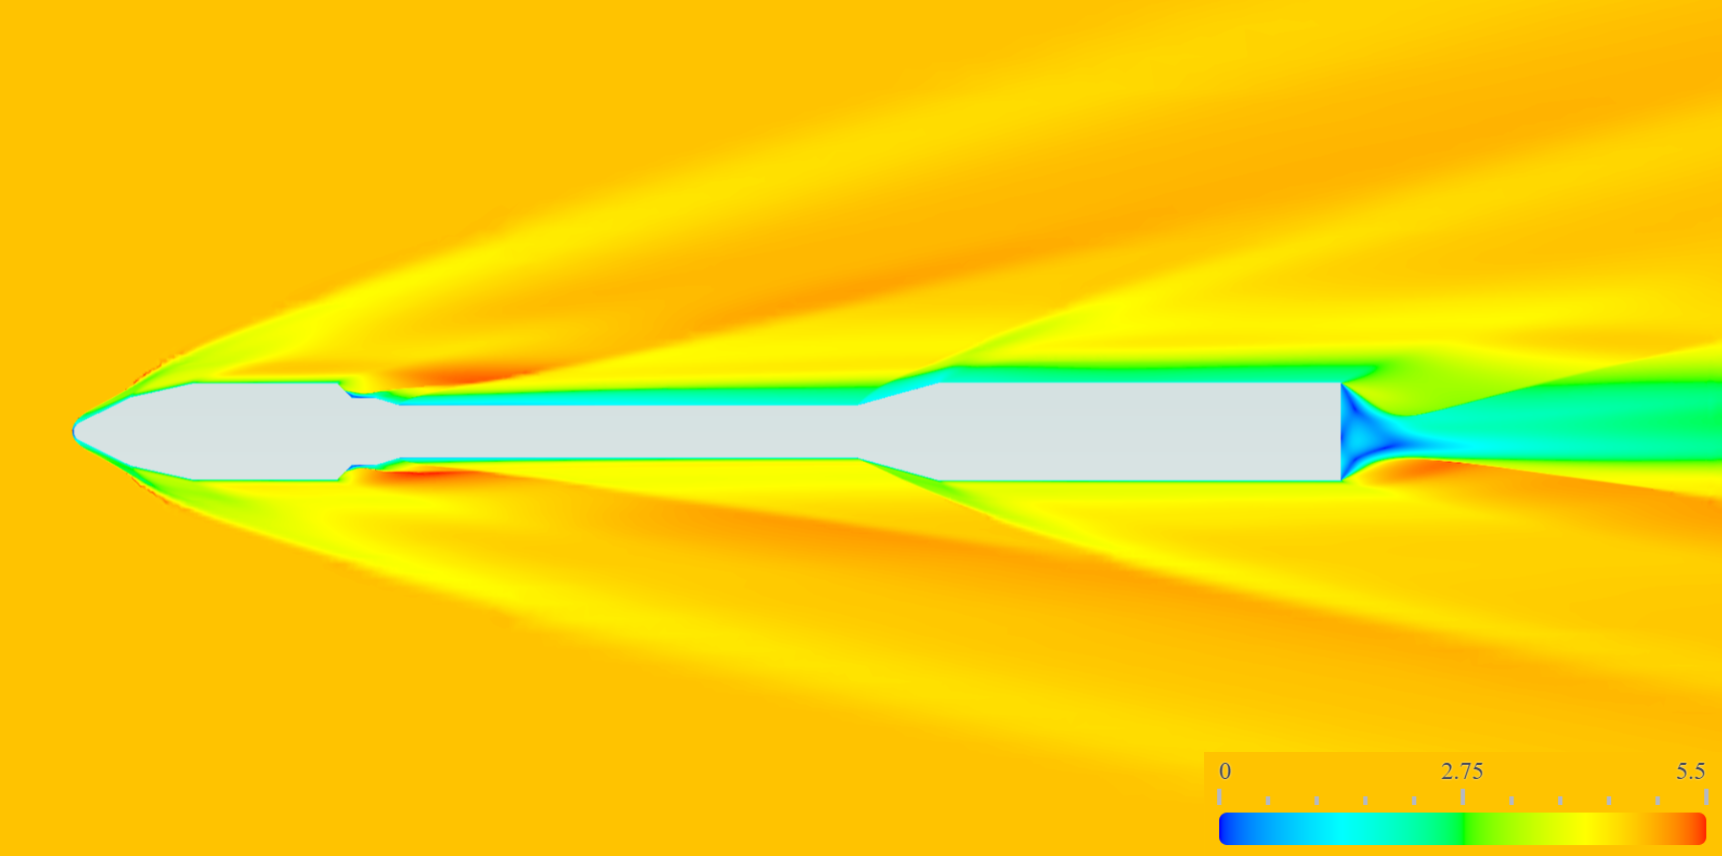
Freestream Mach 2.41, flow field colored by Mach number.#
Freestream Mach 4.752, flow field colored by Mach number.#
As the freestream Mach number increases, the shock system progressively transitions toward a flowfield dominated by the primary bow shock. The reduction in shock angle, coupled with the increase in shock strength, has a pronounced impact on both the downstream shock topology and the overall organization of the flowfield. These changes alter how flow features interact with the vehicle geometry, particularly in regions involving expansions, recompression, and separation.
To clarify the influence of Mach number on the global flow structure, the following sections examine the flow behavior in each major geometric region of the vehicle individually:
Nose Region
At the nose of the vehicle, increasing Mach number leads to a progressive reduction in the bow-shock angle relative to the freestream. As the shock becomes stronger and more aligned with the flow direction, the post-shock compression increasingly governs the downstream flowfield. This results in a more coherent shock structure downstream, with reduced sensitivity to local geometric perturbations.
Mid-Body Expansion and Recompression
In the mid-body region, the change in bow-shock strength alters the local Mach number entering the Prandtl–Meyer expansion. As Mach increases, the expansion fan narrows and the subsequent recompression shock shifts. These changes significantly modify the separation and reattachment locations, leading to marked differences in the local flow topology across Mach conditions.
Base Region and Wake
Near the base of the vehicle, the recompression shock strengthens with increasing Mach number. Leading to a progressive loss in axial symmetry, leading to a more complex and asymmetric three-dimensional flowfield.
Conclusion#
This validation study demonstrates Flow360’s capability to accurately simulate high-speed compressible flows over slender aerospace configurations, using the experimental rocket data set as a benchmark. The solver successfully captures the dominant aerodynamic characteristics observed in the experiments, including axial and normal force trends, as well as the associated shock structures and pressure distributions. Force coefficient predictions show good agreement with measurements, with errors remaining within 6% across all cases. The accurate reproduction of both global aerodynamic loads and key flow features highlights the solver’s robustness and reliability for high-Mach-number applications. These results confirm that Flow360 is well suited for high-fidelity modeling of rocket aerodynamics and other aerospace systems operating in strongly compressible flow regimes.