Mesh Statistics Panel#
The Mesh Statistics Panel provides detailed numerical information about the mesh, including element counts, node information, and boundary statistics. This panel is accessible directly from the viewer and provides a comprehensive overview of mesh characteristics.
Accessing the Mesh Statistics Panel#
The Mesh Statistics Panel is accessed by:
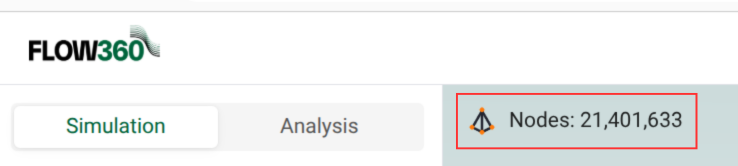
Clicking on the node count display in the viewer
The panel opens in the main content area, replacing the 3D viewer
The panel displays comprehensive mesh statistics organized into sections
Metrics Section#
The panel displays comprehensive mesh information organized under the “Metrics” heading:
Mesh Statistics#
Overall mesh information displayed in a structured list format:
Nodes: Total number of nodes in the mesh
Triangles: Number of triangular surface elements
Prisms: Number of prismatic volume elements
Quadrilaterals: Number of quadrilateral surface elements
Pyramids: Number of pyramid volume elements
Tetrahedrons: Number of tetrahedral volume elements
Hexahedrons: Number of hexahedral volume elements
Each statistic is displayed with its numerical value, providing a quick overview of mesh composition.
Boundary Section#
For surface meshes, the “Boundary” section shows:
Face list: Faces are listed in the format
volume_zone_name/surface_name(NUMBER)where:volume_zone_nameindicates the volume zone identifier (e.g.,fluid)surface_nameindicates the surface identifier (e.g.,body00001_face00001)(NUMBER)indicates the element count for that face.
Expandable entries: Each boundary face entry has a right-pointing triangle indicating it can be expanded to show detailed statistics tables
Boundary Statistics Table#
When you expand a boundary face entry, a detailed statistics table is displayed with the following columns:
Title: The name of the mesh quality metric (e.g.,
area,areaRatio,aspectRatio,firstLayerThickness)Arithmetic Mean: The average value of the metric across all elements in the boundary face
Max: The maximum value observed for the metric
Max Element Types: The type(s) of mesh elements associated with the maximum value (e.g.,
Triangle,Node)Max Location: The 3D coordinates (X, Y, Z) where the maximum value occurs, with a copy icon to copy coordinates
min: The minimum value observed for the metric
Min Element Types: The type(s) of mesh elements associated with the minimum value
Min Location: The 3D coordinates (X, Y, Z) where the minimum value occurs, with a copy icon to copy coordinates
Volumetric Section#
For volume meshes, the “Volumetric” section shows:
Zone list: Zones are listed in the format
zone_name (ELEMENT_COUNT)(e.g.,fluid (25,092,608))Expandable zones: Each volume zone entry has a right-pointing triangle indicating it can be expanded to show detailed statistics tables
Volumetric Statistics Table#
When you expand a volume zone entry, a detailed statistics table is displayed with the following columns:
Title: The name of the mesh quality metric (e.g.,
aspectRatio,volume)Arithmetic Mean: The average value of the metric across all elements in the volume zone
Max: The maximum value observed for the metric
Max Element Types: The type(s) of mesh elements associated with the maximum value (e.g.,
Prism,Tetrahedron)Max Location: The 3D coordinates (X, Y, Z) where the maximum value occurs, with a copy icon to copy coordinates
min: The minimum value observed for the metric
Min Element Types: The type(s) of mesh elements associated with the minimum value
Min Location: The 3D coordinates (X, Y, Z) where the minimum value occurs, with a copy icon to copy coordinates
Visualization Section#
The panel also includes a “Visualization” section that shows mesh screenshots.