MMI Optimization with Tidy3D Design Plugin
In this notebook, we present a comprehensive workflow for optimizing photonic components within PhotonForge, combining global design-space exploration with local gradient-based refinement. We will specifically focus on designing and optimizing a multimode interference (MMI) splitter component.
The design space is first explored with the Tidy3D Design Plugin (tidy3d.plugins.design), through a structured parameter sweep followed by Bayesian optimization. The best design found in this stage is then refined with a few steps of gradient ascent, using the native automatic differentiation support introduced in PhotonForge 1.4.4, which computes exact gradients of the S matrix through Tidy3D’s adjoint solver at the cost of
one forward and one adjoint simulation per step (see the Inverse Design with Autograd guide). The two methods complement each other: surrogate-based exploration is well suited to scanning the design space globally, while adjoint gradients converge quickly and precisely in the neighborhood of the optimum.

The workflow covers:
Initializing the Process Design Kit (PDK)
Designing the photonic component
Setting up simulations
Conducting parameter sweeps and Bayesian optimization
Refining the best design with gradients computed by automatic differentiation
Evaluating optimization results
Initialize the Process Design Kit (PDK)
We begin by initializing a standard technology stack for the Silicon-on-Insulator (SOI) platform. PhotonForge supports several additional PDKs, including two open-source options: SiEPIC OpenEBL and Luxtelligence LNOI400.
In this notebook, we use the SiEPIC OpenEBL technology, which provides predefined settings for materials, layer thicknesses, and other critical photonic parameters.
[1]:
# The Bayesian optimizer uses the bayesian-optimization external package.
# Uncomment the following line to install the package
# !pip install bayesian-optimization

import autograd as ag
import autograd.numpy as anp  # Use autograd's numpy for the differentiated objective
import matplotlib.pyplot as plt
import numpy as np
import photonforge as pf
import siepic_forge as siepic_pdk
import tidy3d as td
import tidy3d.plugins.design as tdd
from photonforge.live_viewer import LiveViewer
from rich.pretty import Pretty

viewer = LiveViewer()
07:28:34 -03 WARNING: The material-library variant 'Palik_Lossless' is
             deprecated and maps to 'Palik_LowLoss' because it contains a tiny
             fitted loss despite its name. Use 'Palik_NoLoss' where available
             for a zero-loss Palik model.
LiveViewer started at http://localhost:38545
Note that the technology stacks in PhotonForge are parametric objects, meaning parameters such as layer thicknesses, material media, sidewall angles, and more can easily be modified according to design requirements. In this notebook, we include the air above the cladding since the cladding is really thin.
Below is the technology setting and the list of the technology layers. For our design, we’ll specifically utilize the “Si” and “Si slab” layers to create a rib-waveguide-based MMI splitter.
We use a default_mesh_refinement of 12 to decrease simulation time. It is still sufficiently accurate for optimization purpose. We will simulate the final optimal design with the default mesh refinement of 20.
[2]:
tech = siepic_pdk.ebeam()

# some configuration settings
pf.config.default_technology = tech
pf.config.default_mesh_refinement = 12
# We raise the Tidy3D logging level to reduce output noise during the
# optimization loop. Warnings can flag real problems, so only suppress them
# once you have confirmed they are not relevant to your case.
td.config.logging.level = "ERROR"

# set wavelength of interest (c-band)
wavelengths = np.linspace(1.53, 1.565, 51)
frequencies = pf.C_0 / wavelengths
[3]:
Pretty(tech.parametric_kwargs, max_depth=1)
[3]:
{
    'si_thickness': 0.22,
    'si_slab_thickness': 0.09,
    'si_mask_dilation': 0.0,
    'si_slab_mask_dilation': 0.0,
    'sidewall_angle': 0.0,
    'heater_thickness': 0.2,
    'router_thickness': 0.6,
    'bottom_oxide_thickness': 2.0,
    'top_oxide_thickness': 2.2,
    'passivation_oxide_thickness': 0.3,
    'sio2': {...},
    'si': {...},
    'router_metal': {...},
    'heater_metal': {...},
    'opening': Medium(...)
}
Creating a 1x2 MMI Component
Next, we’ll create a parametric 1x2 MMI component using PhotonForge. We’ll use the stencils.mmi method to generate the basic geometry and add this to the core waveguide layer (“Si”).
To form the rib waveguide structure, we apply the envelope function around the core geometry with an offset defined by the parameter padding. This envelope is then added to the “Si slab” layer.
Afterward, ports of type Rib_TE_1550_500 are automatically identified and assigned using the detect_ports method. Lastly, we incorporate the Tidy3DModel for simulation purposes.
[4]:
@pf.parametric_component
def mmi_1x2(
    *,
    length=12,
    width=5,
    port_length=6,
    tapered_width=1.5,
    padding=3,
    port_separation=None,
    port_spec=tech.ports["Rib_TE_1550_500"]
):
    """
    Creates a parametric 1x2 multimode interference (MMI) splitter component.

    Parameters:
        length (float): Length of the central MMI region (μm).
        width (float): Width of the central MMI region (μm).
        port_length (float): Length of input/output waveguide ports (μm).
        tapered_width (float): Width at the tapered junction between ports and MMI region (μm).
        padding (float): Padding offset around the core layer to form slab waveguide (μm).
        port_separation (float): Distance between the output port centers (μm).
            If ``None``, half of the MMI width is used.
        port_spec (photonforge.PortSpec): Port specifications for this component

    Returns:
        PhotonForge Component: Configured MMI splitter with ports and simulation model.
    """
    if isinstance(port_spec, str):
        port_spec = pf.config.default_technology.ports[port_spec]

    # Create an empty component named "MMI1x2"
    mmi = pf.Component("MMI1x2")

    port_width, _ = port_spec.path_profile_for("Si")

    # Generate the base geometry for the MMI splitter
    mmi_structure = pf.stencil.mmi(
        length=length,
        num_ports=(1, 2),
        width=width,
        port_length=port_length,
        port_width=port_width,
        tapered_width=tapered_width,
        port_separation=port_separation,
    )

    # Add the geometry to the "Si" layer
    mmi.add("Si", *mmi_structure)

    # Create slab structure surrounding the core geometry
    slab_structures = pf.envelope(mmi, offset=padding, trim_x_min=True, trim_x_max=True)

    # Add slab structure to "Si slab" layer
    mmi.add("Si Slab", slab_structures)

    # Detect and add ports automatically
    mmi.add_port(mmi.detect_ports([port_spec]))
    assert len(mmi.ports) == 3, "Port detection failed: expected exactly 3 ports."

    # Include the Tidy3D simulation model
    mmi.add_model(
        pf.Tidy3DModel(verbose=False, port_symmetries=[("P0", "P2", "P1")]),
        "Tidy3DModel",
    )

    return mmi


# Instantiate the component with custom dimensions
mmi = mmi_1x2(length=15, width=5, port_length=6)
viewer.display(mmi)
[4]:

Defining the Figure of Merit (FoM) for MMI Optimization
Next, we define a function to create the MMI splitter component and calculate its figure of merit (FoM). Given that the 1x2 MMI splitter is symmetric, we expect equal transmitted power at both output ports. Therefore, our figure of merit is defined as the average transmitted power at the two output ports across the specified frequency range.
The following function constructs the MMI component, simulates it to obtain the scattering parameters (S-parameters), and calculates the average transmitted power as our optimization metric:
[5]:
def fom_mmi(
    frequencies=frequencies,
    length=12,
    width=5,
    port_length=6,
    tapered_width=1.5,
    padding=3,
    port_spec=tech.ports["Rib_TE_1550_500"],
):
    # create mmi component
    mmi = mmi_1x2(
        length=length,
        width=width,
        port_length=port_length,
        tapered_width=tapered_width,
        padding=padding,
        port_spec=port_spec,
    )

    # Get the S-matrix object from the MMI component
    s_matrix = mmi.s_matrix(frequencies=frequencies, model_kwargs={"inputs": ["P0"]})

    # Keys: ('P0@0', 'P1@0') is S21, ('P0@0', 'P2@0') is S31.
    # Because of symmetry we only need S21
    S21 = s_matrix["P0@0", "P1@0"]

    # Compute power (|S|^2) for the transmission coefficients over all frequencies
    P21 = np.abs(S21) ** 2

    # Average transmitted power (which is the complement of loss)
    avg_transmitted_power = 2 * np.mean(P21)

    fom_value = avg_transmitted_power
    return fom_value
Defining Design Parameters
First, we define the key design parameters that serve as inputs to our previously defined fom_mmi function.
In this example, we focus on four critical parameters: length, width, tapered_width, and port_length. Each parameter is defined as a named tdd.ParameterFloat, with clearly specified spans. The parameter names must match exactly with the argument names of the fom_mmi function.
Since we intend to perform parameter sweeps specifically on port_length and tapered_width, we include the num_points parameter to determine the resolution of these sweeps. Note that the num_points attribute is only relevant for parameter sweeps and will be ignored during Bayesian optimization.
[6]:
param_length = tdd.ParameterFloat(name="length", span=(10, 20))
param_width = tdd.ParameterFloat(name="width", span=(4, 6))
param_tapered_width = tdd.ParameterFloat(
    name="tapered_width", span=(1, 2), num_points=3
)
param_port_length = tdd.ParameterFloat(name="port_length", span=(5, 9), num_points=5)
Defining and Running the Parameter Sweep
Next, we set up and execute a parameter sweep using the Tidy3D Design plugin. We select the MethodGrid() method, which performs a structured grid sweep over the specified parameters.
We then create a DesignSpace, specifying the parameters (param_port_length and param_tapered_width) defined earlier, along with the chosen method (method). The path_dir argument indicates where the simulation data will be stored.
Finally, we execute the parameter sweep by calling the run() method of the DesignSpace object, passing the previously defined figure-of-merit function fom_mmi.
[7]:
method = tdd.MethodGrid()
design_space = tdd.DesignSpace(
    parameters=[param_port_length, param_tapered_width],
    method=method,
    path_dir="./data",
)
sweep_results = design_space.run(fom_mmi)
Progress: 100%
Progress: 100%
Progress: 100%
Progress: 100%
Progress: 100%
Progress: 100%
Progress: 100%
Progress: 100%
Progress: 100%
Progress: 100%
Progress: 100%
Progress: 100%
Progress: 100%
Progress: 100%
Progress: 100%
We convert the sweep results into a DataFrame for easy visualization. Below are the first five data points from our parameter sweep:
[8]:
# The first 5 data points
df = sweep_results.to_dataframe()
df.head()
[8]:
| port_length | tapered_width | output | |
|---|---|---|---|
| 0 | 5.0 | 1.0 | 0.122565 |
| 1 | 6.0 | 1.0 | 0.116985 |
| 2 | 7.0 | 1.0 | 0.119837 |
| 3 | 8.0 | 1.0 | 0.114557 |
| 4 | 9.0 | 1.0 | 0.117331 |
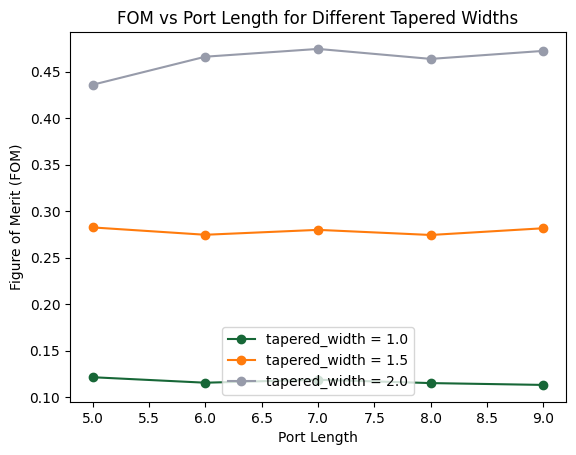
We visualize the sweep results by plotting the Figure of Merit (FoM) against port_length for different values of tapered_width. Each curve corresponds to a unique tapered_width, clearly showing how this parameter influences the overall performance of the MMI splitter.
[9]:
# Create a figure and axis
fig, ax = plt.subplots()

# Loop over the unique tapered_width values and plot each curve
for tw in sorted(df["tapered_width"].unique()):
    # Filter the DataFrame for the current tapered_width value
    df_subset = df[df["tapered_width"] == tw]
    # Sort by port_length for a smoother curve
    df_subset = df_subset.sort_values(by="port_length")

    ax.plot(
        df_subset["port_length"],
        df_subset["output"],
        marker="o",
        label=f"tapered_width = {tw}",
    )

# Set labels and title
ax.set_xlabel("Port Length")
ax.set_ylabel("Figure of Merit (FOM)")
ax.set_title("FOM vs Port Length for Different Tapered Widths")
ax.legend()

# Show the plot
plt.show()
Performing Bayesian Optimization
Next, we perform Bayesian optimization to efficiently explore the design space and identify optimal parameters. We select the MethodBayOpt method, specifying:
initial_iter=4: Number of initial random iterations to explore the design space broadly. This provides a starting point for the Gaussian processor to optimize from.n_iter=6: Number of additional iterations guided by the Gaussian processor to refine the parameter search.seed=1: Set the random number generator seed for a reproducible result.
We create a new DesignSpace, including the parameters param_length, param_width, and param_tapered_width. We then execute the optimization process by running our defined figure-of-merit function (fom_mmi):
[10]:
method = tdd.MethodBayOpt(initial_iter=4, n_iter=6, seed=1)
design_space = tdd.DesignSpace(
    parameters=[param_length, param_width, param_tapered_width],
    method=method,
    path_dir="./data",
)
optimization_result = design_space.run(fom_mmi, verbose=True)
Progress: 100%
Progress: 100%
Progress: 100%
| 1         | 0.0858630 | 14.170220 | 5.4406489 | 1.0001143 |
| 2         | 0.4635762 | 13.023325 | 4.2935117 | 1.0923385 |
| 3         | 0.3194536 | 11.862602 | 4.6911214 | 1.3967674 |
| 4         | 0.5918545 | 15.388167 | 4.8383890 | 1.6852195 |
07:34:49 -03 Best Fit from Initial Solutions: 0.592
Progress: 100%
Progress: 100%
| 5         | 0.9724368 | 15.586898 | 4.3100215 | 1.9060965 |
07:35:04 -03 Latest Best Fit on Iter 0: 0.972
Progress: 100%
| 6         | 0.9369612 | 15.996979 | 4.1754984 | 2.0       |
Progress: 100%
| 7         | 0.8426485 | 15.879661 | 4.0       | 1.0530679 |
Progress: 100%
| 8         | 0.5136068 | 17.867181 | 4.0       | 1.0       |
Progress: 100%
| 9         | 0.9243946 | 14.891869 | 4.0       | 2.0       |
Progress: 100%
| 10        | 0.3873512 | 20.0      | 6.0       | 2.0       |
07:36:27 -03 Best Result: 0.9724368717792838
             Best Parameters: length: 15.586898284457517 width:
             4.3100215963887285 tapered_width: 1.9060965093990814
Retrieving Optimal Design Parameters
We extract the optimal parameters obtained from the Bayesian optimization. The best parameters are those that maximize our figure of merit (fitness). We print both the best fitness value and the corresponding optimized parameters:
[11]:
best_params = optimization_result.optimizer.max["params"]
print(f"Best fitness: {optimization_result.optimizer.max['target']}")
print(f"Best parameters: {optimization_result.optimizer.max['params']}")
Best fitness: 0.9724368717792838
Best parameters: {'length': np.float64(15.586898284457517), 'width': np.float64(4.3100215963887285), 'tapered_width': np.float64(1.9060965093990814)}
Local Refinement with Autograd
Bayesian optimization is excellent at exploring the design space globally, but its surrogate model converges slowly in the immediate neighborhood of the optimum. Since version 1.4.4, PhotonForge can compute exact gradients of the S matrix with respect to the component parameters through Tidy3D’s adjoint solver (see the Inverse Design with Autograd guide), so a few steps of gradient ascent are a cheap way to polish the best design: each gradient evaluation costs one forward and one adjoint simulation, independently of the number of parameters.
Gradients are computed for the structures inside the simulation, so the port positions must not depend on the optimized parameters. We wrap our parametric MMI in a fixed-footprint version: the access waveguide length absorbs changes in the MMI length, and the output separation is pinned to the value of the best design instead of following the MMI width.
[12]:
# Footprint of the best design found by the Bayesian optimization
total_span = best_params["length"] + 2 * 6.0
port_separation = best_params["width"] / 2


@pf.parametric_component
def mmi_1x2_fixed(*, length, width, tapered_width):
    return mmi_1x2(
        length=length,
        width=width,
        tapered_width=tapered_width,
        port_length=0.5 * (total_span - length),
        port_separation=port_separation,
    )
For the refinement objective we use the transmitted power at the central frequency only: the MMI response is smooth over this band, single-frequency gradients require a single adjoint simulation, and the result files stay small because only one frequency of volumetric field data is involved. The full band is verified afterwards.
The parameters are mapped by name and clipped to the same spans used in the exploration stage after each iteration of the Adam algorithm. Near convergence, the objective fluctuates by a small amount due to re-meshing noise from sub-grid geometry changes, so a few iterations are all that is needed.
[13]:
freq0 = pf.C_0 / wavelengths[len(wavelengths) // 2]
refine_names = ["length", "width", "tapered_width"]


def objective(params):
    kwargs = dict(zip(refine_names, params))
    mmi = mmi_1x2_fixed(**kwargs)
    s_matrix = mmi.s_matrix(
        [freq0], show_progress=False, model_kwargs={"inputs": ["P0"]}
    )
    # Transmitted power into both outputs (the symmetric output doubles S21)
    return 2 * anp.abs(s_matrix["P0@0", "P1@0"][0]) ** 2


refine_params = [param_length, param_width, param_tapered_width]
bounds = (
    anp.array([p.span[0] for p in refine_params]),
    anp.array([p.span[1] for p in refine_params]),
)
learning_rate = 0.1

value_and_grad = ag.value_and_grad(objective)
params = anp.array([best_params[name] for name in refine_names])
m = anp.zeros_like(params)
v = anp.zeros_like(params)
history = []

for i in range(1, 7):
    value, gradient = value_and_grad(params)
    history.append((params, value))
    print(f"Iteration {i}: transmitted power = {value:.4f} at {anp.round(params, 3)}")
    # Adam update (gradient ascent)
    m = 0.9 * m + 0.1 * gradient
    v = 0.999 * v + 0.001 * gradient**2
    step = (m / (1 - 0.9**i)) / (anp.sqrt(v / (1 - 0.999**i)) + 1e-8)
    params = anp.clip(params + learning_rate * step, *bounds)

best_refined, best_value = max(history, key=lambda h: h[1])
refined_params = dict(zip(refine_names, best_refined))
print(f"Best: {best_value:.4f} at {refined_params}")
Iteration 1: transmitted power = 0.9731 at [15.587  4.31   1.906]
Iteration 2: transmitted power = 0.9786 at [15.687  4.21   1.806]
Iteration 3: transmitted power = 0.9849 at [15.787  4.205  1.706]
Iteration 4: transmitted power = 0.9887 at [15.887  4.236  1.606]
Iteration 5: transmitted power = 0.9886 at [15.987  4.252  1.506]
Iteration 6: transmitted power = 0.9905 at [16.087  4.225  1.408]
Best: 0.9905 at {'length': np.float64(16.087125449989948), 'width': np.float64(4.225466566566536), 'tapered_width': np.float64(1.4079190420729244)}
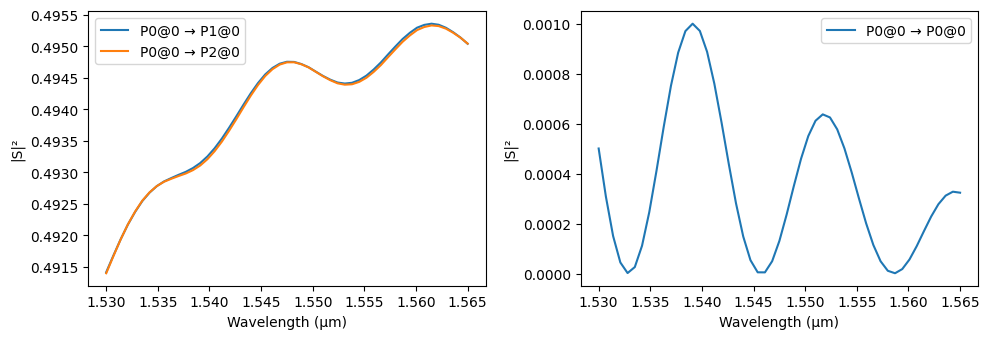
Using the refined parameters obtained from the gradient-based stage, we construct the optimized MMI splitter component. Then, we compute its scattering matrix (S-matrix) across the specified frequency range and visualize the transmission results as a function of wavelength. We perform final simulation with the default mesh refinement value of 20, to make sure that the results are accurate. The loss of the device is less than 0.075 dB over the whole bandwidth, which is impressive.
[14]:
pf.config.default_mesh_refinement = 20
mmi = mmi_1x2_fixed(**refined_params)

# Get the S-matrix object from the optimized MMI component and plot the results
s_matrix = mmi.s_matrix(frequencies=frequencies, model_kwargs={"inputs": ["P0"]})
ax = pf.plot_s_matrix(s_matrix, x="wavelength")
Progress: 100%