Introduction on Tidy3D working principles#
This notebook will walk through the basic working principles of the Tidy3D front end, including setting up and post processing simulation results.
Note that this content serves as a reference for the details of operating the front end, but a lot of content is covered indirectly in the other example notebooks.
[1]:
# First, let's import the main packages we'll need
import matplotlib.pylab as plt
import numpy as np
import tidy3d as td
15:07:18 CET WARNING: Using canonical configuration directory at
             '/home/marco/.config/tidy3d'. Found legacy directory at
             '~/.tidy3d', which will be ignored. Remove it manually or run
             'tidy3d config migrate --delete-legacy' to clean up.
Basics#
A Tidy3D simulation is essentially a python class that combines many Tidy3D “components”, which store the specification for how we will run the simulation on our servers.
Here we will discuss some of the basics that apply to all of these components.
Topics covered will include:
Defining Tidy3D components.
Saving and loading from file.
Getting help / debugging.
logging.
Background#
All Tidy3d components are defined using the pydantic package. This means that each tidy3d object corresponds to a data structure that has rigidly defined allowable types and values, which get validated automatically whenever you initialize an object.
This has several advantages, including.
Catching bugs in the tidy3d components as early as possible.
Automatically generated schema for tidy3d simulation specifications.
Simple and reliable IO, including exporting to various formats such as dictionaries or json.
Defining Tidy3d Components#
It also requires a bit more work on the user side to define these components, for example
All tidy3d components must use keyword arguments in their definitions, eg.
Medium(2.0)becomesMedium(permittivity=2.0)to be explicit.Components are immutable to avoid complications from not validating changes on components. This means modifying a component requires calling
new_obj = old_obj.updated_copy(val=new_val, ...).
However, these decisions were made to make the overall use of Tidy3D more explicit and ensure that components are safely validated at all times, which pays off in the long run.
Here’s one example of what would happen if a user tried to pass fields (in this case, the relative permittivity of a medium) without using keyword arguments), followed by the correct way. We see that the positional argument construction fails. This is good practice in general to avoid bugs, but pydantic and Tidy3D require it.
[2]:
# wrong way
try:
    td.Medium(2.0)
except Exception as e:
    td.log.info(e)

# correct way
m = td.Medium(permittivity=2.0)
Saving and Loading Tidy3d Components#
All tidy3d components can be saved to file as json or yaml format using the instance.to_file(path) and class.from_file(path) methods.
For example, let’s save and load a td.Box instance.
[3]:
my_box = td.Box(center=(1, 2, 3), size=(2, 2, 3))

my_box.to_file("data/box.json")

# note, `from_file` is a @classmethod so it can be called from `td.Box` or `my_box`.
your_box = td.Box.from_file("data/box.json")

print(my_box)
print(your_box)
print(my_box == your_box)
attrs={} type='Box' center=(1.0, 2.0, 3.0) size=(2.0, 2.0, 3.0)
attrs={} type='Box' center=(1.0, 2.0, 3.0) size=(2.0, 2.0, 3.0)
True
Similarly, the component can be converted to a dict or str in json format. Many other options exist and the pydantic documentation is a good place to see what else is supported.
[4]:
print(my_box.json())
print(my_box.dict())
{"attrs": {}, "type": "Box", "center": [1.0, 2.0, 3.0], "size": [2.0, 2.0, 3.0]}
{'attrs': {}, 'type': 'Box', 'center': (1.0, 2.0, 3.0), 'size': (2.0, 2.0, 3.0)}
Getting Help#
Sometimes you might want to get some information about a component without needing to look at the documentation. For this, each tidy3d component has a .help() method that will print out information about the stored data inside of the component.
Here’s an example.
[5]:
monitor = td.FieldMonitor(size=(2, 2, 0), freqs=[200e12], name="monitor")

monitor.help()
╭──────────────────────────── <class 'tidy3d.components.monitor.FieldMonitor'> ────────────────────────────╮
│ :class:`Monitor` that records electromagnetic fields in the frequency domain.                            │
│                                                                                                          │
│ ╭──────────────────────────────────────────────────────────────────────────────────────────────────────╮ │
│ │ FieldMonitor(                                                                                        │ │
│ │ │   attrs={},                                                                                        │ │
│ │ │   type='FieldMonitor',                                                                             │ │
│ │ │   center=(0.0, 0.0, 0.0),                                                                          │ │
│ │ │   size=(2.0, 2.0, 0.0),                                                                            │ │
│ │ │   name='monitor',                                                                                  │ │
│ │ │   interval_space=(1, 1, 1),                                                                        │ │
│ │ │   colocate=True,                                                                                   │ │
│ │ │   freqs=(200000000000000.0,),                                                                      │ │
│ │ │   apodization=ApodizationSpec(                                                                     │ │
│ │ │   │   attrs={},                                                                                    │ │
│ │ │   │   start=None,                                                                                  │ │
│ │ │   │   end=None,                                                                                    │ │
│ │ │   │   width=None,                                                                                  │ │
│ │ │   │   type='ApodizationSpec'                                                                       │ │
│ │ │   ),                                                                                               │ │
│ │ │   fields=('Ex', 'Ey', 'Ez', 'Hx', 'Hy', 'Hz')                                                      │ │
│ │ )                                                                                                    │ │
│ ╰──────────────────────────────────────────────────────────────────────────────────────────────────────╯ │
│                                                                                                          │
│     apodization = ApodizationSpec(attrs={}, start=None, end=None, width=None, type='ApodizationSpec')    │
│           attrs = {}                                                                                     │
│    bounding_box = Box(attrs={}, type='Box', center=(0.0, 0.0, 0.0), size=(2.0, 2.0, 0.0))                │
│          bounds = ((-1.0, -1.0, 0.0), (1.0, 1.0, 0.0))                                                   │
│          center = (0.0, 0.0, 0.0)                                                                        │
│        colocate = True                                                                                   │
│          fields = ('Ex', 'Ey', 'Ez', 'Hx', 'Hy', 'Hz')                                                   │
│           freqs = (200000000000000.0,)                                                                   │
│ frequency_range = (200000000000000.0, 200000000000000.0)                                                 │
│        geometry = Box(attrs={}, type='Box', center=(0.0, 0.0, 0.0), size=(2.0, 2.0, 0.0))                │
│  interval_space = (1, 1, 1)                                                                              │
│            name = 'monitor'                                                                              │
│     plot_params = PlotParams(                                                                            │
│                       attrs={},                                                                          │
│                       alpha=0.4,                                                                         │
│                       zorder=None,                                                                       │
│                       type='PlotParams',                                                                 │
│                       edgecolor='orange',                                                                │
│                       facecolor='orange',                                                                │
│                       fill=True,                                                                         │
│                       hatch=None,                                                                        │
│                       linewidth=3.0                                                                      │
│                   )                                                                                      │
│            size = (2.0, 2.0, 0.0)                                                                        │
│            type = 'FieldMonitor'                                                                         │
│       zero_dims = [2]                                                                                    │
╰──────────────────────────────────────────────────────────────────────────────────────────────────────────╯
Alternatively, one can use the standard help(cls) syntax to get a look at the docstring of a component.
[6]:
# help(td.FieldMonitor) # commented out for brevity
Logging#
Tidy3D logs information based on the following levels ranked from least to most critical.
"DEBUG"
"INFO"
"WARNING"
"ERROR"
"CRITICAL"
The “logging level” controls what types of messages get shown. The default logging level is "WARNING", which means logging messages of “warning” or more critical (“error”, “critical”) will be shown, whereas “info” and “debug” messages will not. The “info” and “debug” messages are sometimes useful for the user, but are mainly for debugging purposes.
The user can change this logging level through modifying the tidy3d.config.logging.level value, for example
tidy3d.config.logging.level = "INFO"
will make it so that “info” messages are shown in addition to the “warning”, “error”, and “critical” messages.
Core Components#
Here we will discuss the core components of the package (sources, monitors, etc) and how they are defined.
Topics covered will include:
Mediums.
Geometries.
Structures.
Sources.
Monitors.
Modes.
PML / Absorbing boundaries.
Simulations.
Mediums#
Mediums define the optical properties of the materials within the simulation.
PEC#
The simplest medium is td.PEC, which just signifies a perfect electrical conductor (no E field allowed within).
[7]:
pec_medium = td.PEC
Non-dispersive mediums#
Non-dispersive mediums are defined using the Medium object and can be specified by either permittivity and conductivity (optional) values, or from n, k refractive index values.
[8]:
lossless_dielectric = td.Medium(permittivity=4.0)
lossy_dielectric = td.Medium(permittivity=4.0, conductivity=1.0)
lossy_dielectric_from_nk = td.Medium.from_nk(n=2.0, k=0.1, freq=150e12)
Anisotropic mediums#
Tidy3d supports fully anisotropic mediums, but in this example, we will show how to model diagonally anisotropic mediums. See this tutorial for the complete guide.
Diagonally anisotropic mediums can be simply defined by specifying three Medium objects for the xx, yy, zz components of the permittivity / conductivity tensor.
[9]:
anisotropic_medium = td.AnisotropicMedium(
    xx=lossless_dielectric, yy=lossy_dielectric, zz=lossy_dielectric_from_nk
)
Dispersive mediums#
Dispersive mediums can be defined in three ways:
Imported from our material_library.
Defined directly by specifying the parameters in the various supplied dispersive models.
Fitted to optical n-k data using the dispersion fitting tool plugin (more info later).
[10]:
# material library
silver = td.material_library["Ag"]
silver_variants = silver.variants
print("variants for silver include: ", list(silver_variants.keys()))
silver = silver_variants["JohnsonChristy1972"]

# models
lorentz_model = td.Lorentz(eps_inf=2.0, coeffs=[(1, 2, 3), (4, 5, 6)])
sellmeier_model = td.Sellmeier(coeffs=[(1, 2), (3, 4)])
variants for silver include: ['Rakic1998BB', 'JohnsonChristy1972', 'RakicLorentzDrude1998', 'Yang2015Drude']
Medium Methods#
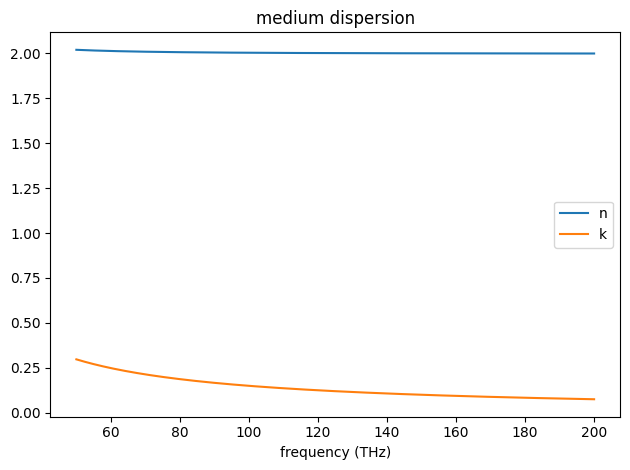
The complex-valued permittivity of a medium at a given frequency can be sampled using the .eps_model(freq) method.
And the n, k values can be plotted over a frequency range using the .plot(freqs) method.
[11]:
freqs_hz = 1e12 * np.linspace(50, 200, 1001)
print(f"complex relative permittivity at freqs_hz = \n\t {lossy_dielectric.eps_model(freqs_hz)}\n")

ax = lossy_dielectric_from_nk.plot(freqs_hz)
complex relative permittivity at freqs_hz =
         [4.+359.50207169j 4.+358.42679132j 4.+357.35792415j ... 4. +90.01053372j
 4. +89.94297515j 4. +89.87551792j]
Geometries#
The new version of Tidy3D introduces Geometry objects, which do the heavy lifting for any components with some spatial extent.
There are 5 primitive and 2 compound geometry classes:
If your device is defined in GDS format, they may be loaded using the Geometry.from_gds() static method. Please refer to the tutorial notebook on GDS importing for more details.
All Geometry objects have many useful methods for checking intersections, bounds, and other properties.
[12]:
s1 = td.Sphere(radius=1, center=(0, 0, 0))
s2 = td.Box(center=(1, 1, 1), size=(1, 1, 1))

# do two geometric objects intersect?
print(s1.intersects(s2))

# does the object intersect a plane?
print(s1.intersects_plane(z=10))

# get polygons that intersect sphere at plane x=0
print(s1.intersects_plane(x=0))

# get bounds (rmin, rmax) of geometry
print(s1.bounds)

# get td.Box() for bounding box of geometry
print(s1.bounding_box.help())

# evaluate whether point(s) are inside of geometry
print(s1.inside(x=0, y=1, z=1))
print(s1.inside(x=np.linspace(-1, 1, 5), y=np.zeros(5), z=np.ones(5)))

# plot the geometry at a cross sectional plane
ax = s1.plot(y=0)
True
False
True
((-1.0, -1.0, -1.0), (1.0, 1.0, 1.0))
╭──────────────────── <class 'tidy3d.components.geometry.base.Box'> ─────────────────────╮
│ Rectangular prism.                                                                     │
│    Also base class for :class:`.Simulation`, :class:`Monitor`, and :class:`Source`.    │
│                                                                                        │
│ ╭────────────────────────────────────────────────────────────────────────────────────╮ │
│ │ Box(attrs={}, type='Box', center=(0.0, 0.0, 0.0), size=(2.0, 2.0, 2.0))            │ │
│ ╰────────────────────────────────────────────────────────────────────────────────────╯ │
│                                                                                        │
│        attrs = {}                                                                      │
│ bounding_box = Box(attrs={}, type='Box', center=(0.0, 0.0, 0.0), size=(2.0, 2.0, 2.0)) │
│       bounds = ((-1.0, -1.0, -1.0), (1.0, 1.0, 1.0))                                   │
│       center = (0.0, 0.0, 0.0)                                                         │
│     geometry = Box(attrs={}, type='Box', center=(0.0, 0.0, 0.0), size=(2.0, 2.0, 2.0)) │
│  plot_params = PlotParams(                                                             │
│                    attrs={},                                                           │
│                    alpha=1.0,                                                          │
│                    zorder=None,                                                        │
│                    type='PlotParams',                                                  │
│                    edgecolor=None,                                                     │
│                    facecolor=None,                                                     │
│                    fill=True,                                                          │
│                    hatch=None,                                                         │
│                    linewidth=1.0                                                       │
│                )                                                                       │
│         size = (2.0, 2.0, 2.0)                                                         │
│         type = 'Box'                                                                   │
│    zero_dims = []                                                                      │
╰────────────────────────────────────────────────────────────────────────────────────────╯
None
False
[False False  True False False]
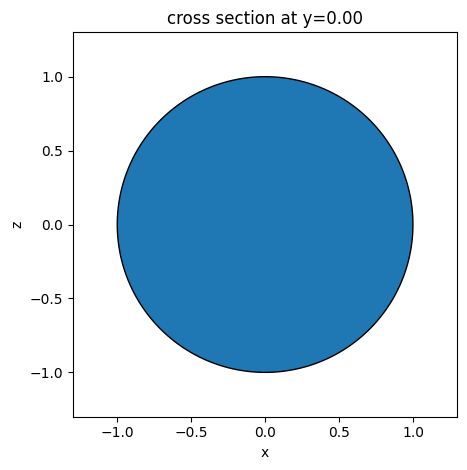
Note, because simulations, monitors, and sources all are defined spatially, they inherit from Box and contain these methods as well, which can come in handy when doing validation.
Structures#
A Structure is a component that simply contains a Geometry and a Medium. It therefore defines an object in the simulation with some geometry and optical properties, such as a waveguide or slab.
[13]:
dielectric_box = td.Structure(
    geometry=td.Box(center=(0, 0, 0), size=(1, 1, 1)),
    medium=td.Medium(permittivity=2.0),
)
Sources#
Sources define how the electromagnetic current is injected into the simulation to give rise to fields. There are several types of sources, each generally defines some spatial or polarization properties of the source and also contain a source_time field, which defines the time dependence. As an example
[14]:
# define time dependence
gaussian = td.GaussianPulse(freq0=150e12, fwidth=10e12)

# z polarized dipole at origin
dipole = td.UniformCurrentSource(
    center=(0, 0, 0), size=(0, 0, 0), source_time=gaussian, polarization="Ez"
)

# z polarized plane wave propagating in -x
plane_wave = td.PlaneWave(
    center=(0, 0, 0),
    size=(0, td.inf, td.inf),
    source_time=gaussian,
    pol_angle=np.pi / 2,
    direction="-",
)
Monitors#
Since it would be impractical to return the entire time series of all of the field data solved for by FDTD, “monitors” are specifications that tell Tidy3D what data should be returned by the solver.
The following monitors measure their corresponding values in the frequency-domain
And the following measure their values in the time-domain
There are also various monitors for field projections, diffraction efficiency, and other values. The API reference lists each of the monitor types, for reference.
Note: all monitors must be named (have a name: str field supplied). The data returned by the server will be indexed by the monitor name and accessed by the user using that name.
[15]:
# measures Ex, Ey, Hz fields on the plane at frequency 150THz
mon1 = td.FieldMonitor(
    center=(1, 0, 0),
    size=(td.inf, td.inf, 0),
    fields=["Ex", "Ey", "Hz"],
    freqs=[150e12],
    name="fields_at_150THz",
)

# measures time dependence of flux through a plane every 5 time steps between a window of (start, stop)
mon2 = td.FluxTimeMonitor(
    center=(1, 0, 0),
    size=(td.inf, td.inf, 0),
    start=1e-13,
    stop=3e-13,
    interval=5,
    name="flux_over_time",
)
Modes#
Modes (for sources and monitors) are specified using a ModeSpec object. This component contains all of the specifications needed for the mode solver to know which modes to inject or measure in the ModeSource and ModeMonitor objects, such as the number of modes, mode index, or a target mode effective index.
For example:
[16]:
# default mode solver spec (returns first mode)
fundamental = td.ModeSpec()

# tell the mode solver to return 4 modes
first_4_modes = td.ModeSpec(num_modes=4)

# have mode solver return 4 modes around the target effective index
complicated = td.ModeSpec(num_modes=4, target_neff=2.0)
Using the mode specifications, we can make modal sources or monitors similar to before.
[17]:
# inject the fundamental mode
mode_source = td.ModeSource(
    center=(0, 0, -1),
    size=(td.inf, td.inf, 0),
    source_time=gaussian,
    mode_spec=fundamental,
    mode_index=0,
    direction="+",
)

# do modal decomposition and return amplitude data for the first 4 modes
mode_mon = td.ModeMonitor(
    center=(0, 0, +1),
    size=(td.inf, td.inf, 0),
    freqs=freqs_hz,
    mode_spec=first_4_modes,
    name="modes",
)
The ModeSolver is designed to help users come up with the correct ModeSpec for their problem, at which point it can be used directly in ModeSource and ModeMonitor objects without setting it explicitly using a Simulation method. For more details, refer to the mode solver tutorial notebook.
Absorbing Boundaries#
Absorbing boundaries are defined as one of three types of boundaries
td.PML() defines a standard PML, with an adjustable number of layers.
td.StablePML() defines a PML with a ‘stable’ profile, which can reduce divergence at the expense of more layers.
td.Absorber() defines adiabatically increasing conductivity values at the edges of the simulation, which can dramatically improve stability of simulations involving dispersive materials, again at the expense of more layers.
As before, these layers add to the simulation size defined in Simulation.
Also as before, it is important to extend any structures all the way through the PML if they are meant to be touching the simulation boundary on that side.
To define a sequence of PML layers on the x, y, z sides of the simulation, one may use the convenience functions provided in td.BoundarySpec() and td.Boundary(), as shown below.
Default PML boundaries are always used on each side of the simulation, so if a boundary is not specified along a dimension, the simulation will have PML on that boundary.
[18]:
# standard absorber on x, PML with 20 layers on y, no PML on z (periodic BC)
boundary_spec = td.BoundarySpec(
    x=td.Boundary.absorber(), y=td.Boundary.pml(num_layers=20), z=td.Boundary.periodic()
)
Simulations#
Finally, the Simulation objects contain all of the specifications needed to run the Tidy3D simulation and contain all of the previous components.
A few notes:
Simulation accepts an optional
mediumparameter, specifying the background medium (air by default).Each simulation must define the discretization using a
grid_spec, which specifies how the grid is to be generated along each of the three directions. These are discussed in more detail here.
[19]:
sim = td.Simulation(
    size=(4, 4, 4),
    grid_spec=td.GridSpec.uniform(dl=0.2),
    run_time=1e-12,
    boundary_spec=td.BoundarySpec(
        x=td.Boundary.periodic(), y=td.Boundary.pml(), z=td.Boundary.periodic()
    ),
    structures=[dielectric_box],
    sources=[dipole],
    monitors=[mon1, mon2],
)
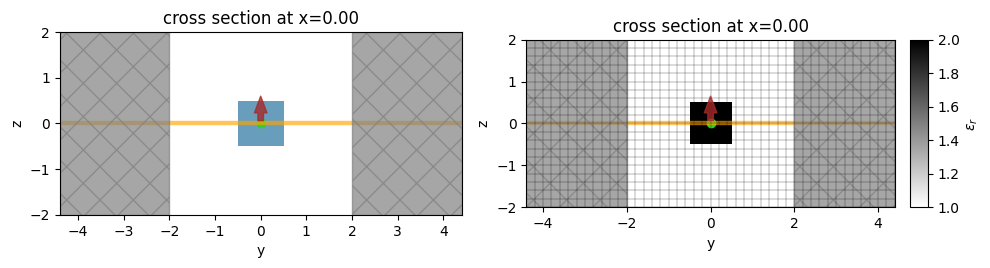
A defined Simulation also provides several useful methods in addition to the ones inherited from Box.
[20]:
# get permittivity at yee cell centers in a volume defined by a box.
sim.epsilon(td.Box(size=(1, 0, 1)), "centers")

# get a `td.Grid` containing all information about spatial locations in the FDTD / yee grid
print(sim.grid.centers)

# plot the simulation cross section
f, (ax1, ax2) = plt.subplots(1, 2, tight_layout=True, figsize=(10, 4))

# plot the structures, PML, sources, mediums
ax1 = sim.plot(x=0, ax=ax1)

# same thing but plot structure in grayscale using permittivity value
ax1 = sim.plot_eps(x=0, ax=ax2)

# add the FDTD grid boundaries
ax2 = sim.plot_grid(x=0, ax=ax2)
attrs={} x=array([-1.9, -1.7, -1.5, -1.3, -1.1, -0.9, -0.7, -0.5, -0.3, -0.1,  0.1,
        0.3,  0.5,  0.7,  0.9,  1.1,  1.3,  1.5,  1.7,  1.9]) y=array([-4.3, -4.1, -3.9, -3.7, -3.5, -3.3, -3.1, -2.9, -2.7, -2.5, -2.3,
       -2.1, -1.9, -1.7, -1.5, -1.3, -1.1, -0.9, -0.7, -0.5, -0.3, -0.1,
        0.1,  0.3,  0.5,  0.7,  0.9,  1.1,  1.3,  1.5,  1.7,  1.9,  2.1,
        2.3,  2.5,  2.7,  2.9,  3.1,  3.3,  3.5,  3.7,  3.9,  4.1,  4.3]) z=array([-1.9, -1.7, -1.5, -1.3, -1.1, -0.9, -0.7, -0.5, -0.3, -0.1,  0.1,
        0.3,  0.5,  0.7,  0.9,  1.1,  1.3,  1.5,  1.7,  1.9]) type='Coords'
Simulation Submission#
Here we discuss the process for submitting, managing, monitoring, and loading simulations from our server.
Topics covered will include:
tidy3d.web functions.
working with tidy3d.web.Job and tidy3d.web.Batch convenience containers.
[21]:
import tidy3d.web as web
Web interface#
The web interface provides a number of basic functions, but usually, the most convenient way to run a single simulation in one line is with sim_data = web.run(sim), which simply performs all of the necessary steps under the hood.
The output of the simulation is a separate data object called a SimulationData, which provides an interface for post processing and visualizing the data.
[22]:
sim_data = web.run(sim, task_name="web_demo", path="data/data.hdf5", verbose=True)
15:07:22 CET Created task 'web_demo' with resource_id
             'fdve-fae17aac-8105-4166-a1a7-6cf1b414a498' and task_type 'FDTD'.
             View task using web UI at
             'https://tidy3d.simulation.cloud/workbench?taskId=fdve-fae17aac-810
             5-4166-a1a7-6cf1b414a498'.
Task folder: 'default'.
15:07:24 CET Estimated FlexCredit cost: 0.025. Minimum cost depends on task
             execution details. Use 'web.real_cost(task_id)' to get the billed
             FlexCredit cost after a simulation run.
15:07:28 CET status = queued
             To cancel the simulation, use 'web.abort(task_id)' or
             'web.delete(task_id)' or abort/delete the task in the web UI.
             Terminating the Python script will not stop the job running on the
             cloud.
15:07:36 CET starting up solver
running solver
15:07:37 CET status = success
             View simulation result at
             'https://tidy3d.simulation.cloud/workbench?taskId=fdve-fae17aac-810
             5-4166-a1a7-6cf1b414a498'.
15:07:40 CET Loading simulation from data/data.hdf5
             WARNING: Simulation final field decay value of 0.00665 is greater
             than the simulation shutoff threshold of 1e-05. Consider running
             the simulation again with a larger 'run_time' duration for more
             accurate results.
Note: the warning here tells us that we should probably increase the
run_timeof ourSimulationto ensure the fields properly decay. Since this notebook is just a demonstration and we don’t care about the results, we can ignore it in this case.
Containers and Batching#
Since Tidy3D version 2.10, web.run is also capable of running any nested combination of lists, tuples, and dictionaries of simulations and returning them in the same structure. The legacy function web.run_async will be deprecated.
The convenience containers Job and Batch allow one to manage single and multiple tasks in a more “object oriented” fashion.
They follow the same basic API as the web. functions, except Batch objects accept a dictionary of simulations and return generators that can be iterated through to give SimulationData for each task, rather than returning it one by one. This cuts down on memory
for several large jobs.
While we won’t cover all of the details here, for more information, see the tutorial on the Web API or look at the examples in the other notebooks.
Output Data#
Here we will discuss working with output data from a simulation.
Topics covered will include:
SimulationData objects.
Obtaining information about a completed FDTD simulation.
Selecting data by monitor or field value.
Post-processing and visualizing data.
Simulation Data#
As mentioned, tidy3d data for a single task is stored in a SimulationData object.
In addition to storing the data for each of the individual monitors in the simulation, it has its own useful functionality.
[23]:
# print the log, which is stored as an attribute rather than as its own file
print(sim_data.log)

# get a copy of the original Simulation, so it also doesn't need to be stored separately
sim_data.simulation.help()
[14:07:31] USER: Simulation domain Nx, Ny, Nz: [20, 44, 20]
           USER: Applied symmetries: (0, 0, 0)
           USER: Number of computational grid points: 1.8400e+04.
           USER: Subpixel averaging method: SubpixelSpec(attrs={},
           dielectric=PolarizedAveraging(attrs={}, type='PolarizedAveraging'),
           metal=Staircasing(attrs={}, type='Staircasing'),
           pec=PECConformal(attrs={}, type='PECConformal',
           timestep_reduction=0.3, edge_singularity_correction=True),
           pmc=Staircasing(attrs={}, type='Staircasing'),
           lossy_metal=SurfaceImpedance(attrs={}, type='SurfaceImpedance',
           timestep_reduction=0.0, edge_singularity_correction=True),
           type='SubpixelSpec')
           USER: Number of time steps: 2.6240e+03
           USER: Automatic shutoff factor: 1.00e-05
           USER: Time step (s): 3.8131e-16
           USER:

           USER: Compute source modes time (s):     0.0500
           USER: Rest of setup time (s):            0.2928
[14:07:32] USER: Compute monitor modes time (s):    0.0001
           USER: Solver time (s):                   0.3610
           USER: Time-stepping speed (cells/s):     1.40e+08
[14:07:33] USER: Post-processing time (s):          0.1782

 ====== SOLVER LOG ======

Processing grid and structures...
Building FDTD update coefficients...
Solver setup time (s):             0.0139

Running solver for 2624 time steps...
- Time step    104 / time 3.97e-14s (  4 % done), field decay: 1.00e+00
- Time step    209 / time 7.97e-14s (  8 % done), field decay: 1.00e+00
- Time step    314 / time 1.20e-13s ( 12 % done), field decay: 8.37e-01
- Time step    419 / time 1.60e-13s ( 16 % done), field decay: 6.39e-01
- Time step    524 / time 2.00e-13s ( 20 % done), field decay: 5.01e-01
- Time step    629 / time 2.40e-13s ( 24 % done), field decay: 1.96e-01
- Time step    734 / time 2.80e-13s ( 28 % done), field decay: 1.68e-02
- Time step    839 / time 3.20e-13s ( 32 % done), field decay: 5.76e-02
- Time step    944 / time 3.60e-13s ( 36 % done), field decay: 1.87e-01
- Time step   1049 / time 4.00e-13s ( 40 % done), field decay: 2.24e-01
- Time step   1154 / time 4.40e-13s ( 44 % done), field decay: 1.52e-01
- Time step   1259 / time 4.80e-13s ( 48 % done), field decay: 5.30e-02
- Time step   1364 / time 5.20e-13s ( 52 % done), field decay: 8.46e-03
- Time step   1469 / time 5.60e-13s ( 56 % done), field decay: 3.79e-02
- Time step   1574 / time 6.00e-13s ( 60 % done), field decay: 8.47e-02
- Time step   1679 / time 6.40e-13s ( 64 % done), field decay: 9.63e-02
- Time step   1784 / time 6.80e-13s ( 68 % done), field decay: 6.24e-02
- Time step   1889 / time 7.20e-13s ( 72 % done), field decay: 2.18e-02
- Time step   1994 / time 7.60e-13s ( 76 % done), field decay: 3.68e-03
- Time step   2099 / time 8.00e-13s ( 80 % done), field decay: 1.79e-02
- Time step   2204 / time 8.40e-13s ( 84 % done), field decay: 4.02e-02
- Time step   2309 / time 8.80e-13s ( 88 % done), field decay: 4.54e-02
- Time step   2414 / time 9.20e-13s ( 92 % done), field decay: 2.74e-02
- Time step   2519 / time 9.61e-13s ( 96 % done), field decay: 6.95e-03
- Time step   2623 / time 1.00e-12s (100 % done), field decay: 6.65e-03
Time-stepping time (s):            0.3460
Data write time (s):               0.0014
             WARNING: 'Simulation.background_structure' will be removed in
             Tidy3D 3.0. Use 'Simulation.scene.background_structure' instead.
             WARNING: 'Simulation.bounds_pml' will be removed in Tidy3D 3.0. Use
             'Simulation.simulation_bounds' instead.
             WARNING: 'Simulation.medium_map' will be removed in Tidy3D 3.0. Use
             'Simulation.scene.medium_map' instead.
             WARNING: 'Simulation.mediums' will be removed in Tidy3D 3.0. Use
             'Simulation.scene.mediums' instead.
╭─────────────────────────────── <class 'tidy3d.components.simulation.Simulation'> ───────────────────────────────╮ │ Custom implementation of Maxwell’s equations which represents the physical model to be solved using the FDTD │ │ method. │ │ │ │ ╭─────────────────────────────────────────────────────────────────────────────────────────────────────────────╮ │ │ │ Simulation( │ │ │ │ │ attrs={}, │ │ │ │ │ type='Simulation', │ │ │ │ │ center=(0.0, 0.0, 0.0), │ │ │ │ │ size=(4.0, 4.0, 4.0), │ │ │ │ │ medium=Medium( │ │ │ │ │ │ attrs={}, │ │ │ │ │ │ name=None, │ │ │ │ │ │ frequency_range=None, │ │ │ │ │ │ allow_gain=False, │ │ │ │ │ │ nonlinear_spec=None, │ │ │ │ │ │ modulation_spec=None, │ │ │ │ │ │ viz_spec=None, │ │ │ │ │ │ heat_spec=None, │ │ │ │ │ │ type='Medium', │ │ │ │ │ │ permittivity=1.0, │ │ │ │ │ │ conductivity=0.0 │ │ │ │ │ ), │ │ │ │ │ structures=( │ │ │ │ │ │ Structure( │ │ │ │ │ │ │ attrs={}, │ │ │ │ │ │ │ geometry=Box(attrs={}, type='Box', center=(0.0, 0.0, 0.0), size=(1.0, 1.0, 1.0)), │ │ │ │ │ │ │ name=None, │ │ │ │ │ │ │ background_permittivity=None, │ │ │ │ │ │ │ background_medium=None, │ │ │ │ │ │ │ priority=None, │ │ │ │ │ │ │ type='Structure', │ │ │ │ │ │ │ medium=Medium( │ │ │ │ │ │ │ │ attrs={}, │ │ │ │ │ │ │ │ name=None, │ │ │ │ │ │ │ │ frequency_range=None, │ │ │ │ │ │ │ │ allow_gain=False, │ │ │ │ │ │ │ │ nonlinear_spec=None, │ │ │ │ │ │ │ │ modulation_spec=None, │ │ │ │ │ │ │ │ viz_spec=None, │ │ │ │ │ │ │ │ heat_spec=None, │ │ │ │ │ │ │ │ type='Medium', │ │ │ │ │ │ │ │ permittivity=2.0, │ │ │ │ │ │ │ │ conductivity=0.0 │ │ │ │ │ │ │ ) │ │ │ │ │ │ ), │ │ │ │ │ ), │ │ │ │ │ symmetry=(0, 0, 0), │ │ │ │ │ sources=( │ │ │ │ │ │ UniformCurrentSource( │ │ │ │ │ │ │ attrs={}, │ │ │ │ │ │ │ name=None, │ │ │ │ │ │ │ type='UniformCurrentSource', │ │ │ │ │ │ │ center=(0.0, 0.0, 0.0), │ │ │ │ │ │ │ size=(0.0, 0.0, 0.0), │ │ │ │ │ │ │ source_time=GaussianPulse( │ │ │ │ │ │ │ │ attrs={}, │ │ │ │ │ │ │ │ amplitude=1.0, │ │ │ │ │ │ │ │ phase=0.0, │ │ │ │ │ │ │ │ type='GaussianPulse', │ │ │ │ │ │ │ │ freq0=150000000000000.0, │ │ │ │ │ │ │ │ fwidth=10000000000000.0, │ │ │ │ │ │ │ │ offset=5.0, │ │ │ │ │ │ │ │ remove_dc_component=True │ │ │ │ │ │ │ ), │ │ │ │ │ │ │ interpolate=True, │ │ │ │ │ │ │ confine_to_bounds=False, │ │ │ │ │ │ │ polarization='Ez' │ │ │ │ │ │ ), │ │ │ │ │ ), │ │ │ │ │ boundary_spec=BoundarySpec( │ │ │ │ │ │ attrs={}, │ │ │ │ │ │ x=Boundary( │ │ │ │ │ │ │ attrs={}, │ │ │ │ │ │ │ plus=Periodic(attrs={}, name=None, type='Periodic'), │ │ │ │ │ │ │ minus=Periodic(attrs={}, name=None, type='Periodic'), │ │ │ │ │ │ │ type='Boundary' │ │ │ │ │ │ ), │ │ │ │ │ │ y=Boundary( │ │ │ │ │ │ │ attrs={}, │ │ │ │ │ │ │ plus=PML( │ │ │ │ │ │ │ │ attrs={}, │ │ │ │ │ │ │ │ name=None, │ │ │ │ │ │ │ │ type='PML', │ │ │ │ │ │ │ │ num_layers=12, │ │ │ │ │ │ │ │ parameters=PMLParams( │ │ │ │ │ │ │ │ │ attrs={}, │ │ │ │ │ │ │ │ │ sigma_order=3, │ │ │ │ │ │ │ │ │ sigma_min=0.0, │ │ │ │ │ │ │ │ │ sigma_max=1.5, │ │ │ │ │ │ │ │ │ type='PMLParams', │ │ │ │ │ │ │ │ │ kappa_order=3, │ │ │ │ │ │ │ │ │ kappa_min=1.0, │ │ │ │ │ │ │ │ │ kappa_max=3.0, │ │ │ │ │ │ │ │ │ alpha_order=1, │ │ │ │ │ │ │ │ │ alpha_min=0.0, │ │ │ │ │ │ │ │ │ alpha_max=0.0 │ │ │ │ │ │ │ │ ) │ │ │ │ │ │ │ ), │ │ │ │ │ │ │ minus=PML( │ │ │ │ │ │ │ │ attrs={}, │ │ │ │ │ │ │ │ name=None, │ │ │ │ │ │ │ │ type='PML', │ │ │ │ │ │ │ │ num_layers=12, │ │ │ │ │ │ │ │ parameters=PMLParams( │ │ │ │ │ │ │ │ │ attrs={}, │ │ │ │ │ │ │ │ │ sigma_order=3, │ │ │ │ │ │ │ │ │ sigma_min=0.0, │ │ │ │ │ │ │ │ │ sigma_max=1.5, │ │ │ │ │ │ │ │ │ type='PMLParams', │ │ │ │ │ │ │ │ │ kappa_order=3, │ │ │ │ │ │ │ │ │ kappa_min=1.0, │ │ │ │ │ │ │ │ │ kappa_max=3.0, │ │ │ │ │ │ │ │ │ alpha_order=1, │ │ │ │ │ │ │ │ │ alpha_min=0.0, │ │ │ │ │ │ │ │ │ alpha_max=0.0 │ │ │ │ │ │ │ │ ) │ │ │ │ │ │ │ ), │ │ │ │ │ │ │ type='Boundary' │ │ │ │ │ │ ), │ │ │ │ │ │ z=Boundary( │ │ │ │ │ │ │ attrs={}, │ │ │ │ │ │ │ plus=Periodic(attrs={}, name=None, type='Periodic'), │ │ │ │ │ │ │ minus=Periodic(attrs={}, name=None, type='Periodic'), │ │ │ │ │ │ │ type='Boundary' │ │ │ │ │ │ ), │ │ │ │ │ │ type='BoundarySpec' │ │ │ │ │ ), │ │ │ │ │ monitors=( │ │ │ │ │ │ FieldMonitor( │ │ │ │ │ │ │ attrs={}, │ │ │ │ │ │ │ type='FieldMonitor', │ │ │ │ │ │ │ center=(1.0, 0.0, 0.0), │ │ │ │ │ │ │ size=(inf, inf, 0.0), │ │ │ │ │ │ │ name='fields_at_150THz', │ │ │ │ │ │ │ interval_space=(1, 1, 1), │ │ │ │ │ │ │ colocate=True, │ │ │ │ │ │ │ freqs=(150000000000000.0,), │ │ │ │ │ │ │ apodization=ApodizationSpec( │ │ │ │ │ │ │ │ attrs={}, │ │ │ │ │ │ │ │ start=None, │ │ │ │ │ │ │ │ end=None, │ │ │ │ │ │ │ │ width=None, │ │ │ │ │ │ │ │ type='ApodizationSpec' │ │ │ │ │ │ │ ), │ │ │ │ │ │ │ fields=('Ex', 'Ey', 'Hz') │ │ │ │ │ │ ), │ │ │ │ │ │ FluxTimeMonitor( │ │ │ │ │ │ │ attrs={}, │ │ │ │ │ │ │ type='FluxTimeMonitor', │ │ │ │ │ │ │ center=(1.0, 0.0, 0.0), │ │ │ │ │ │ │ size=(inf, inf, 0.0), │ │ │ │ │ │ │ name='flux_over_time', │ │ │ │ │ │ │ interval_space=(1, 1, 1), │ │ │ │ │ │ │ colocate=True, │ │ │ │ │ │ │ start=1e-13, │ │ │ │ │ │ │ stop=3e-13, │ │ │ │ │ │ │ interval=5, │ │ │ │ │ │ │ normal_dir='+', │ │ │ │ │ │ │ exclude_surfaces=None │ │ │ │ │ │ ) │ │ │ │ │ ), │ │ │ │ │ grid_spec=GridSpec( │ │ │ │ │ │ attrs={}, │ │ │ │ │ │ grid_x=UniformGrid(attrs={}, type='UniformGrid', dl=0.2), │ │ │ │ │ │ grid_y=UniformGrid(attrs={}, type='UniformGrid', dl=0.2), │ │ │ │ │ │ grid_z=UniformGrid(attrs={}, type='UniformGrid', dl=0.2), │ │ │ │ │ │ wavelength=None, │ │ │ │ │ │ override_structures=(), │ │ │ │ │ │ snapping_points=(), │ │ │ │ │ │ layer_refinement_specs=(), │ │ │ │ │ │ type='GridSpec' │ │ │ │ │ ), │ │ │ │ │ version='2.10.0rc3', │ │ │ │ │ plot_length_units='μm', │ │ │ │ │ structure_priority_mode='equal', │ │ │ │ │ lumped_elements=(), │ │ │ │ │ subpixel=SubpixelSpec( │ │ │ │ │ │ attrs={}, │ │ │ │ │ │ dielectric=PolarizedAveraging(attrs={}, type='PolarizedAveraging'), │ │ │ │ │ │ metal=Staircasing(attrs={}, type='Staircasing'), │ │ │ │ │ │ pec=PECConformal( │ │ │ │ │ │ │ attrs={}, │ │ │ │ │ │ │ type='PECConformal', │ │ │ │ │ │ │ timestep_reduction=0.3, │ │ │ │ │ │ │ edge_singularity_correction=True │ │ │ │ │ │ ), │ │ │ │ │ │ pmc=Staircasing(attrs={}, type='Staircasing'), │ │ │ │ │ │ lossy_metal=SurfaceImpedance( │ │ │ │ │ │ │ attrs={}, │ │ │ │ │ │ │ type='SurfaceImpedance', │ │ │ │ │ │ │ timestep_reduction=0.0, │ │ │ │ │ │ │ edge_singularity_correction=True │ │ │ │ │ │ ), │ │ │ │ │ │ type='SubpixelSpec' │ │ │ │ │ ), │ │ │ │ │ simulation_type='tidy3d', │ │ │ │ │ post_norm=1.0, │ │ │ │ │ internal_absorbers=(), │ │ │ │ │ courant=0.99, │ │ │ │ │ precision='hybrid', │ │ │ │ │ normalize_index=0, │ │ │ │ │ shutoff=1e-05, │ │ │ │ │ run_time=1e-12, │ │ │ │ │ low_freq_smoothing=None │ │ │ │ ) │ │ │ ╰─────────────────────────────────────────────────────────────────────────────────────────────────────────────╯ │ │ │ │ all_structures = [ │ │ Structure( │ │ attrs={}, │ │ geometry=Box( │ │ attrs={}, │ │ type='Box', │ │ center=(0.0, 0.0, 0.0), │ │ size=(inf, inf, inf) │ │ ), │ │ name=None, │ │ background_permittivity=None, │ │ background_medium=None, │ │ priority=None, │ │ type='Structure', │ │ medium=Medium( │ │ attrs={}, │ │ name=None, │ │ frequency_range=None, │ │ allow_gain=False, │ │ nonlinear_spec=None, │ │ modulation_spec=None, │ │ viz_spec=None, │ │ heat_spec=None, │ │ type='Medium', │ │ permittivity=1.0, │ │ conductivity=0.0 │ │ ) │ │ ), │ │ Structure( │ │ attrs={}, │ │ geometry=Box( │ │ attrs={}, │ │ type='Box', │ │ center=(0.0, 0.0, 0.0), │ │ size=(1.0, 1.0, 1.0) │ │ ), │ │ name=None, │ │ background_permittivity=None, │ │ background_medium=None, │ │ priority=None, │ │ type='Structure', │ │ medium=Medium( │ │ attrs={}, │ │ name=None, │ │ frequency_range=None, │ │ allow_gain=False, │ │ nonlinear_spec=None, │ │ modulation_spec=None, │ │ viz_spec=None, │ │ heat_spec=None, │ │ type='Medium', │ │ permittivity=2.0, │ │ conductivity=0.0 │ │ ) │ │ ) │ │ ] │ │ allow_gain = False │ │ attrs = {} │ │ aux_fields = [] │ │ background_structure = Structure( │ │ attrs={}, │ │ geometry=Box( │ │ attrs={}, │ │ type='Box', │ │ center=(0.0, 0.0, 0.0), │ │ size=(inf, inf, inf) │ │ ), │ │ name=None, │ │ background_permittivity=None, │ │ background_medium=None, │ │ priority=None, │ │ type='Structure', │ │ medium=Medium( │ │ attrs={}, │ │ name=None, │ │ frequency_range=None, │ │ allow_gain=False, │ │ nonlinear_spec=None, │ │ modulation_spec=None, │ │ viz_spec=None, │ │ heat_spec=None, │ │ type='Medium', │ │ permittivity=1.0, │ │ conductivity=0.0 │ │ ) │ │ ) │ │ boundary_spec = BoundarySpec( │ │ attrs={}, │ │ x=Boundary( │ │ attrs={}, │ │ plus=Periodic(attrs={}, name=None, type='Periodic'), │ │ minus=Periodic(attrs={}, name=None, type='Periodic'), │ │ type='Boundary' │ │ ), │ │ y=Boundary( │ │ attrs={}, │ │ plus=PML( │ │ attrs={}, │ │ name=None, │ │ type='PML', │ │ num_layers=12, │ │ parameters=PMLParams( │ │ attrs={}, │ │ sigma_order=3, │ │ sigma_min=0.0, │ │ sigma_max=1.5, │ │ type='PMLParams', │ │ kappa_order=3, │ │ kappa_min=1.0, │ │ kappa_max=3.0, │ │ alpha_order=1, │ │ alpha_min=0.0, │ │ alpha_max=0.0 │ │ ) │ │ ), │ │ minus=PML( │ │ attrs={}, │ │ name=None, │ │ type='PML', │ │ num_layers=12, │ │ parameters=PMLParams( │ │ attrs={}, │ │ sigma_order=3, │ │ sigma_min=0.0, │ │ sigma_max=1.5, │ │ type='PMLParams', │ │ kappa_order=3, │ │ kappa_min=1.0, │ │ kappa_max=3.0, │ │ alpha_order=1, │ │ alpha_min=0.0, │ │ alpha_max=0.0 │ │ ) │ │ ), │ │ type='Boundary' │ │ ), │ │ z=Boundary( │ │ attrs={}, │ │ plus=Periodic(attrs={}, name=None, type='Periodic'), │ │ minus=Periodic(attrs={}, name=None, type='Periodic'), │ │ type='Boundary' │ │ ), │ │ type='BoundarySpec' │ │ ) │ │ bounding_box = Box(attrs={}, type='Box', center=(0.0, 0.0, 0.0), size=(4.0, 4.0, 4.0)) │ │ bounds = ((-2.0, -2.0, -2.0), (2.0, 2.0, 2.0)) │ │ bounds_pml = ( │ │ (np.float64(-2.0), np.float64(-4.3999999999999995), np.float64(-2.0)), │ │ (np.float64(2.0), np.float64(4.399999999999997), np.float64(2.0)) │ │ ) │ │ center = (0.0, 0.0, 0.0) │ │ complex_fields = False │ │ courant = 0.99 │ │ custom_datasets = [] │ │ dt = np.float64(3.813149739062003e-16) │ │ frequency_range = (110770887769698.48, 190588842668354.53) │ │ geometry = Box(attrs={}, type='Box', center=(0.0, 0.0, 0.0), size=(4.0, 4.0, 4.0)) │ │ grid = Grid( │ │ attrs={}, │ │ boundaries=Coords( │ │ attrs={}, │ │ x=array([-2. , -1.8, -1.6, -1.4, -1.2, -1. , -0.8, -0.6, -0.4, -0.2, │ │ 0. , │ │ 0.2, 0.4, 0.6, 0.8, 1. , 1.2, 1.4, 1.6, 1.8, 2. ]), │ │ y=array([-4.4, -4.2, -4. , -3.8, -3.6, -3.4, -3.2, -3. , -2.8, -2.6, │ │ -2.4, │ │ -2.2, -2. , -1.8, -1.6, -1.4, -1.2, -1. , -0.8, -0.6, -0.4, -0.2, │ │ 0. , 0.2, 0.4, 0.6, 0.8, 1. , 1.2, 1.4, 1.6, 1.8, 2. , │ │ 2.2, 2.4, 2.6, 2.8, 3. , 3.2, 3.4, 3.6, 3.8, 4. , 4.2, │ │ 4.4]), │ │ z=array([-2. , -1.8, -1.6, -1.4, -1.2, -1. , -0.8, -0.6, -0.4, -0.2, │ │ 0. , │ │ 0.2, 0.4, 0.6, 0.8, 1. , 1.2, 1.4, 1.6, 1.8, 2. ]), │ │ type='Coords' │ │ ), │ │ type='Grid' │ │ ) │ │ grid_info = { │ │ 'Nx': 20, │ │ 'Ny': 44, │ │ 'Nz': 20, │ │ 'grid_points': 17600, │ │ 'min_grid_size': 0.1999999999999993, │ │ 'max_grid_size': 0.20000000000000018, │ │ 'computational_complexity': 88000.0000000003 │ │ } │ │ grid_spec = GridSpec( │ │ attrs={}, │ │ grid_x=UniformGrid(attrs={}, type='UniformGrid', dl=0.2), │ │ grid_y=UniformGrid(attrs={}, type='UniformGrid', dl=0.2), │ │ grid_z=UniformGrid(attrs={}, type='UniformGrid', dl=0.2), │ │ wavelength=None, │ │ override_structures=(), │ │ snapping_points=(), │ │ layer_refinement_specs=(), │ │ type='GridSpec' │ │ ) │ │ internal_absorbers = () │ │ internal_override_structures = [] │ │ internal_snapping_points = [] │ │ low_freq_smoothing = None │ │ lumped_elements = () │ │ medium = Medium( │ │ attrs={}, │ │ name=None, │ │ frequency_range=None, │ │ allow_gain=False, │ │ nonlinear_spec=None, │ │ modulation_spec=None, │ │ viz_spec=None, │ │ heat_spec=None, │ │ type='Medium', │ │ permittivity=1.0, │ │ conductivity=0.0 │ │ ) │ │ medium_map = { │ │ Medium(attrs={}, name=None, frequency_range=None, allow_gain=False, │ │ nonlinear_spec=None, modulation_spec=None, viz_spec=None, heat_spec=None, │ │ type='Medium', permittivity=1.0, conductivity=0.0): 0, │ │ Medium(attrs={}, name=None, frequency_range=None, allow_gain=False, │ │ nonlinear_spec=None, modulation_spec=None, viz_spec=None, heat_spec=None, │ │ type='Medium', permittivity=2.0, conductivity=0.0): 1 │ │ } │ │ mediums = [ │ │ Medium( │ │ attrs={}, │ │ name=None, │ │ frequency_range=None, │ │ allow_gain=False, │ │ nonlinear_spec=None, │ │ modulation_spec=None, │ │ viz_spec=None, │ │ heat_spec=None, │ │ type='Medium', │ │ permittivity=1.0, │ │ conductivity=0.0 │ │ ), │ │ Medium( │ │ attrs={}, │ │ name=None, │ │ frequency_range=None, │ │ allow_gain=False, │ │ nonlinear_spec=None, │ │ modulation_spec=None, │ │ viz_spec=None, │ │ heat_spec=None, │ │ type='Medium', │ │ permittivity=2.0, │ │ conductivity=0.0 │ │ ) │ │ ] │ │ monitors = ( │ │ FieldMonitor( │ │ attrs={}, │ │ type='FieldMonitor', │ │ center=(1.0, 0.0, 0.0), │ │ size=(inf, inf, 0.0), │ │ name='fields_at_150THz', │ │ interval_space=(1, 1, 1), │ │ colocate=True, │ │ freqs=(150000000000000.0,), │ │ apodization=ApodizationSpec( │ │ attrs={}, │ │ start=None, │ │ end=None, │ │ width=None, │ │ type='ApodizationSpec' │ │ ), │ │ fields=('Ex', 'Ey', 'Hz') │ │ ), │ │ FluxTimeMonitor( │ │ attrs={}, │ │ type='FluxTimeMonitor', │ │ center=(1.0, 0.0, 0.0), │ │ size=(inf, inf, 0.0), │ │ name='flux_over_time', │ │ interval_space=(1, 1, 1), │ │ colocate=True, │ │ start=1e-13, │ │ stop=3e-13, │ │ interval=5, │ │ normal_dir='+', │ │ exclude_surfaces=None │ │ ) │ │ ) │ │ monitors_data_size = {'fields_at_150THz': 22680.0, 'flux_over_time': 416.0} │ │ n_max = AttributeError("'Simulation' object has no attribute 'freq_max'") │ │ normalize_index = 0 │ │ num_cells = 17600 │ │ num_computational_grid_points = np.int64(18400) │ │ num_pml_layers = [[0, 0], [12, 12], [0, 0]] │ │ num_time_steps = 2624 │ │ nyquist_step = 5 │ │ plot_length_units = 'μm' │ │ plot_params = PlotParams( │ │ attrs={}, │ │ alpha=1.0, │ │ zorder=None, │ │ type='PlotParams', │ │ edgecolor=None, │ │ facecolor=None, │ │ fill=True, │ │ hatch=None, │ │ linewidth=1.0 │ │ ) │ │ pml_thicknesses = [ │ │ (np.float64(0.0), np.float64(0.0)), │ │ (np.float64(2.3999999999999995), np.float64(2.399999999999997)), │ │ (np.float64(0.0), np.float64(0.0)) │ │ ] │ │ post_norm = 1.0 │ │ precision = 'hybrid' │ │ run_time = 1e-12 │ │ scaled_courant = 0.99 │ │ scene = Scene( │ │ attrs={}, │ │ medium=Medium( │ │ attrs={}, │ │ name=None, │ │ frequency_range=None, │ │ allow_gain=False, │ │ nonlinear_spec=None, │ │ modulation_spec=None, │ │ viz_spec=None, │ │ heat_spec=None, │ │ type='Medium', │ │ permittivity=1.0, │ │ conductivity=0.0 │ │ ), │ │ structures=( │ │ Structure( │ │ attrs={}, │ │ geometry=Box( │ │ attrs={}, │ │ type='Box', │ │ center=(0.0, 0.0, 0.0), │ │ size=(1.0, 1.0, 1.0) │ │ ), │ │ name=None, │ │ background_permittivity=None, │ │ background_medium=None, │ │ priority=None, │ │ type='Structure', │ │ medium=Medium( │ │ attrs={}, │ │ name=None, │ │ frequency_range=None, │ │ allow_gain=False, │ │ nonlinear_spec=None, │ │ modulation_spec=None, │ │ viz_spec=None, │ │ heat_spec=None, │ │ type='Medium', │ │ permittivity=2.0, │ │ conductivity=0.0 │ │ ) │ │ ), │ │ ), │ │ structure_priority_mode='equal', │ │ plot_length_units='μm', │ │ type='Scene' │ │ ) │ │ self_structure = Structure( │ │ attrs={}, │ │ geometry=Box( │ │ attrs={}, │ │ type='Box', │ │ center=(0.0, 0.0, 0.0), │ │ size=(inf, inf, inf) │ │ ), │ │ name=None, │ │ background_permittivity=None, │ │ background_medium=None, │ │ priority=None, │ │ type='Structure', │ │ medium=Medium( │ │ attrs={}, │ │ name=None, │ │ frequency_range=None, │ │ allow_gain=False, │ │ nonlinear_spec=None, │ │ modulation_spec=None, │ │ viz_spec=None, │ │ heat_spec=None, │ │ type='Medium', │ │ permittivity=1.0, │ │ conductivity=0.0 │ │ ) │ │ ) │ │ shutoff = 1e-05 │ │ simulation_bounds = ( │ │ (np.float64(-2.0), np.float64(-4.3999999999999995), np.float64(-2.0)), │ │ (np.float64(2.0), np.float64(4.399999999999997), np.float64(2.0)) │ │ ) │ │ simulation_geometry = Box( │ │ attrs={}, │ │ type='Box', │ │ center=( │ │ np.float64(0.0), │ │ np.float64(-1.3322676295501878e-15), │ │ np.float64(0.0) │ │ ), │ │ size=(np.float64(4.0), np.float64(8.799999999999997), np.float64(4.0)) │ │ ) │ │ simulation_structure = Structure( │ │ attrs={}, │ │ geometry=Box( │ │ attrs={}, │ │ type='Box', │ │ center=( │ │ np.float64(0.0), │ │ np.float64(-1.3322676295501878e-15), │ │ np.float64(0.0) │ │ ), │ │ size=( │ │ np.float64(4.0), │ │ np.float64(8.799999999999997), │ │ np.float64(4.0) │ │ ) │ │ ), │ │ name=None, │ │ background_permittivity=None, │ │ background_medium=None, │ │ priority=None, │ │ type='Structure', │ │ medium=Medium( │ │ attrs={}, │ │ name=None, │ │ frequency_range=None, │ │ allow_gain=False, │ │ nonlinear_spec=None, │ │ modulation_spec=None, │ │ viz_spec=None, │ │ heat_spec=None, │ │ type='Medium', │ │ permittivity=1.0, │ │ conductivity=0.0 │ │ ) │ │ ) │ │ simulation_type = 'tidy3d' │ │ size = (4.0, 4.0, 4.0) │ │ sources = ( │ │ UniformCurrentSource( │ │ attrs={}, │ │ name=None, │ │ type='UniformCurrentSource', │ │ center=(0.0, 0.0, 0.0), │ │ size=(0.0, 0.0, 0.0), │ │ source_time=GaussianPulse( │ │ attrs={}, │ │ amplitude=1.0, │ │ phase=0.0, │ │ type='GaussianPulse', │ │ freq0=150000000000000.0, │ │ fwidth=10000000000000.0, │ │ offset=5.0, │ │ remove_dc_component=True │ │ ), │ │ interpolate=True, │ │ confine_to_bounds=False, │ │ polarization='Ez' │ │ ), │ │ ) │ │ static_structures = [ │ │ Structure( │ │ attrs={}, │ │ geometry=Box( │ │ attrs={}, │ │ type='Box', │ │ center=(0.0, 0.0, 0.0), │ │ size=(1.0, 1.0, 1.0) │ │ ), │ │ name=None, │ │ background_permittivity=None, │ │ background_medium=None, │ │ priority=None, │ │ type='Structure', │ │ medium=Medium( │ │ attrs={}, │ │ name=None, │ │ frequency_range=None, │ │ allow_gain=False, │ │ nonlinear_spec=None, │ │ modulation_spec=None, │ │ viz_spec=None, │ │ heat_spec=None, │ │ type='Medium', │ │ permittivity=2.0, │ │ conductivity=0.0 │ │ ) │ │ ) │ │ ] │ │ structure_priority_mode = 'equal' │ │ structures = ( │ │ Structure( │ │ attrs={}, │ │ geometry=Box( │ │ attrs={}, │ │ type='Box', │ │ center=(0.0, 0.0, 0.0), │ │ size=(1.0, 1.0, 1.0) │ │ ), │ │ name=None, │ │ background_permittivity=None, │ │ background_medium=None, │ │ priority=None, │ │ type='Structure', │ │ medium=Medium( │ │ attrs={}, │ │ name=None, │ │ frequency_range=None, │ │ allow_gain=False, │ │ nonlinear_spec=None, │ │ modulation_spec=None, │ │ viz_spec=None, │ │ heat_spec=None, │ │ type='Medium', │ │ permittivity=2.0, │ │ conductivity=0.0 │ │ ) │ │ ), │ │ ) │ │ subpixel = SubpixelSpec( │ │ attrs={}, │ │ dielectric=PolarizedAveraging(attrs={}, type='PolarizedAveraging'), │ │ metal=Staircasing(attrs={}, type='Staircasing'), │ │ pec=PECConformal( │ │ attrs={}, │ │ type='PECConformal', │ │ timestep_reduction=0.3, │ │ edge_singularity_correction=True │ │ ), │ │ pmc=Staircasing(attrs={}, type='Staircasing'), │ │ lossy_metal=SurfaceImpedance( │ │ attrs={}, │ │ type='SurfaceImpedance', │ │ timestep_reduction=0.0, │ │ edge_singularity_correction=True │ │ ), │ │ type='SubpixelSpec' │ │ ) │ │ symmetry = (0, 0, 0) │ │ tmesh = array([0.00000000e+00, 3.81314974e-16, 7.62629948e-16, ..., │ │ 9.99426547e-13, 9.99807862e-13, 1.00018918e-12], shape=(2624,)) │ │ type = 'Simulation' │ │ version = '2.10.0rc3' │ │ volumetric_structures = [ │ │ Structure( │ │ attrs={}, │ │ geometry=Box( │ │ attrs={}, │ │ type='Box', │ │ center=(0.0, 0.0, 0.0), │ │ size=(1.0, 1.0, 1.0) │ │ ), │ │ name=None, │ │ background_permittivity=None, │ │ background_medium=None, │ │ priority=None, │ │ type='Structure', │ │ medium=Medium( │ │ attrs={}, │ │ name=None, │ │ frequency_range=None, │ │ allow_gain=False, │ │ nonlinear_spec=None, │ │ modulation_spec=None, │ │ viz_spec=None, │ │ heat_spec=None, │ │ type='Medium', │ │ permittivity=2.0, │ │ conductivity=0.0 │ │ ) │ │ ) │ │ ] │ │ wvl_mat_min = np.float64(1.4132352000025548) │ │ zero_dims = [] │ ╰─────────────────────────────────────────────────────────────────────────────────────────────────────────────────╯
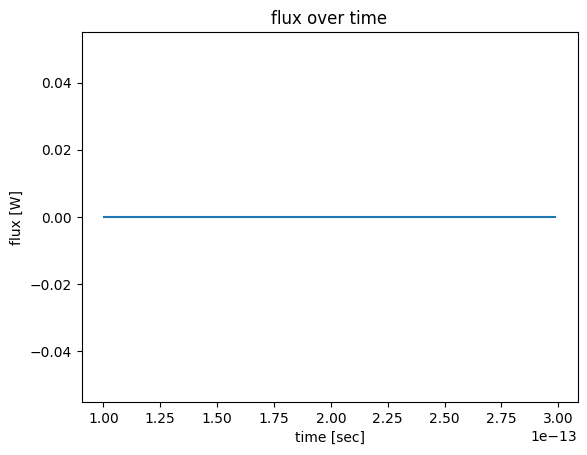
Monitor Data#
Data for each monitor is stored as its corresponding MonitorData instance.
The monitor data can be found using the monitor.name by indexing into the SimulationData using square brackets.
The data are stored as xarray objects, which means they work similarly to numpy arrays but provide many additional useful features. For more details refer to the tutorial on data visualization.
[24]:
flux_data = sim_data["flux_over_time"].flux
flux_data.plot()
plt.title("flux over time")
plt.show()
For field data, we can further index by fields specified in the monitor, as follows.
[25]:
Ey = sim_data["fields_at_150THz"].Ey

Ey.real.plot(x="x", y="y", robust=True)
plt.title("real{Ey(x, y)}")
plt.show()
Finally, SimulationData provides a method for potting field data with structure overlay, similar to sim.viz_fields2D().
[26]:
sim_data.plot_field("fields_at_150THz", "Ey", val="real")
plt.show()
Plugins#
Here we will discuss the plugins that support and extend functionalities of Tidy3D, including:
These plugins are designed to import and make use of Tidy3D components described above, but the Tidy3D components have no dependence on the plugins by design. In this sense, they can be considered “external” packages that are useful for defining simulation components.
The components from these plugins can be imported as
from tidy3d.plugins.{plugin_name} import {component}
for example
from tidy3d.plugins.mode import ModeSolver
We won’t go into the details in this notebook as each of the plugins has its own example tutorial notebook, but here is a summary:
Dispersion Fitting#
We provide a tool for fitting optical data to create dispersive mediums.
Given a file or arrays containing wavelength, n, and (optionally) k data, this tool will fit the data to a pole-residue model with some constraints and parameters.
After fitting, the user can visualize and inspect the results.
This process can be repeated until the user is satisfied, at which point the tool can return a dispersive medium for use in the Simulation.
For more details, see the corresponding tutorial.
Mode Solver#
The mode plugin provides a mode solver, which is mainly useful for coming up with ModeSpec objects for a given source or monitor.
The tool takes a reference simulation containing some waveguide or other structure definitions to feed to the core solver. It also requires a Box specifying the plane on which to solve the modes for.
Then, the user can iteratively send different ModeSpec objects, solve for the results, visualize, and repeat the process until satisfied.
The resulting ModeSpec can be saved directly, or used in conjunction with the mode solver settings to return a ModeSource or ModeMonitor.
For more details, see the corresponding tutorial.
Scattering Matrix#
The smatrix plugin provides a wrapper for computing S-matrix components using Tidy3D simulations from the Component Modeler plugin.
This tool allows users to connect “ports” to their simulation and post-processes the results into a datastructure that can be queried for S-matrix data.
For more details, see the corresponding tutorial.
Simple Inverse Design#
The goal of invdes is to provide a simpler interface for setting up most practical inverse design problems. It wraps tidy3d’s native automatic differentiation support to perform the gradient calculations, but allows the user to focus on the important aspects of their design without getting into the details of autograd.
For more details, see the corresponding tutorial.
Adjoint#
The native autograd integration allows users to write functions involving a Tidy3D Simulation run and take efficient gradients of those functions. Regular tidy3d components and web.run() are differentiable without any change of syntax.
For more details, see the corresponding tutorial.
Resonance Finder#
The resonance plugin provides an interface for analyzing time series data using the technique of “harmonic inversion” and using that data to find resonances in the simulation.
For more details, see the corresponding tutorial.
PolySlab#
The polyslab plugin extends the normal td.PolySlab functionality to provide more features needed for self-intersecting and complex geometries.
For more details, see the corresponding tutorial.
Conclusion#
We hope this gives a useful overview of the main changes in the revamped version of Tidy3D.
We highly recommend you check out the various tutorials in our examples page. If you are new to the finite-difference time-domain (FDTD) method, we highly recommend going through our FDTD101 tutorials.
FDTD simulations can diverge due to various reasons. If you run into any simulation divergence issues, please follow the steps outlined in our troubleshooting guide to resolve it.