tidy3d.components.base_sim.simulation.AbstractSimulation#
- class AbstractSimulation[source]#
Bases:
Box,ABCBase class for simulation classes of different solvers.
- Parameters:
center (Attribute:
center) –TypeTuple[float, float, float]
Default= (0.0, 0.0, 0.0)
Unitsum
DescriptionCenter of object in x, y, and z.
size (Attribute:
size) –TypeTuple[NonNegativeFloat, NonNegativeFloat, NonNegativeFloat]
DefaultUnitsum
DescriptionSize in x, y, and z directions.
medium (Attribute:
medium) –TypeUnion[Medium, AnisotropicMedium, PECMedium, PoleResidue, Sellmeier, Lorentz, Debye, Drude, FullyAnisotropicMedium, CustomMedium, CustomPoleResidue, CustomSellmeier, CustomLorentz, CustomDebye, CustomDrude, CustomAnisotropicMedium, PerturbationMedium, PerturbationPoleResidue]
Default= Medium(nameNone, frequency_rangeNone, allow_gainFalse, nonlinear_specNone, modulation_specNone, heat_specNone, type’Medium’, permittivity1.0, conductivity0.0)
DescriptionBackground medium of simulation, defaults to vacuum if not specified.
structures (Attribute:
structures) –TypeTuple[Structure, …]
Default= ()
DescriptionTuple of structures present in simulation. Note: Structures defined later in this list override the simulation material properties in regions of spatial overlap.
symmetry (Attribute:
symmetry) –TypeTuple[Literal[0, -1, 1], Literal[0, -1, 1], Literal[0, -1, 1]]
Default= (0, 0, 0)
DescriptionTuple of integers defining reflection symmetry across a plane bisecting the simulation domain normal to the x-, y-, and z-axis at the simulation center of each axis, respectively. Each element can be
0(no symmetry),1(even, i.e. ‘PMC’ symmetry) or-1(odd, i.e. ‘PEC’ symmetry). Note that the vectorial nature of the fields must be taken into account to correctly determine the symmetry value.sources (Attribute:
sources) –TypeTuple[NoneType, …]
Default= ()
DescriptionSources in the simulation.
boundary_spec (Attribute:
boundary_spec) –TypeOptional[NoneType]
Default= None
DescriptionSpecification of boundary conditions.
monitors (Attribute:
monitors) –TypeTuple[NoneType, …]
Default= ()
DescriptionMonitors in the simulation.
grid_spec (Attribute:
grid_spec) –TypeOptional[NoneType]
Default= None
DescriptionSpecifications for the simulation grid.
version (Attribute:
version) –Typestr
Default= 2.6.0rc1
DescriptionString specifying the front end version number.
Attributes
Scene instance associated with the simulation.
Simulation bounds including auxiliary boundary zones such as PML layers.
The entire simulation domain including auxiliary boundary zones such as PML layers.
Returns structure representing the domain of the simulation.
Defines the front end version of tidy3d
Methods
from_scene(scene, **kwargs)Create a simulation from a :class:.`Scene` instance.
get_monitor_by_name(name)Return monitor named 'name'.
plot([x, y, z, ax, source_alpha, ...])Plot each of simulation's components on a plane defined by one nonzero x,y,z coordinate.
plot_boundaries([x, y, z, ax])Plot the simulation boundary conditions as lines on a plane
plot_monitors([x, y, z, hlim, vlim, alpha, ax])Plot each of simulation's monitors on a plane defined by one nonzero x,y,z coordinate.
plot_sources([x, y, z, hlim, vlim, alpha, ax])Plot each of simulation's sources on a plane defined by one nonzero x,y,z coordinate.
plot_structures([x, y, z, ax, hlim, vlim])Plot each of simulation's structures on a plane defined by one nonzero x,y,z coordinate.
plot_structures_eps([x, y, z, freq, alpha, ...])Plot each of simulation's structures on a plane defined by one nonzero x,y,z coordinate.
plot_structures_heat_conductivity([x, y, z, ...])Plot each of simulation's structures on a plane defined by one nonzero x,y,z coordinate.
plot_symmetries([x, y, z, hlim, vlim, ax])Plot each of simulation's symmetries on a plane defined by one nonzero x,y,z coordinate.
- medium#
Background medium of simulation, defaults to vacuum if not specified.
See also
- Material Library:
The material library is a dictionary containing various dispersive models from real world materials.
- Index:
Dispersive and dispersionless Mediums models.
Notebooks:
Lectures:
GUI:
- structures#
Tuple of structures present in simulation. Structures defined later in this list override the simulation material properties in regions of spatial overlap.
Example
Simple application reference:
Simulation(
    ...
    structures=[
         Structure(
         geometry=Box(size=(1, 1, 1), center=(0, 0, 0)),
         medium=Medium(permittivity=2.0),
         ),
    ],
    ...
)
Usage Caveats
It is very important to understand the way the dielectric permittivity of the
Structurelist is resolved by the simulation grid. Withoutsubpixelaveraging, the structure geometry in relation to the grid points can lead to its features permittivity not being fully resolved by the simulation.For example, in the image below, two silicon slabs with thicknesses 150nm and 175nm centered in a grid with spatial discretization \(\Delta z = 25\text{nm}\) will compute equivalently because that grid does not resolve the feature permittivity in between grid points without
subpixelaveraging.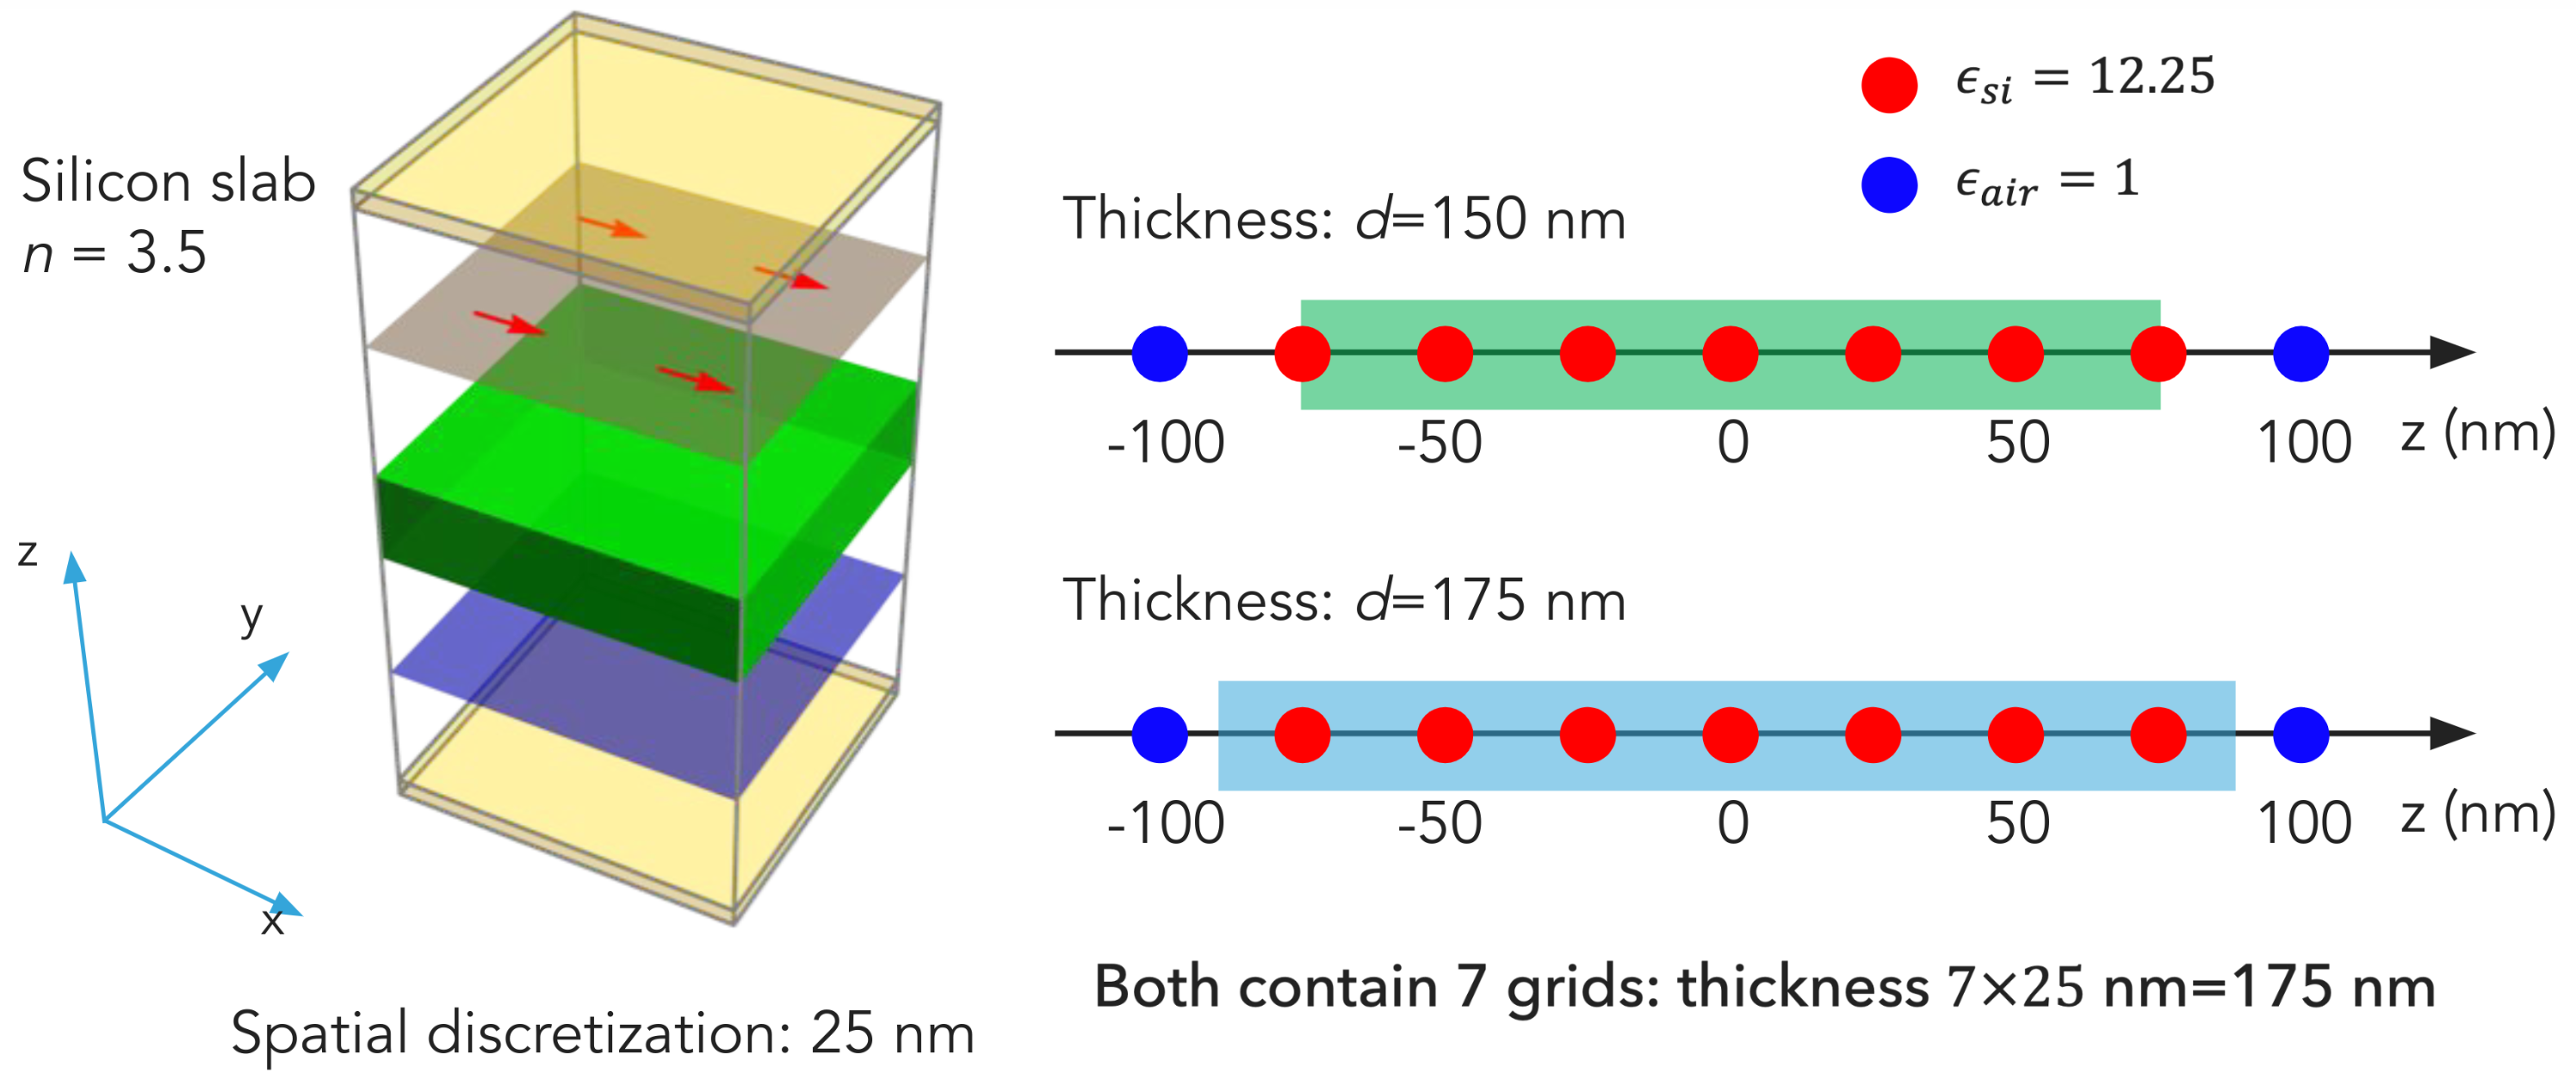
See also
Structure:Defines a physical object that interacts with the electromagnetic fields.
subpixelSubpixel averaging of the permittivity based on structure definition, resulting in much higher accuracy for a given grid size.
Notebooks:
Lectures:
GUI:
- symmetry#
You should set the
symmetryparameter in yourSimulationobject using a tuple of integers defining reflection symmetry across a plane bisecting the simulation domain normal to the x-, y-, and z-axis. Each element can be 0 (no symmetry), 1 (even, i.e.PMCsymmetry) or -1 (odd, i.e.PECsymmetry). Note that the vectorial nature of the fields must be considered to determine the symmetry value correctly.The figure below illustrates how the electric and magnetic field components transform under
PEC- andPMC-like symmetry planes. You can refer to this figure when considering whether a source field conforms to aPEC- orPMC-like symmetry axis. This would be helpful, especially when dealing with optical waveguide modes.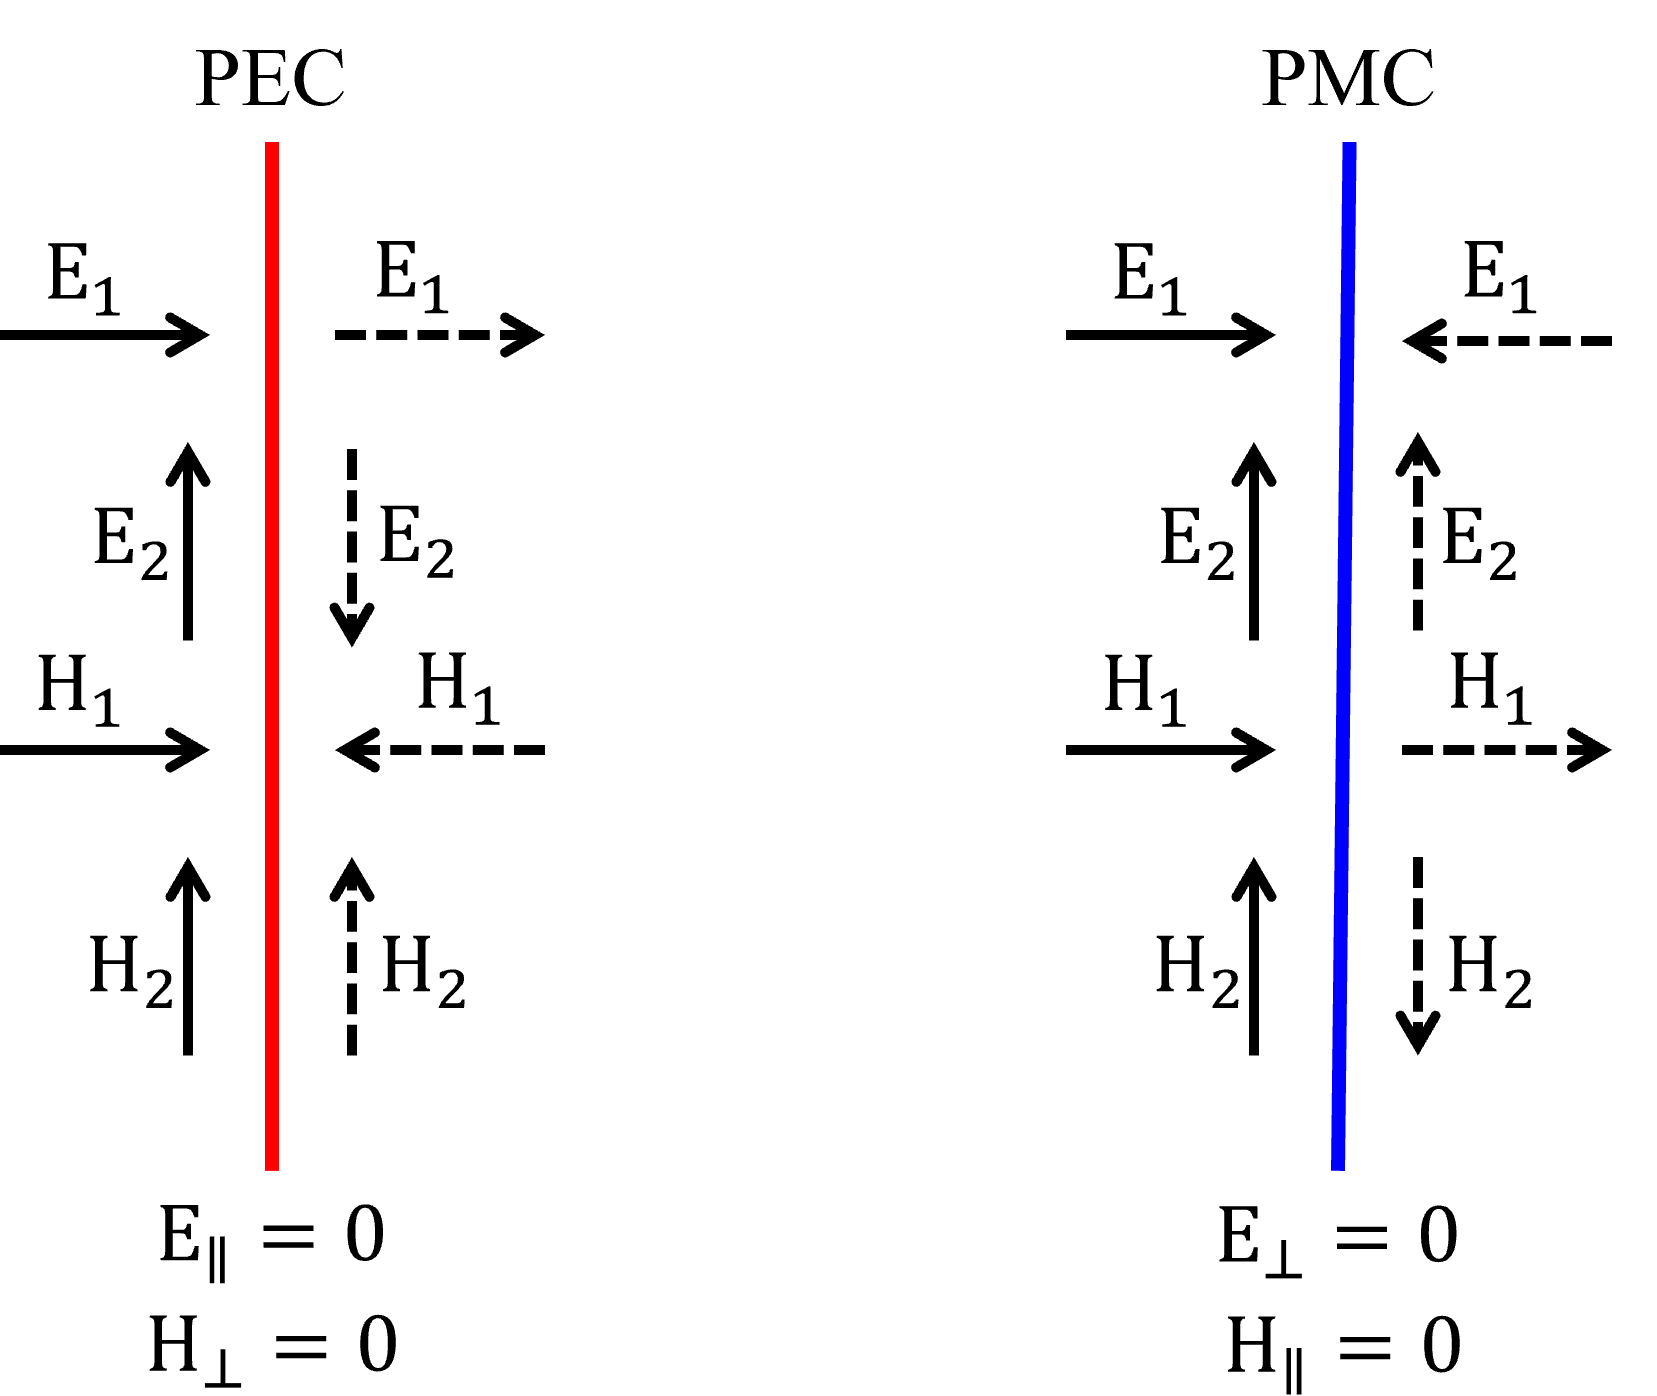
- sources#
- boundary_spec#
- monitors#
- grid_spec#
- version#
Validating setup
- property scene#
Scene instance associated with the simulation.
- property simulation_bounds#
Simulation bounds including auxiliary boundary zones such as PML layers.
- property simulation_geometry#
The entire simulation domain including auxiliary boundary zones such as PML layers. It is identical to
Simulation.geometryin the absence of such auxiliary zones.
- property simulation_structure#
Returns structure representing the domain of the simulation. This differs from
Simulation.scene.background_structurein that it has finite extent.
- plot(x=None, y=None, z=None, ax=None, source_alpha=None, monitor_alpha=None, hlim=None, vlim=None, **patch_kwargs)[source]#
Plot each of simulation’s components on a plane defined by one nonzero x,y,z coordinate.
- Parameters:
x (float = None) – position of plane in x direction, only one of x, y, z must be specified to define plane.
y (float = None) – position of plane in y direction, only one of x, y, z must be specified to define plane.
z (float = None) – position of plane in z direction, only one of x, y, z must be specified to define plane.
source_alpha (float = None) – Opacity of the sources. If
None, uses Tidy3d default.monitor_alpha (float = None) – Opacity of the monitors. If
None, uses Tidy3d default.ax (matplotlib.axes._subplots.Axes = None) – Matplotlib axes to plot on, if not specified, one is created.
hlim (Tuple[float, float] = None) – The x range if plotting on xy or xz planes, y range if plotting on yz plane.
vlim (Tuple[float, float] = None) – The z range if plotting on xz or yz planes, y plane if plotting on xy plane.
- Returns:
The supplied or created matplotlib axes.
- Return type:
matplotlib.axes._subplots.Axes
- plot_sources(x=None, y=None, z=None, hlim=None, vlim=None, alpha=None, ax=None)[source]#
Plot each of simulation’s sources on a plane defined by one nonzero x,y,z coordinate.
- Parameters:
x (float = None) – position of plane in x direction, only one of x, y, z must be specified to define plane.
y (float = None) – position of plane in y direction, only one of x, y, z must be specified to define plane.
z (float = None) – position of plane in z direction, only one of x, y, z must be specified to define plane.
hlim (Tuple[float, float] = None) – The x range if plotting on xy or xz planes, y range if plotting on yz plane.
vlim (Tuple[float, float] = None) – The z range if plotting on xz or yz planes, y plane if plotting on xy plane.
alpha (float = None) – Opacity of the sources, If
Noneuses Tidy3d default.ax (matplotlib.axes._subplots.Axes = None) – Matplotlib axes to plot on, if not specified, one is created.
- Returns:
The supplied or created matplotlib axes.
- Return type:
matplotlib.axes._subplots.Axes
- plot_monitors(x=None, y=None, z=None, hlim=None, vlim=None, alpha=None, ax=None)[source]#
Plot each of simulation’s monitors on a plane defined by one nonzero x,y,z coordinate.
- Parameters:
x (float = None) – position of plane in x direction, only one of x, y, z must be specified to define plane.
y (float = None) – position of plane in y direction, only one of x, y, z must be specified to define plane.
z (float = None) – position of plane in z direction, only one of x, y, z must be specified to define plane.
hlim (Tuple[float, float] = None) – The x range if plotting on xy or xz planes, y range if plotting on yz plane.
vlim (Tuple[float, float] = None) – The z range if plotting on xz or yz planes, y plane if plotting on xy plane.
alpha (float = None) – Opacity of the sources, If
Noneuses Tidy3d default.ax (matplotlib.axes._subplots.Axes = None) – Matplotlib axes to plot on, if not specified, one is created.
- Returns:
The supplied or created matplotlib axes.
- Return type:
matplotlib.axes._subplots.Axes
- plot_symmetries(x=None, y=None, z=None, hlim=None, vlim=None, ax=None)[source]#
Plot each of simulation’s symmetries on a plane defined by one nonzero x,y,z coordinate.
- Parameters:
x (float = None) – position of plane in x direction, only one of x, y, z must be specified to define plane.
y (float = None) – position of plane in y direction, only one of x, y, z must be specified to define plane.
z (float = None) – position of plane in z direction, only one of x, y, z must be specified to define plane.
hlim (Tuple[float, float] = None) – The x range if plotting on xy or xz planes, y range if plotting on yz plane.
vlim (Tuple[float, float] = None) – The z range if plotting on xz or yz planes, y plane if plotting on xy plane.
ax (matplotlib.axes._subplots.Axes = None) – Matplotlib axes to plot on, if not specified, one is created.
- Returns:
The supplied or created matplotlib axes.
- Return type:
matplotlib.axes._subplots.Axes
- abstract plot_boundaries(x=None, y=None, z=None, ax=None, **kwargs)[source]#
- Plot the simulation boundary conditions as lines on a plane
defined by one nonzero x,y,z coordinate.
- Parameters:
x (float = None) – position of plane in x direction, only one of x, y, z must be specified to define plane.
y (float = None) – position of plane in y direction, only one of x, y, z must be specified to define plane.
z (float = None) – position of plane in z direction, only one of x, y, z must be specified to define plane.
ax (matplotlib.axes._subplots.Axes = None) – Matplotlib axes to plot on, if not specified, one is created.
**kwargs – Optional keyword arguments passed to the matplotlib
LineCollection. For details on accepted values, refer to Matplotlib’s documentation.
- Returns:
The supplied or created matplotlib axes.
- Return type:
matplotlib.axes._subplots.Axes
- __hash__()#
Hash method.
- plot_structures(x=None, y=None, z=None, ax=None, hlim=None, vlim=None)[source]#
Plot each of simulation’s structures on a plane defined by one nonzero x,y,z coordinate.
- Parameters:
x (float = None) – position of plane in x direction, only one of x, y, z must be specified to define plane.
y (float = None) – position of plane in y direction, only one of x, y, z must be specified to define plane.
z (float = None) – position of plane in z direction, only one of x, y, z must be specified to define plane.
ax (matplotlib.axes._subplots.Axes = None) – Matplotlib axes to plot on, if not specified, one is created.
hlim (Tuple[float, float] = None) – The x range if plotting on xy or xz planes, y range if plotting on yz plane.
vlim (Tuple[float, float] = None) – The z range if plotting on xz or yz planes, y plane if plotting on xy plane.
- Returns:
The supplied or created matplotlib axes.
- Return type:
matplotlib.axes._subplots.Axes
- plot_structures_eps(x=None, y=None, z=None, freq=None, alpha=None, cbar=True, reverse=False, ax=None, hlim=None, vlim=None)[source]#
Plot each of simulation’s structures on a plane defined by one nonzero x,y,z coordinate. The permittivity is plotted in grayscale based on its value at the specified frequency.
- Parameters:
x (float = None) – position of plane in x direction, only one of x, y, z must be specified to define plane.
y (float = None) – position of plane in y direction, only one of x, y, z must be specified to define plane.
z (float = None) – position of plane in z direction, only one of x, y, z must be specified to define plane.
freq (float = None) – Frequency to evaluate the relative permittivity of all mediums. If not specified, evaluates at infinite frequency.
reverse (bool = False) – If
False, the highest permittivity is plotted in black. IfTrue, it is plotteed in white (suitable for black backgrounds).cbar (bool = True) – Whether to plot a colorbar for the relative permittivity.
alpha (float = None) – Opacity of the structures being plotted. Defaults to the structure default alpha.
ax (matplotlib.axes._subplots.Axes = None) – Matplotlib axes to plot on, if not specified, one is created.
hlim (Tuple[float, float] = None) – The x range if plotting on xy or xz planes, y range if plotting on yz plane.
vlim (Tuple[float, float] = None) – The z range if plotting on xz or yz planes, y plane if plotting on xy plane.
- Returns:
The supplied or created matplotlib axes.
- Return type:
matplotlib.axes._subplots.Axes
- plot_structures_heat_conductivity(x=None, y=None, z=None, alpha=None, cbar=True, reverse=False, ax=None, hlim=None, vlim=None)[source]#
Plot each of simulation’s structures on a plane defined by one nonzero x,y,z coordinate. The permittivity is plotted in grayscale based on its value at the specified frequency.
- Parameters:
x (float = None) – position of plane in x direction, only one of x, y, z must be specified to define plane.
y (float = None) – position of plane in y direction, only one of x, y, z must be specified to define plane.
z (float = None) – position of plane in z direction, only one of x, y, z must be specified to define plane.
freq (float = None) – Frequency to evaluate the relative permittivity of all mediums. If not specified, evaluates at infinite frequency.
reverse (bool = False) – If
False, the highest permittivity is plotted in black. IfTrue, it is plotteed in white (suitable for black backgrounds).cbar (bool = True) – Whether to plot a colorbar for the relative permittivity.
alpha (float = None) – Opacity of the structures being plotted. Defaults to the structure default alpha.
ax (matplotlib.axes._subplots.Axes = None) – Matplotlib axes to plot on, if not specified, one is created.
hlim (Tuple[float, float] = None) – The x range if plotting on xy or xz planes, y range if plotting on yz plane.
vlim (Tuple[float, float] = None) – The z range if plotting on xz or yz planes, y plane if plotting on xy plane.
- Returns:
The supplied or created matplotlib axes.
- Return type:
matplotlib.axes._subplots.Axes
- classmethod from_scene(scene, **kwargs)[source]#
Create a simulation from a :class:.`Scene` instance. Must provide additional parameters to define a valid simulation (for example,
size,run_time,grid_spec, etc).- Parameters:
scene (:class:.`Scene`) – Scene containing structures information.
**kwargs – Other arguments