

Postprocessing a case with the WebUI#
Once a case has been run, we can start the fun work: looking at the results. All the tools below are in the Analysis tab on the left of the workbench, described in Analysis.
Checking convergence#
The first thing to do is to check whether the case has converged. You can do this from the Dashboard or from Convergence, which plots the following metrics:
Nonlinear: the nonlinear residuals, always shown.
Linear: convergence of the linear system of equations.
CFL: particularly useful when using Adaptive CFL.
Minmax: the minimum and maximum values of the flow variables and their location, for easy debugging.
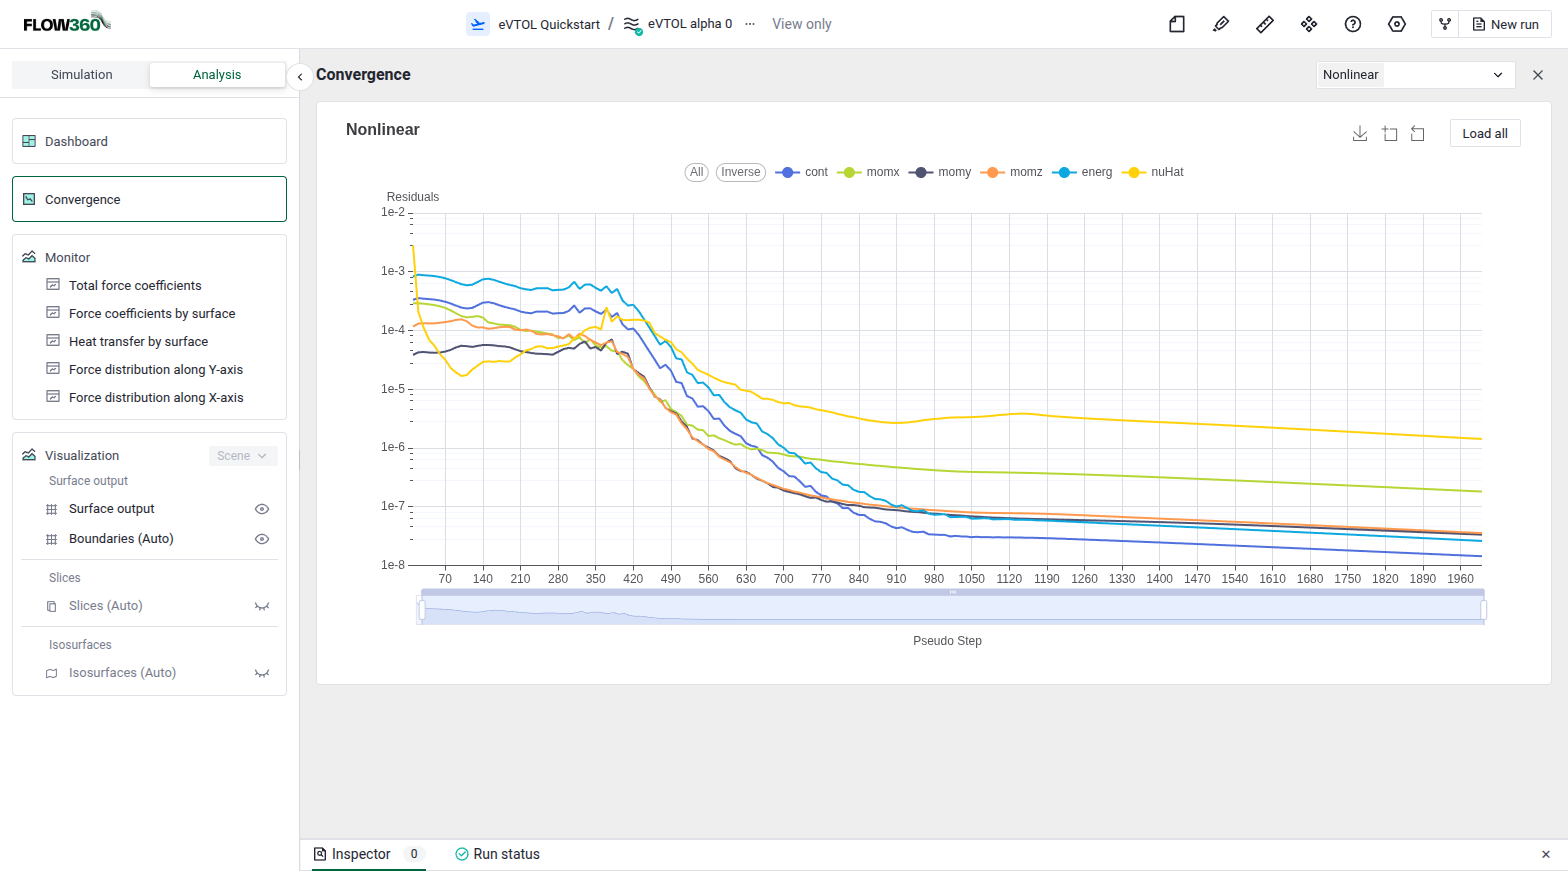
Checking a case’s convergence.#
Once we are comfortable that the case has converged, we can look at forces and visualize flow features.
Force History#
Monitor plots the force histories and distributions of the case. The most useful ones here are:
Total force coefficients: the history of the summed force coefficients on the vehicle.
Force coefficients by surface: the history of the force coefficients on each surface, so each component can be compared with the others.
Force distribution along Y-axis: lift (or drag) against span, to see how lift (or drag) is distributed.
Force distribution along X-axis: drag (or lift) against length, to see where drag (or lift) is created.
All the available plots are described in Monitor.
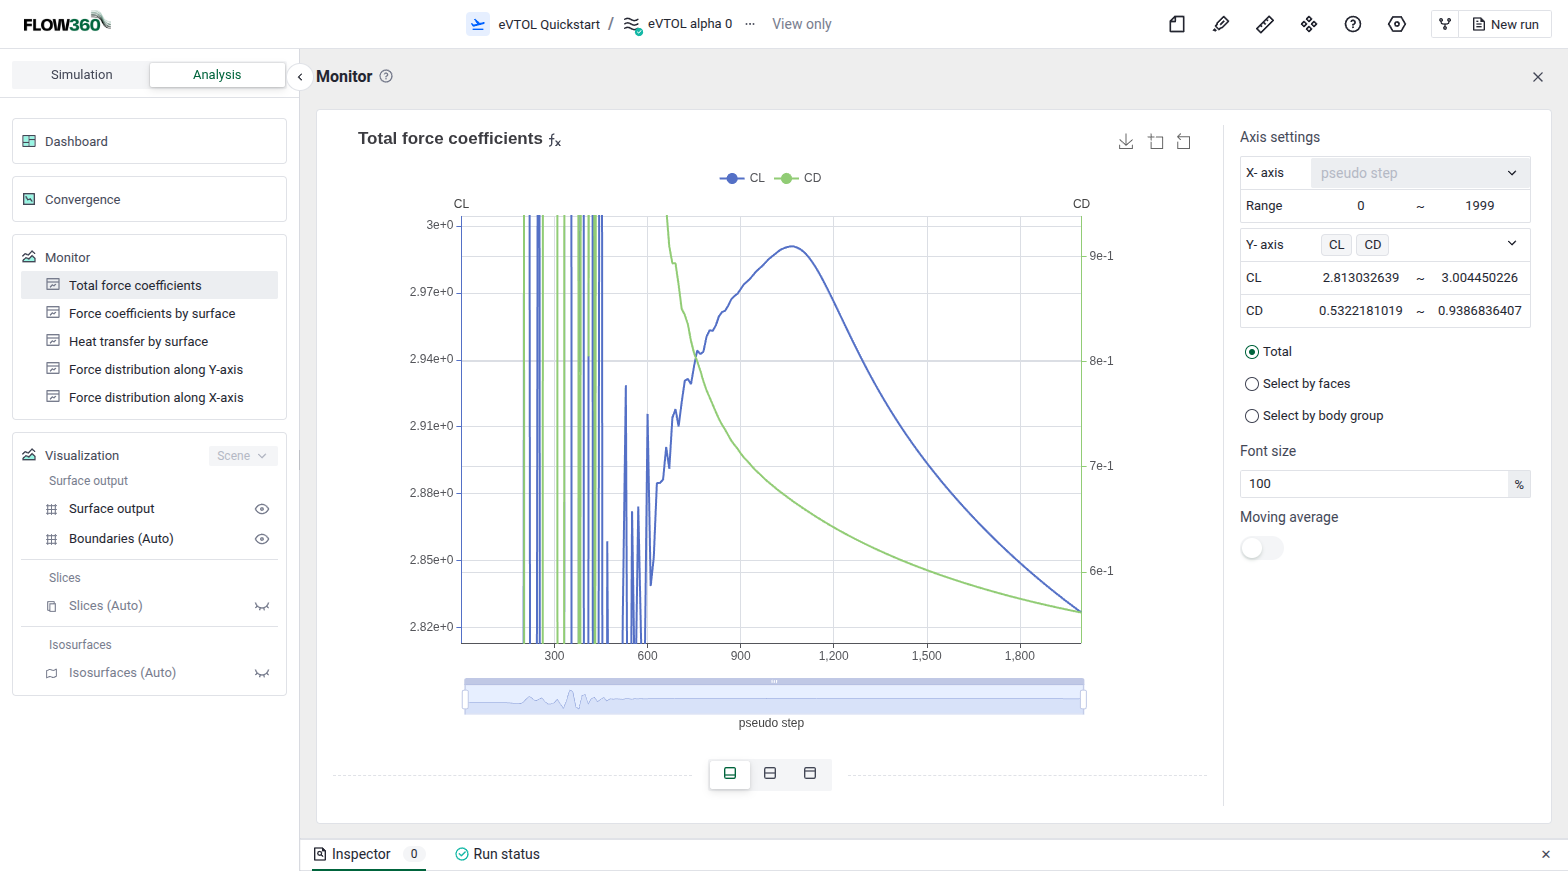
Total lift and drag coefficient history.#
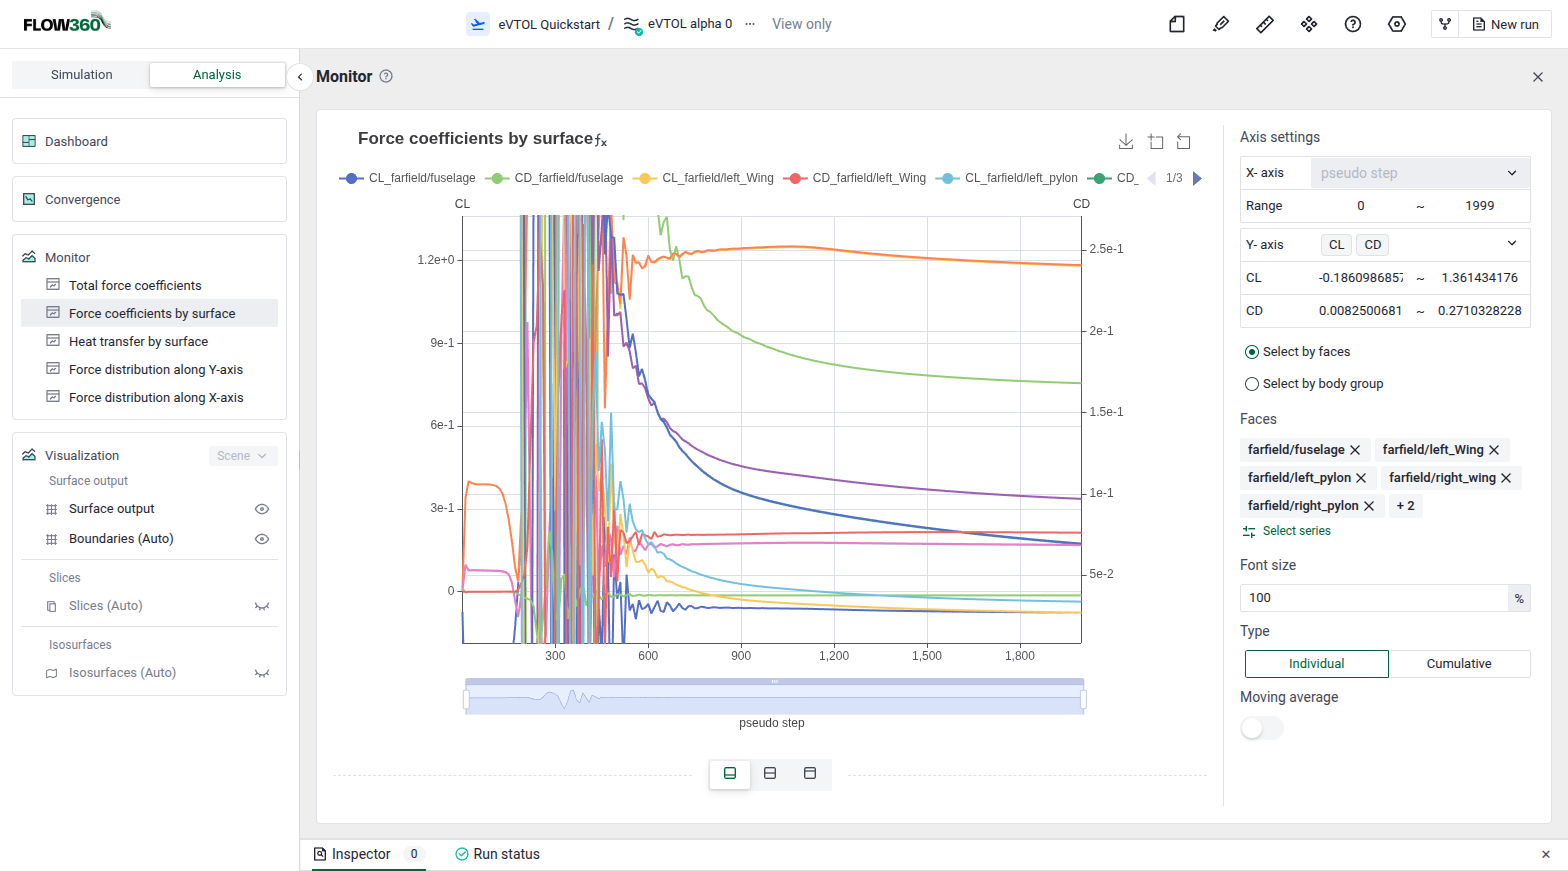
Force coefficient history for the subcomponent surfaces.#
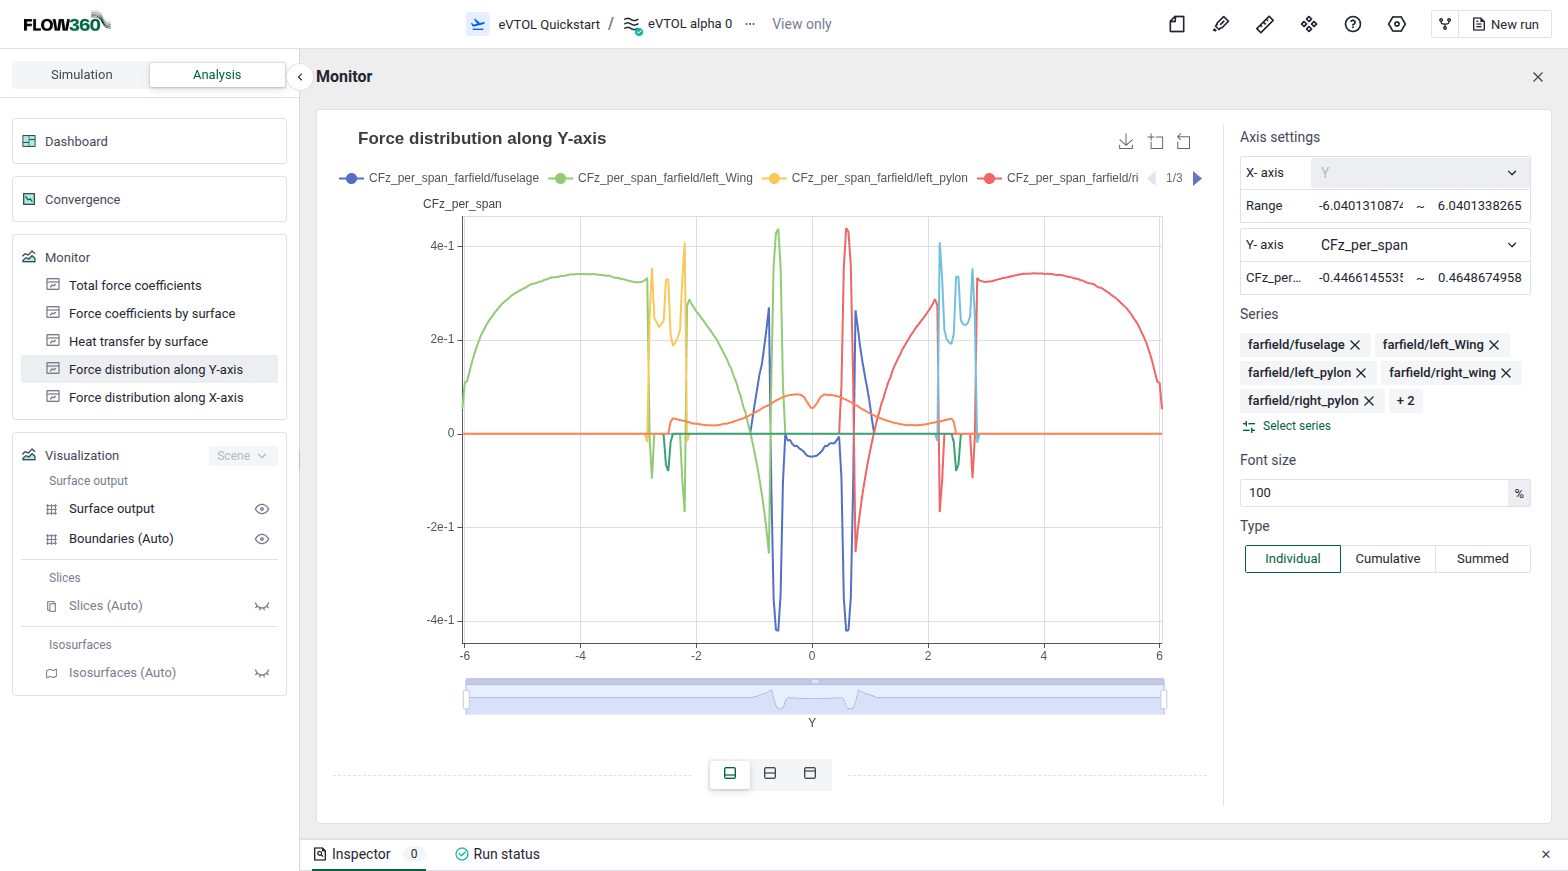
Lift vs span showing where the lift is being created.#
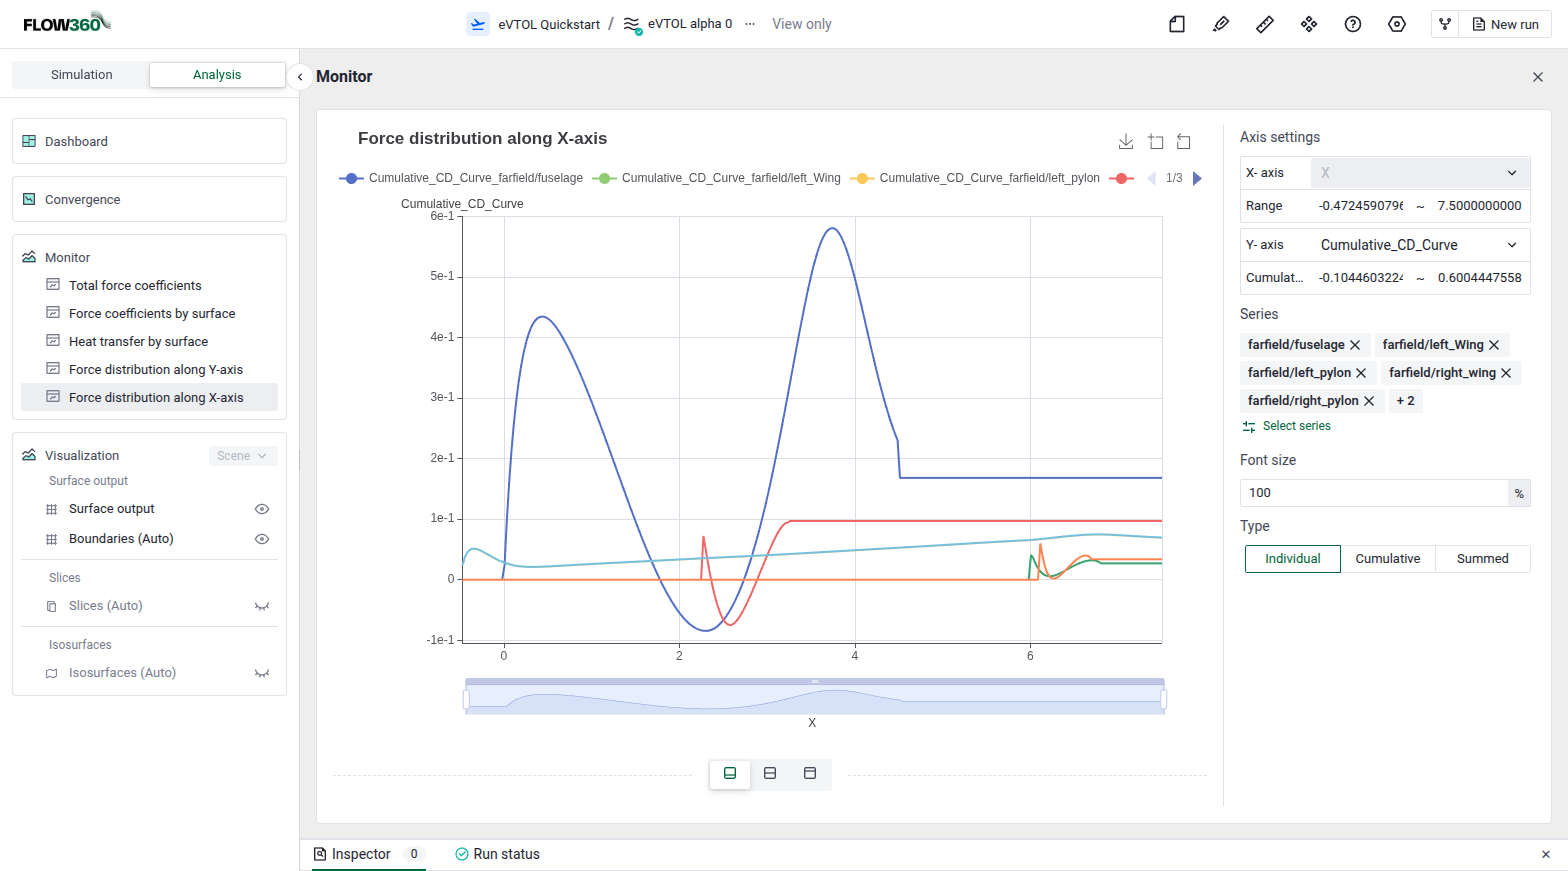
Drag vs length showing where the drag is being created.#
Visualization#
Visualization gives access to the flow-field visualization tools. You can also switch the viewer to it with Visualization in the view selector at the top of the viewer. See Visualization for every option.
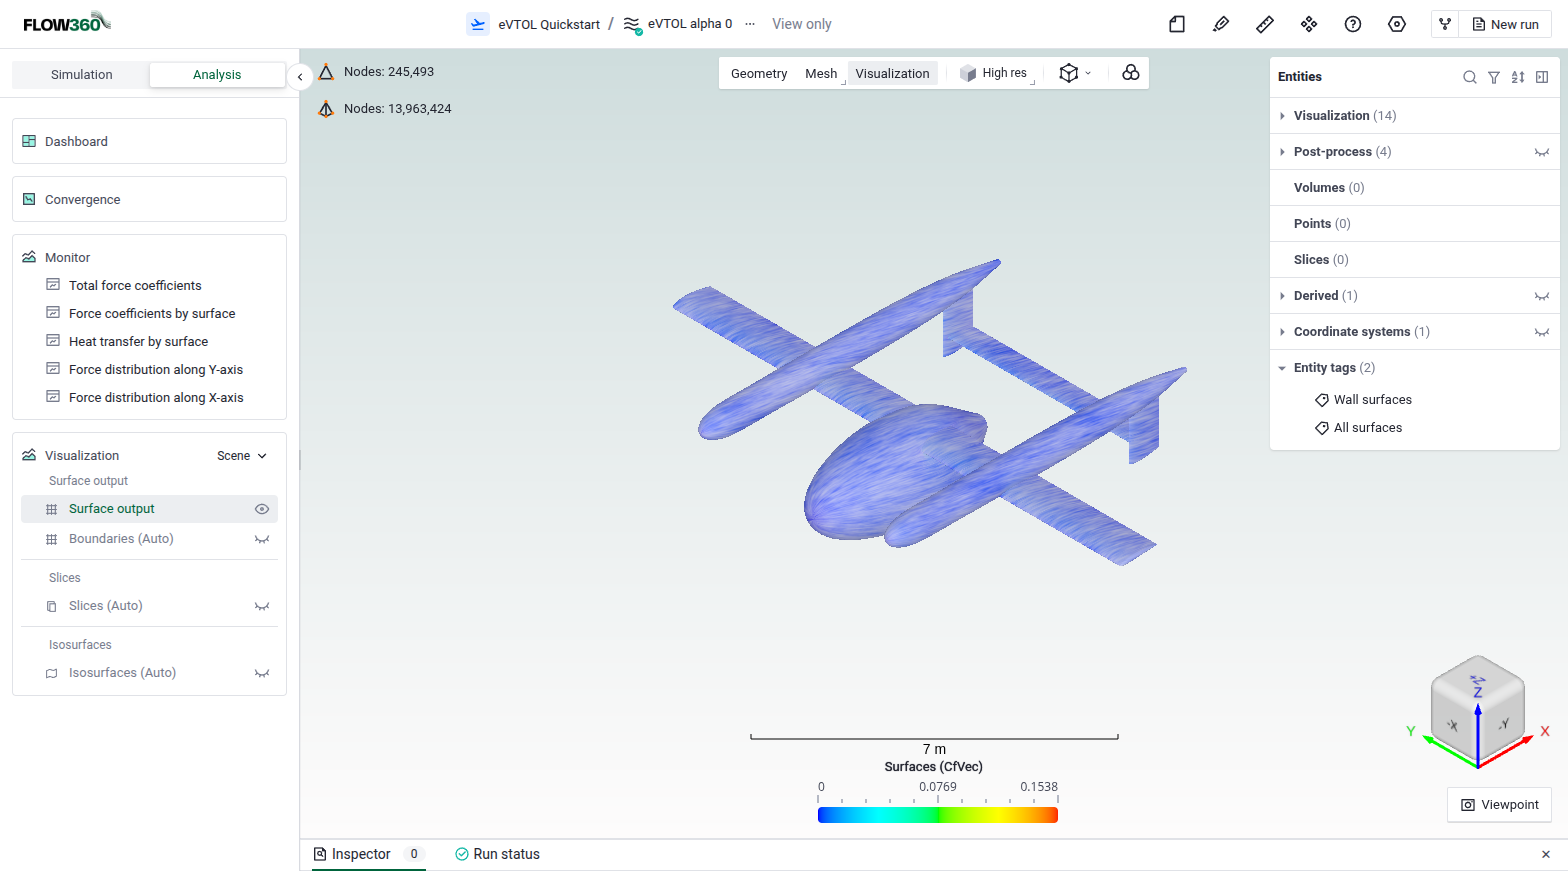
The visualization panel.#
The Visualization panel gives us access to:
Surfaces:#
View the surface flow variables defined in the surface outputs (see case output setup). Click the visibility icon next to Surface output to show it, then click Surface output to choose the field and adjust the colormap. In the figure below, the colormap Max of CfVec was lowered to 0.01 to bring out the variations on the surfaces.
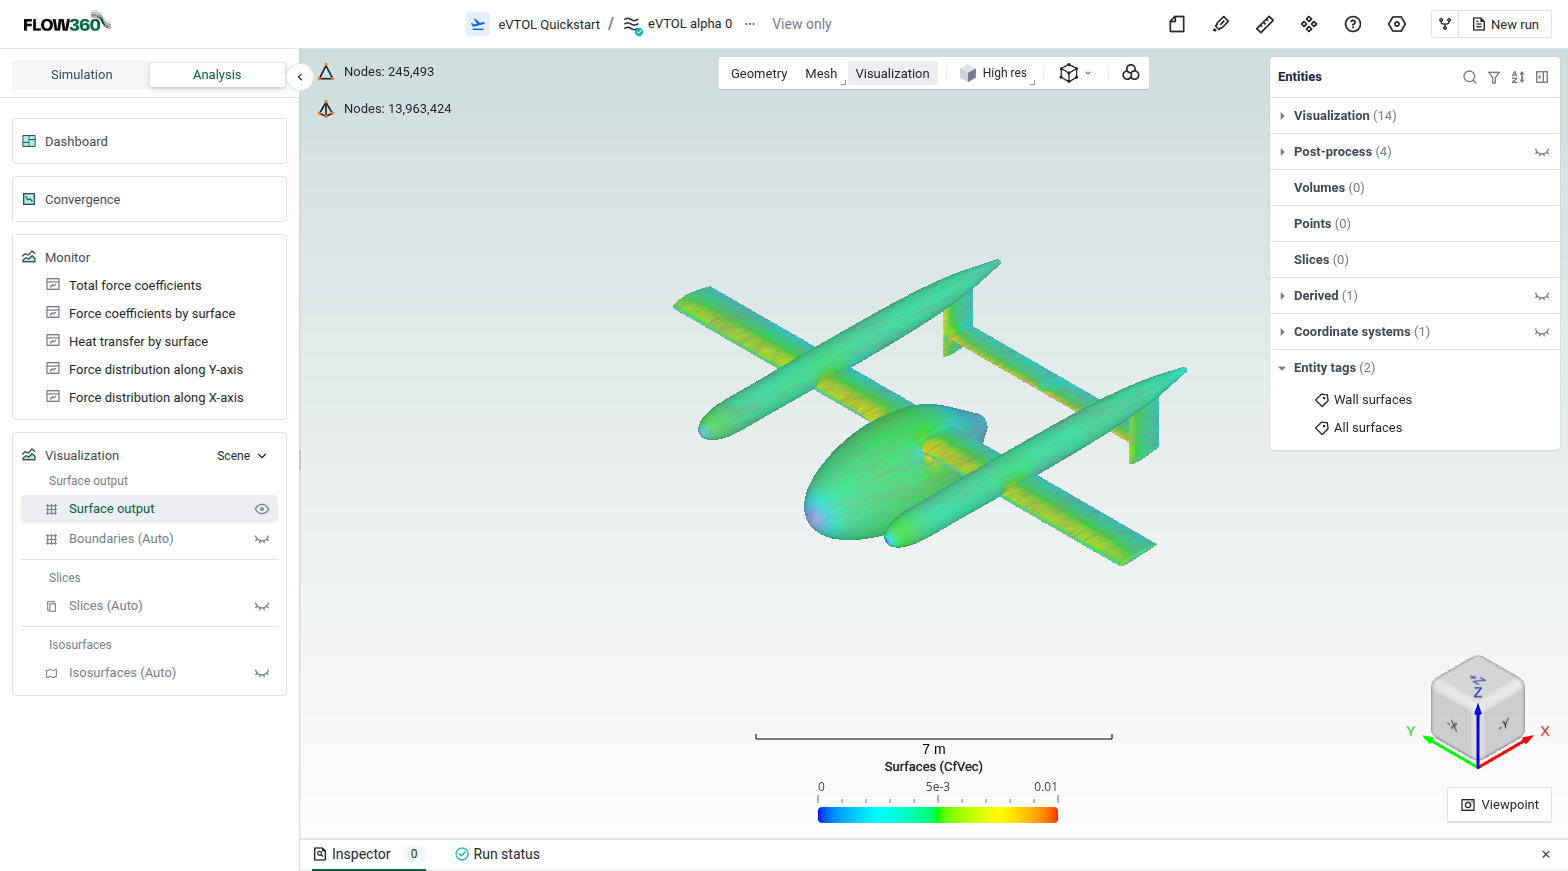
Viewing CfVec on the surface of the eVTOL.#
Slices:#
Any output slices you defined show up here. If you did not define any, three slices through the moment reference center are generated for visualization.
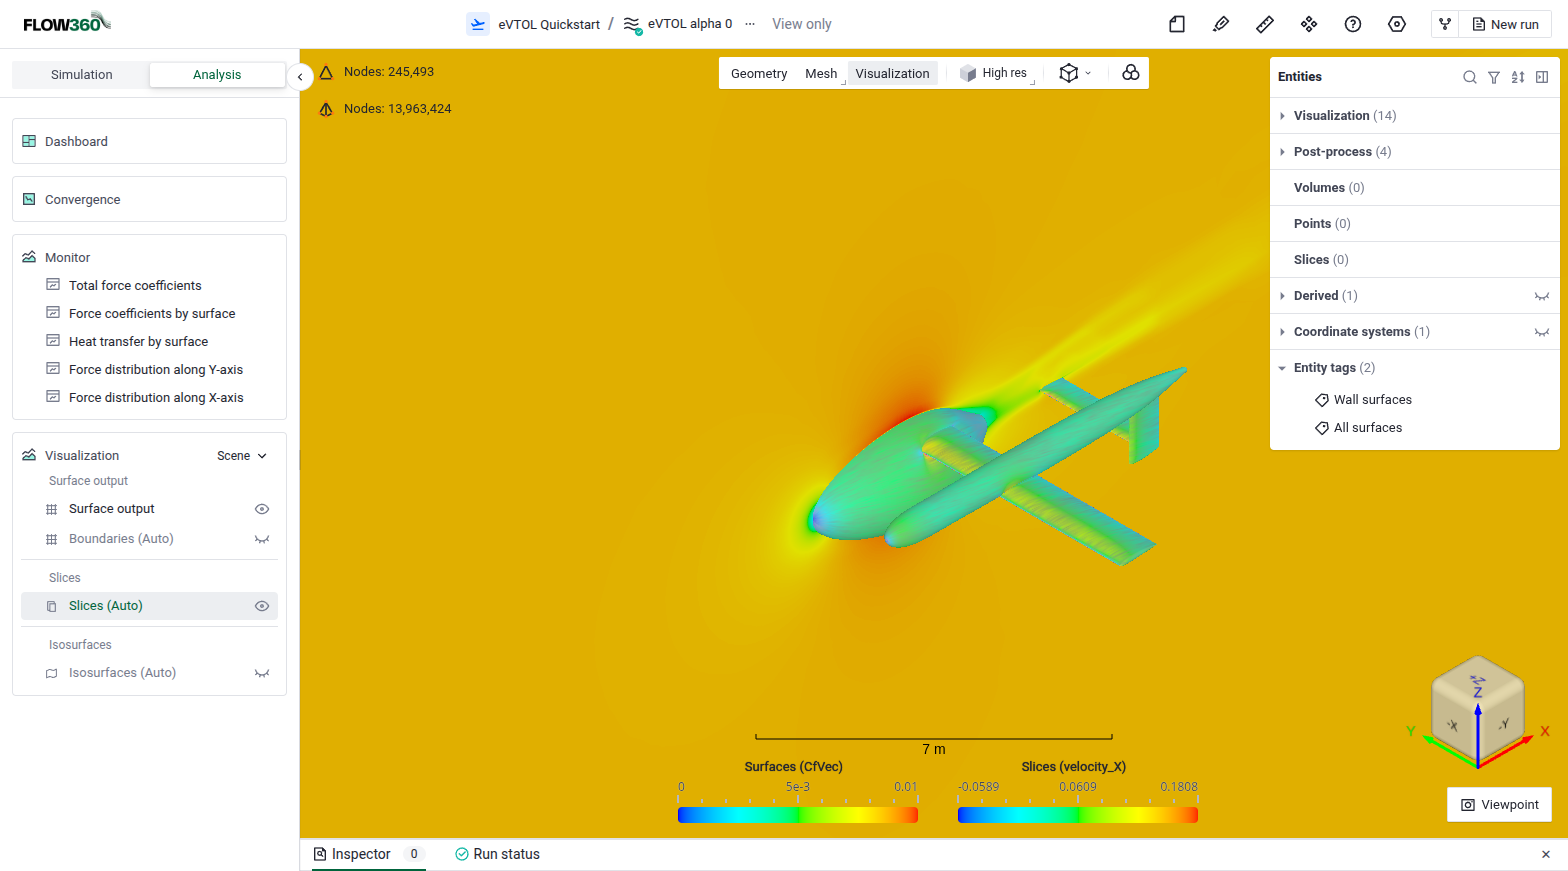
Viewing a constant Y slice.#
Isosurfaces:#
A Q-criterion isosurface is generated automatically to show where vorticity is being shed. This is a very useful way of visualizing important flow features.
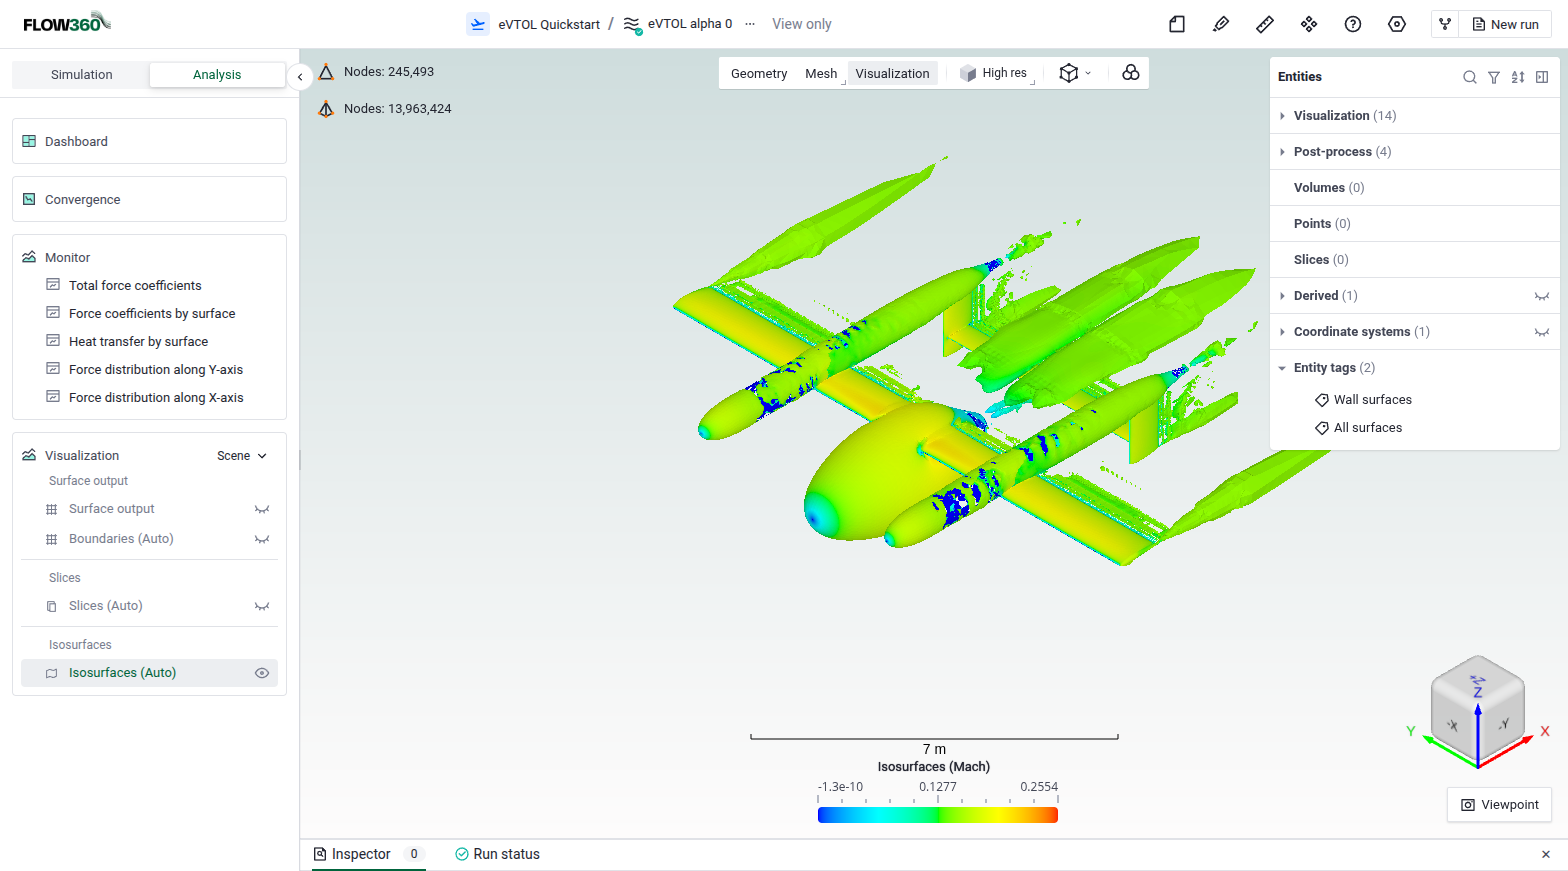
Viewing the Q-criterion isosurfaces.#
Comparing cases#
The case comparison view compares the setups and results of several cases. In the project tree, select the desired cases and click Compare. The comparison view is described in Case comparison.
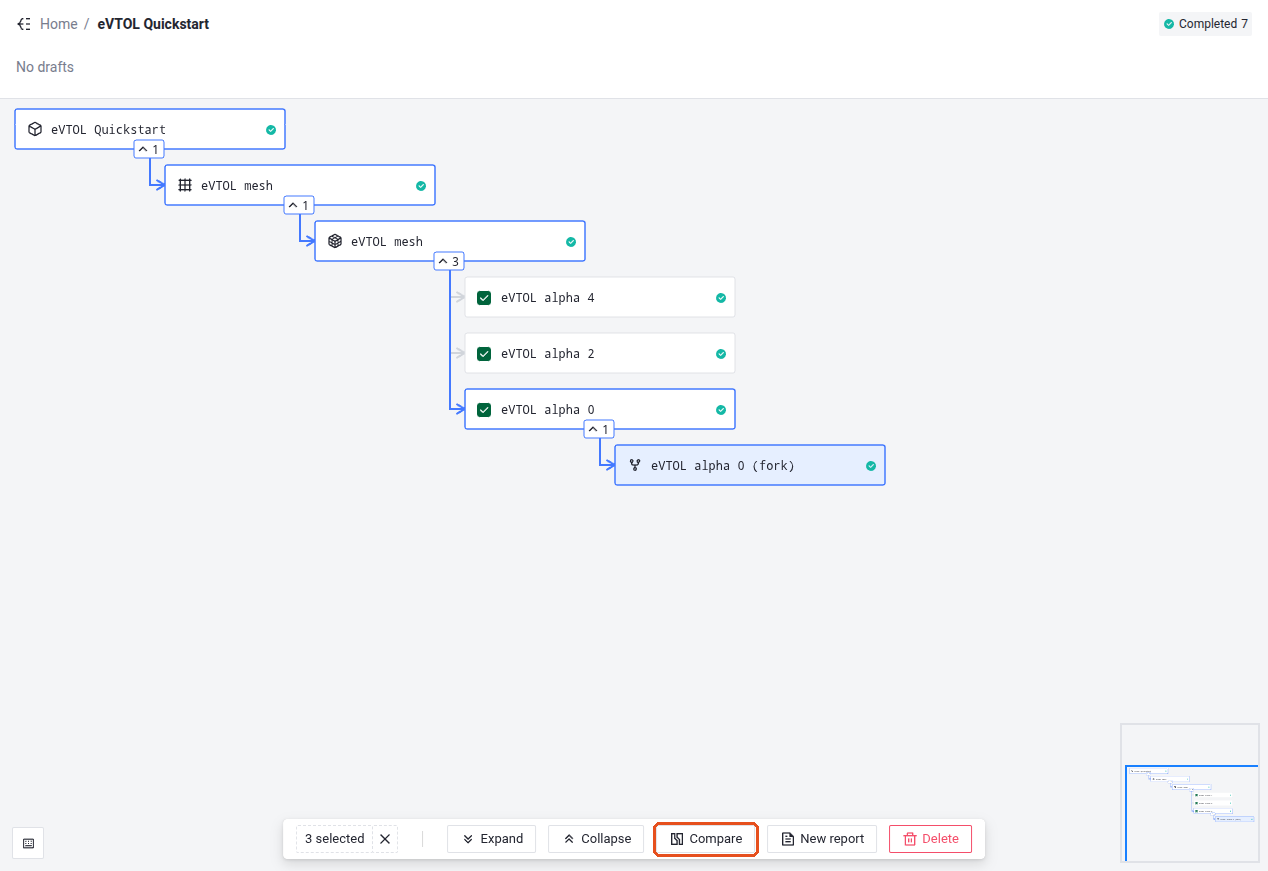
Comparing cases.#
The configuration of each case is compared against a reference case, so you can easily see what differs between them. Select the radio button next to a case name to make it the reference, and click Expand all to show the configuration of every case. Here, eVTOL alpha 0 is the reference, and only the alpha angle changes from one case to the next.
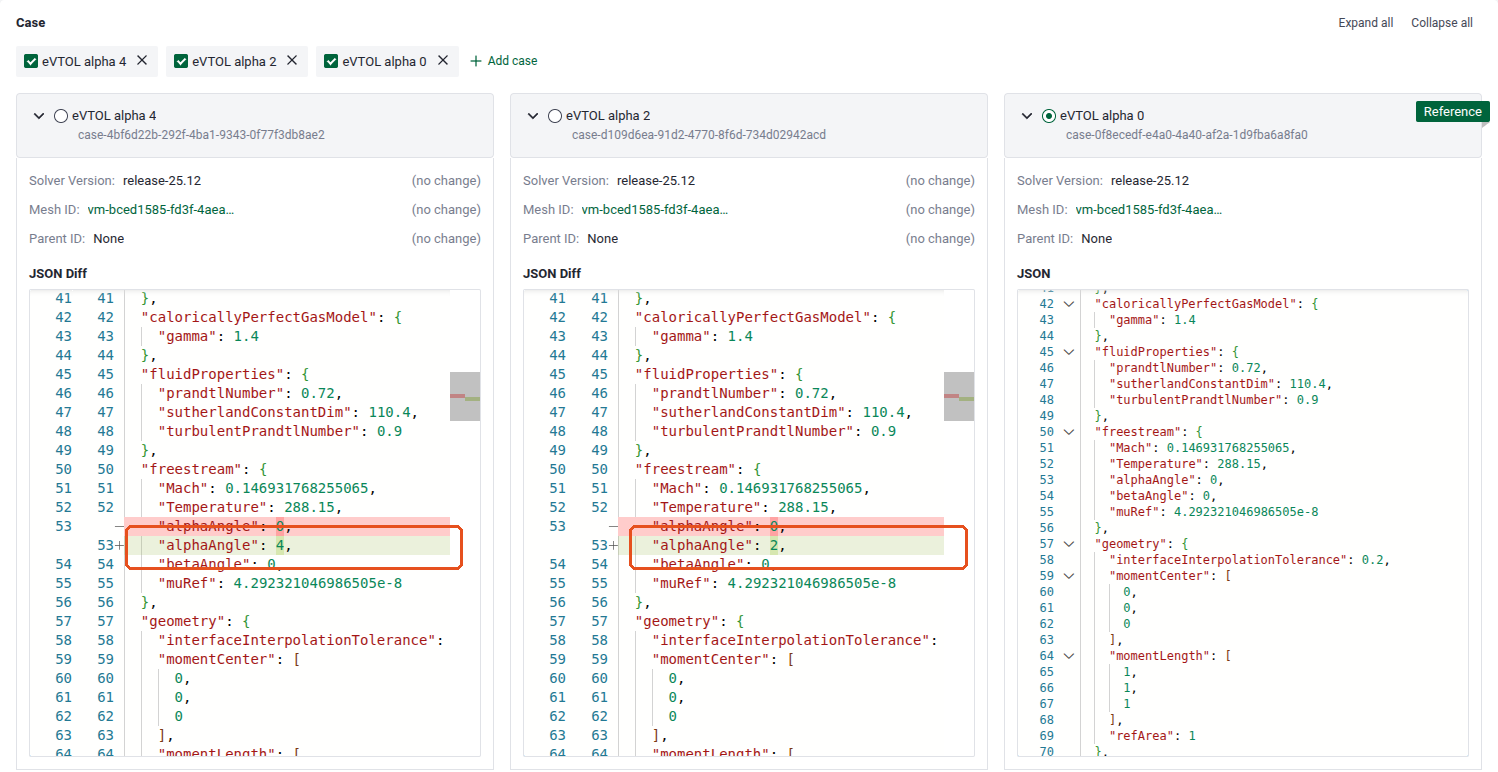
Comparing case inputs.#
Below the cases, the view opens with an Alpha Sweep Chart that plots CL against freestream.alphaAngle. Change the X-axis and Y-axis (forces) variables to plot other results, or click XY plot to add another chart.
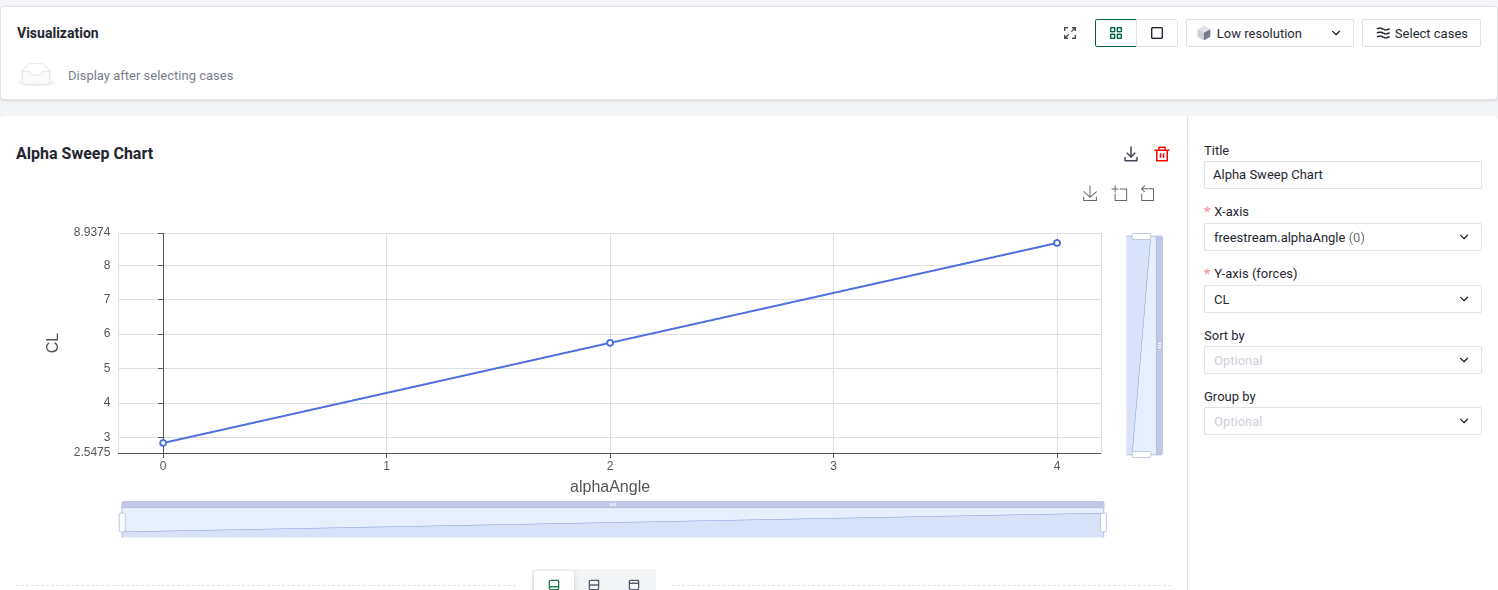
Plotting the results across multiple cases.#
Click Series plot to add a chart of the history of selected variables for all the cases. Its Kind selector sets what is plotted. In this example, we show the convergence history of the nonlinear residuals across the 3 cases, but you can also plot the force and moment histories or the minimum and maximum values of the state variables.
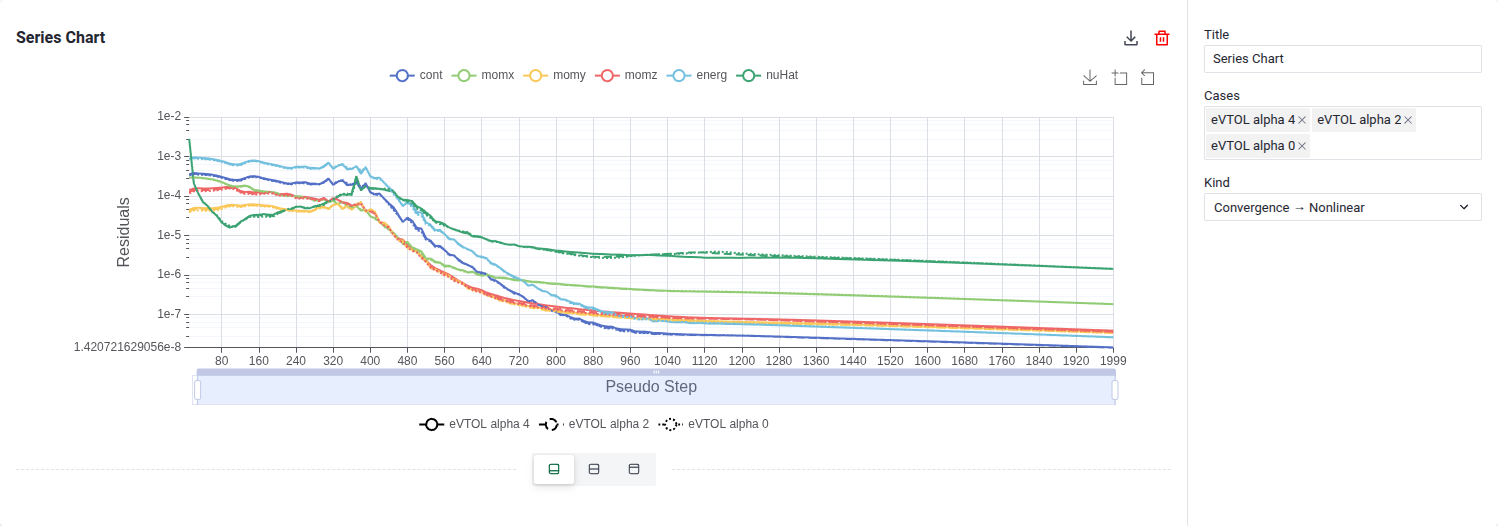
Plotting the convergence history.#
Project Assets#
All the files generated at the various steps of the import, meshing and solving process are available to download. These include logs, results files and output CSV tables.
To access them, click the Assets button in the top bar. The Assets window has one tab per entity (geometry, surface mesh, volume mesh or case), each with its list of files to download. The most useful ones are usually results/total_forces_v2.csv, which contains the history of the aggregated forces on the vehicle, and results/surface_forces_v2.csv, which contains the force history on every surface of your vehicle.
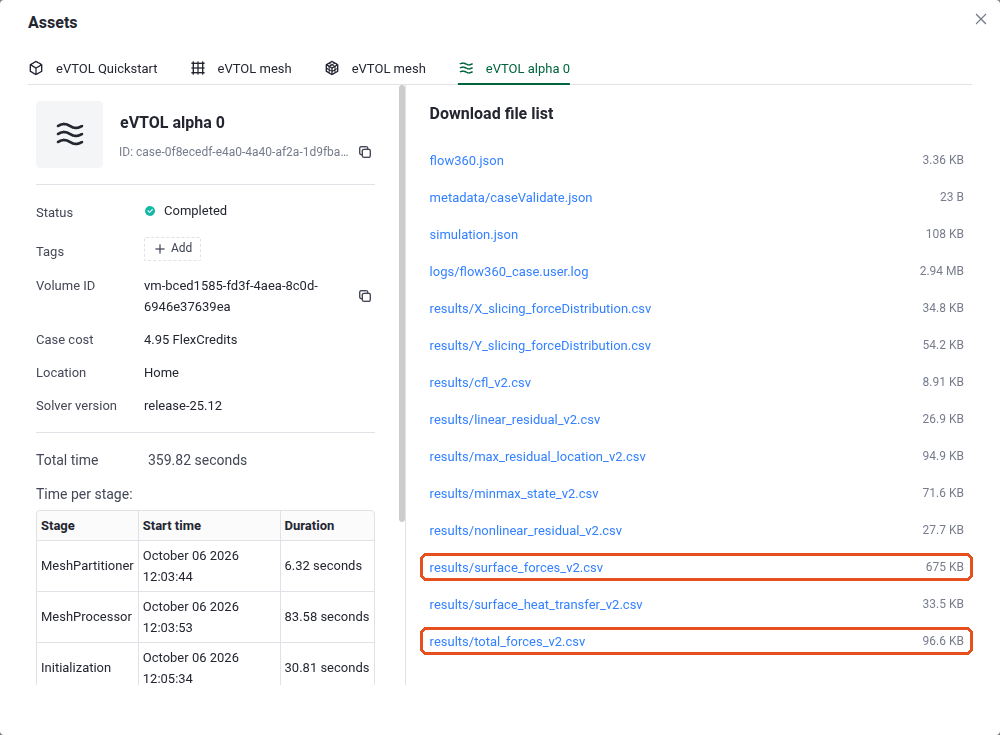
Accessing files to download.#
Congratulations on running your first Flow360 simulation 😄.